UNITED STATES
SECURITIES AND EXCHANGE COMMISSION
WASHINGTON, DC 20549
FORM
AMENDMENT NO. 1
(Mark One)
|
|
REGISTRATION STATEMENT PURSUANT TO SECTION 12(b) OR 12(g) OF THE SECURITIES EXCHANGE ACT OF 1934 |
OR
|
|
ANNUAL REPORT PURSUANT TO SECTION 13 OR 15(d) OF THE SECURITIES EXCHANGE ACT OF 1934 |
For the fiscal year ended
OR
|
|
TRANSITION REPORT PURSUANT TO SECTION 13 OR 15(d) OF THE SECURITIES EXCHANGE ACT OF 1934 |
OR
|
|
SHELL COMPANY REPORT PURSUANT TO SECTION 13 OR 15(d) OF THE SECURITIES EXCHANGE ACT OF 1934 |
Date of event requiring this shell company report: Not applicable
For the transition period from _______ to _______
Commission file number:
(Exact name of Registrant as specified in its charter)
Not Applicable
(Translation of Registrant's name into English)
(Jurisdiction of incorporation or organization)
(Address of principal executive offices)
(Name, Telephone, E-mail and/or Facsimile number and Address of Company Contact Person)
Securities registered or to be registered pursuant to Section 12(b) of the Act:
| Title of class | Trading Symbol(s) | Name of exchange on which registered |
|
|
|
Toronto Stock Exchange |
Securities registered or to be registered pursuant to Section 12(g) of the Act: None
Securities for which there is a reporting obligation pursuant to Section 15(d) of the Act: None
Indicate the number of outstanding shares of each of the issuer's classes of capital or common stock as of the close of the period covered by the annual report:
Indicate by check mark if the registrant is a well-known seasoned issuer, as defined in Rule 405 of the Securities Act.
☐ Yes ☒
If this report is an annual or transition report, indicate by check mark if the registrant is not required to file reports pursuant to Section 13 or 15(d) of the Securities Exchange Act of 1934.
☐ Yes ☒
Indicate by check mark whether the registrant (1) has filed all reports required to be filed by Section 13 or 15(d) of the Securities Exchange Act of 1934 during the preceding 12 months (or for such shorter period that the registrant was required to file such reports), and (2) has been subject to such filing requirements for the past 90 days.
☒
Indicate by check mark whether the registrant has submitted electronically every Interactive Data File required to be submitted pursuant to Rule 405 of Regulation S-T (§232.405 of this chapter) during the preceding 12 months (or for such shorter period that the registrant was required to submit such files).
☒
Indicate by check mark whether the registrant is a large accelerated filer, an accelerated filer, a non-accelerated filer, or an emerging growth company. See definition of "large accelerated filer," "accelerated filer" and "emerging growth company" in Rule 12b-2 of the Exchange Act.
| Large accelerated filer ☐ |
|
Non-accelerated filer ☐ |
| Emerging growth company |
If an emerging growth company that prepares its financial statements in accordance with U.S. GAAP, indicate by check mark if the registrant has elected not to use the extended transition period for complying with any new or revised financial accounting standards† provided pursuant to Section 13(a) of the Exchange Act. ☐
† The term "new or revised financial accounting standard" refers to any update issued by the Financial Accounting Standards Board to its Accounting Standards Codification after April 5, 2012.
Indicate by check mark whether the registrant has filed a report on and attestation to its management's assessment of the effectiveness of its internal control over financial reporting under Section 404(b) of the Sarbanes-Oxley Act (15 U.S.C. 7262(b)) by the registered public accounting firm that prepared or issued its audit report.
If securities are registered pursuant to Section 12(b) of the Act, indicate by check mark whether the financial statements of the registrant included in the filing reflect the correction of an error to previously issued financial statements.
Indicate by check mark whether any of those error corrections are restatements that required a recovery analysis of incentive based compensation received by any of the registrant's executive officers during the relevant recovery period pursuant to §240.10D-1(b). ☐
Indicate by check mark which basis of accounting the registrant has used to prepare the financial statements included in this filing:
U.S. GAAP ☐
If "Other" has been checked in response to the previous question, indicate by check mark which financial statement item the registrant has elected to follow.
☐ Item 17 ☐ Item 18
If this is an annual report, indicate by check mark whether the registrant is a shell company (as defined in Rule 12b-2 of the Exchange Act).
☐ Yes
EXPLANATORY NOTE
Lithium Argentina AG (the "Company") is filing this Amendment No. 1 ("Amendment No. 1") to the Annual Report on Form 20-F for the year ended December 31, 2024 (the "2024 Form 20-F"), as filed with the United States Securities and Exchange Commission (the "SEC") on March 31, 2025 (the "Original Filing Date"), to:
- file the SEC Technical Report Summary Lithium Resource Estimate Pastos Grandes Project Salta Province, Argentina and update relevant mining disclosure in "Item 4: Information on the Company - D. Property, Plants and Equipment";
- update senior management compensation and relevant disclosure in "Item 6: Directors, Senior Management and Employees - Summary Compensation Table"; and
- supplement "Item 18: Financial Statements" and "Item 19: Exhibits" of the 2024 Form 20-F with the inclusion of the audited financial statements of Minera Exar S.A. (the "Minera Exar Financial Statements"), including the report of Price Waterhouse & Co. S.R.L., an independent registered public accounting firm, relating thereto as required under Rule 3-09 of Regulation S-X.
Pursuant to Rule 12b-15 under the Securities Exchange Act of 1934, this Amendment No. 1 also includes, as Exhibits 12.1, 12.2, 13.1 and 13.2, the certifications of the Principal Executive Officer and Principal Financial Officer of the Company pursuant to Sections 302 and 906 of the Sarbanes-Oxley Act of 2002. This Amendment No. 1 also includes Exhibit 15.13, which contains the consent of Price Waterhouse & Co. S.R.L., an independent registered public accounting firm, with respect to their report included in the Minera Exar Financial Statements.
Except as described above, no changes have been made to the 2024 Form 20-F, and this Amendment No. 1 does not modify, amend or update the financial or other information contained in the 2024 Form 20-F. This Amendment No. 1 does not reflect any events that have occurred on or after the Original Filing Date. Among other things, the Company has not revised forward-looking statements made in the 2024 Form 20-F to reflect events that occurred or facts that became known to the Company after the Original Filing Date. Therefore, this Amendment No. 1 should be read in conjunction with the 2024 Form 20-F and any other documents that the Company has filed with the SEC on or after the Original Filing Date.
ITEM 4. INFORMATION ON THE COMPANY
A. History and Development of the Company
Overview
The Company was incorporated under the BCBCA on November 27, 2007 under the name "Western Lithium Canada Corporation" and changed its name to "Western Lithium USA Corporation" on May 31, 2010. The Company amended its Articles in 2013 to add advance notice requirements for the election of directors, and in 2015 to give the Board the authority by resolution to alter the Company's authorized share capital and to make amendments to the Articles, except as otherwise specifically provided in the Articles or the BCBCA. On March 21, 2016, the Company changed its name to "Lithium Americas Corp." On November 8, 2017, the Company consolidated its outstanding Shares on a 5:1 basis.
On January 25, 2022, the Company acquired all of the issued and outstanding securities of Millennial Lithium by way of a plan of arrangement (the "Millennial Arrangement"), at which point Millennial Lithium became a wholly owned subsidiary of the Company.
On April 20, 2023, the Company acquired all the common shares of Arena Minerals (the "Arena Shares"), which it did not already own, by way of a plan of arrangement, at which point Arena Minerals became a wholly owned subsidiary of the Company.
On October 3, 2023, the Company completed the Separation Transaction pursuant to which the Company separated its previously-held North American business unit, comprising the Thacker Pass project, as well as investments in Green Technology Metals Ltd. and Ascend Elements, Inc., into an independent public company named "Lithium Americas Corp.", which is listed on the TSX and NYSE. The Company retained its Argentine business unit, consisting of a 44.8% interest in Cauchari-Olaroz, the majority-owned Pastos Grandes Project and a 65% interest in the Sal de la Puna project. The Company's Shares continued to trade on the TSX and the NYSE following the Separation Transaction.
In August 2024, Ganfeng acquired $70 million in newly issued shares of PGCo, the Company's wholly-owned Argentinian subsidiary holding the Pastos Grandes Project, representing a 14.9% interest in PGCo and Pastos Grandes. The Company retained control of PGCo following this transaction. Proceeds from this transaction were allocated to the advancement of the Company's lithium projects in Argentina, including the reduction of the short-term debt of the Cauchari-Olaroz tied to start-up and working capital. In connection with the Pastos Grandes Transaction, Lithium Argentina, certain of its subsidiaries (the "Lithium Argentina Parties") and Ganfeng and its subsidiary (the "Ganfeng Lithium Parties", and together with the Lithium Argentina Parties, the "Parties") entered into a shareholders' agreement (the "Shareholders' Agreement") that, among other terms, provides for limited rights and obligations as between the Parties, including the following: (i) from the closing date until December 31, 2024, a standstill on the sale of an interest in PGCo or the Pastos Grandes Project; (ii) through to December 31, 2025, enhanced consent rights in favour of the Ganfeng Lithium Parties in respect of operational matters, as well as a right of first refusal in favour of the Ganfeng Lithium Parties over a sale of an interest in PGCo at the same valuation as that applicable to the Pastos Grandes Transaction (with the Lithium Argentina Parties having a right of first refusal over a sale by the Ganfeng Lithium Parties of the 14.9% interest); (iii) through to December 31, 2025, a right in favour of the Ganfeng Lithium Parties to acquire an aggregate 50% interest in the Pastos Grandes Project upon a change of control of Lithium Argentina by subscribing for share capital of PGCo in consideration for an incremental cash subscription price of $330 million; (iv) until December 31, 2025, an obligation to obtain consent of the Parties for any offtake agreement in respect of the Pastos Grandes Project; and (v) from January 1, 2025 to September 30, 2025, an enhanced 'tag-along' right of the Ganfeng Lithium Parties to include its interest along with a sale by the Lithium Argentina Parties of their interest in PGCo, and to realize a portion of the consideration that would otherwise be payable to the Lithium Argentina Parties upon such sale in addition to the equivalent proportionate consideration payable for the interest of the Ganfeng Lithium Parties (after such period the "tag along right" will survive but will only include the proportionate consideration).
1
On January 23, 2025, the Company completed its corporate migration to Switzerland, establishing corporate domicile in Switzerland. On January 27, 2025, the Shares began trading on the TSX and NYSE under a new symbol "LAR."
In connection with the Company's corporate migration to Switzerland, the Company appointed PricewaterhouseCoopers AG, Zug, Switzerland as its Swiss independent statutory auditor (the "Swiss Statutory Auditor"). The Swiss Statutory Auditor's main task is to audit the standalone statutory financial statements and consolidated financial statements of Lithium Argentina AG for Swiss law purposes.
The Company continues to retain PricewaterhouseCoopers LLP, Vancouver, Canada as the Company's Independent Registered Public Accounting Firm for Canadian and U.S. Securities law reporting (the "Auditor" and together with the Swiss Statutory Auditor, the "External Auditors"). The Company's registered and head office is located at Dammstrasse 19, 6300 Zug, Switzerland. The Company's North American contact address is 300 - 900 West Hastings Street, Vancouver, British Columbia, Canada, V6C 1E5, and the Company's telephone number is (778) 656-5820. The operational headquarters of the Company is Buenos Aires, Argentina.
Corporate Highlights
In February 2024, the Company announced the appointment of Samuel Pigott as President and CEO. Mr. Pigott assumed the role of President and CEO in March 2024 and was also appointed to the Company's Board.
In March 2024, Monica Moretto was appointed to the Board.
In August 2024 the Company completed an agreement whereby Ganfeng acquired $70 million in newly issued shares of PGCo, the Company's wholly-owned Argentinian subsidiary holding Pastos Grandes, representing a 14.9% interest in PGCo and Pastos Grandes.
In October 2024, Cauchari-Olaroz achieved commercial production after reaching elevated production levels for a sustained period of time.
On January 23, 2025, the Company completed its corporate migration to Switzerland, establishing corporate domicile in Switzerland. On January 27, 2025, the Shares began trading on the TSX and NYSE under a new symbol "LAR."
During the year ended December 31, 2024, the Company met its production guidance for Cauchari-Olaroz, with approximately 25,400 tonnes of lithium carbonate produced.
Other Investments and Acquisitions
On January 25, 2022, the Company acquired 100% of the issued and outstanding securities of Millennial Lithium pursuant to the Millennial Arrangement, for aggregate consideration of approximately $492 million (US$390 million). The terms of the Millennial Arrangement were set forth in an arrangement agreement dated November 17, 2021, between the Company and Millennial Lithium. Pursuant to the Millennial Arrangement, as of the effective date for the Millennial Arrangement of January 25, 2022, all outstanding convertible securities of Millennial Lithium were exchanged for Millennial Shares and all equity incentive plans of Millennial Lithium were terminated. Following this, the Company acquired all of the issued and outstanding Millennial Shares and Millennial Lithium became a wholly-owned subsidiary of the Company. Each Millennial Lithium shareholder of record as of the effective date received per share consideration of 0.1261 of a Share and $0.001 in cash in exchange for each Millennial Share held as of the effective date. As a final step under the Millennial Arrangement, on January 26, 2022, Millennial Lithium and 1335615 B.C. Ltd., a wholly-owned subsidiary of the Company, amalgamated under the name "Millennial Lithium Corp." As of close of market on January 26, 2022, all issued and outstanding Millennial Shares and the warrants of Millennial Lithium were delisted from trading on the TSX Venture Exchange.
2
On December 20, 2022, the Company announced that it entered into a definitive arrangement agreement pursuant to which the Company agreed to acquire all of the Arena Shares not already owned by the Company by way of a plan of arrangement under the laws of Ontario (the "Arena Transaction"). Pursuant to the arrangement agreement, Arena Minerals' shareholders were entitled to receive 0.0226 of a share of the Company and $0.0001 in cash for each Arena Share held. The Arena Transaction closed on April 20, 2023, and the Company issued approximately 8.4 million Shares to former Arena Minerals shareholders as consideration for their respective Arena Shares and convertible securities. Following the Arena Transaction, the Arena Shares were delisted from the TSX Venture Exchange.
Available Information
The SEC maintains an internet site (http://www.sec.gov) that contains reports, proxy and information statements and other information regarding issuers that file electronically with the SEC. Such information can also be found on the Company's website (https://www.lithium-argentina.com/).
B. Business Overview
Overview
The Company is a Swiss-domiciled resource company focused on advancing significant lithium projects. The Company holds a 44.8% interest in Cauchari-Olaroz in Jujuy, Argentina; an 85.1% interest in the Pastos Grandes Project in Salta, Argentina (subject to the Pastos Grandes Transaction); and a 65% interest in the Sal de la Puna project in Salta, Argentina. Additionally, the Company owns the Salar de Antofalla ("Antofalla Project") in the Province of Catamarca, Argentina.
The Company is focused on the operations at Cauchari-Olaroz and advancing the development of additional lithium resources in the region.
For a more detailed discussion of the Company's business structure and Cauchari-Olaroz, see Note 7 of the Company's audited consolidated financial statements for the years ended December 31, 2024, 2023 and 2022 included in "Item 18 - Financial Statements" of this annual report.
Specialized Skills
All aspects of the Company's business require specialized skills and knowledge, including geology, drilling, mining, processing, logistical planning, the implementation of exploration programs, and expertise in regulatory, finance and accounting matters. The Company relies on its management, employees and various consultants for this expertise.
Mineral Price and Economic Cycles
The principal end-use product for the Company's business is lithium-based chemicals, particularly battery-grade lithium carbonate. The markets for lithium-based products are affected by worldwide economic cycles and the volatility in supply and pricing that is commonly associated with commodity-based products. In the case of lithium-based products, demand is driven largely by the rate of adoption of lithium batteries, particularly those used in electric vehicles. Meanwhile, supply is driven by the production capacity of lithium producers and the ability of those operations to produce battery grade products, which are refined to a higher concentration of lithium with fewer impurities than non-battery grade lithium products.
Lithium prices have been volatile over the last several years. In 2022, lithium prices reached an all-time high due to, among other factors, supply constraints resulting from the increase in the adoption of electric vehicles and the corresponding demand for electric vehicle batteries and a disproportionate increase in supply as the timeline for new production to become available is, in most cases, measured over several years and is not responsive to short-term demand increases. The increase in demand, as well as efforts by governments to promote domestic industry through industrial policy and related efforts, has led to a significant increase in exploration and development stage lithium companies and projects being advanced throughout the world. More recently, however, lithium prices have decreased significantly due to, among other factors, rising supply, subdued demand and a lackluster electric vehicle market outside of China.
3
Intangibles
The Company does not hold any patents.
Sources and Availability of Raw Materials
All of the raw materials required for the Company's operations are available through standard supply and business contracting channels.
Government Regulations
The Company's exploration and future development activities are subject to various national, state, provincial and local laws and regulations in Argentina, the U.S., Switzerland, and Canada, which govern prospecting, development, mining, production, exports, taxes, labor standards, occupational health, waste disposal, protection of the environment, mine safety, hazardous substances and other matters.
Except as described in this annual report, the Company believes that it is in compliance, in all material respects, with applicable mining, health, safety and environmental statutes and regulations.
Competitive Conditions
Lithium currently has many end uses, including ceramics and glass, batteries, greases, air treatment and pharmaceuticals. However, it is the battery industry that is expected to predominantly drive future demand growth for lithium. This is expected to come from several areas: (i) the continued growth of small format batteries for cell phones, laptops, digital cameras and hand-held power tools, (ii) the transportation industry's electrification of automobiles, buses, delivery vehicles, motorcycles, bicycles and boats using lithium-ion battery technology, and (iii) large format batteries for utility grid-scale storage.
A small number of companies dominate the production of end-use lithium products such as lithium carbonate and lithium hydroxide. The bulk of production occurs in brine deposits in South America and spodumene hard-rock deposits in Australia as well as lepidolite production in China. There are a small number of additional companies who have initiated lithium-based production in recent years, as well as numerous additional companies pursuing the development of lithium mineral deposits throughout several jurisdictions.
Foreign Operations
Lithium operations and projects
Cauchari-Olaroz, the Pastos Grandes Project and the Sal de la Puna project are all located in Argentina. Cauchari-Olaroz is in operation while the projects under the Pastos Grandes basin segment are in the exploration and evaluation stage.
Offtake Agreement with Ganfeng and Bangchak
The Company and Ganfeng are entitled to a share of offtake from production at Cauchari-Olaroz. The Company is entitled to 49% of the offtake, which would amount to approximately 19,600 tonnes per annum ("tpa") of lithium carbonate assuming full capacity is achieved. The Company entered into an offtake agreement with each of Ganfeng and Bangchak on August 27, 2020 to sell a fixed amount of offtake production at market-based prices, with Ganfeng entitled to 80% of the first 12,250 tpa of lithium carbonate (9,800 tpa assuming full production capacity) and Bangchak entitled to up to 6,000 tpa of lithium carbonate (assuming full production capacity).
4
The balance of the Company's offtake entitlement, amounting to up to approximately 3,800 tpa of lithium carbonate is uncommitted, but for limited residual rights available to Bangchak to the extent production does not meet full capacity.
Purchases and sales of lithium carbonate
During the year ended December 31, 2024, the Company purchased its share of Exar's lithium carbonate shipped during the period with Ganfeng purchasing the remaining product shipped. The Company sold the purchased lithium carbonate to Ganfeng and Bangchak and acted in the capacity of agent in such sales transactions, as the Company's acquisition of title to lithium carbonate was simultaneous with the sale of lithium carbonate to Ganfeng and Bangchak and the Company was not directly exposed to inventory or price risk related to lithium carbonate.
Since there was no net amount of commission to the Company, there was no net impact on the Company's statement of comprehensive loss for the year ended December 31, 2024.
Exar and Exar Capital Agency Arrangement
In addition to project loans provided by Exar Capital, Exar Capital also provides support to Exar by purchasing, as agent, reagents and other materials on behalf of Exar from international suppliers. Argentina does not allow access to the foreign exchange markets to permit prepayments by Argentine companies to international vendors, payments are only allowed after supplies arrive in Argentina. Accordingly, Exar Capital provides prepayments to suppliers and is then reimbursed by Exar once the supplies arrive in Argentina and Exar is able to make such payments in accordance with Argentinian foreign exchange regulations.
Amended Shareholders Agreement
On October 25, 2018, the Company, 2265866 Ontario Inc. (now 2265866 Ontario Holdings B.V.), Ganfeng, Exar and Exar Capital entered into a shareholders' agreement to govern the Company's and Ganfeng's interests in Exar and Exar Capital and the funding and development of the Cauchari-Olaroz Operation. The shareholders' agreement was amended in 2019, and amended and restated in August 2020 for the closing of a transaction by which Ganfeng holds 51% and the Company 49% interest, respectively in Cauchari-Olaroz (the "Amended Shareholders Agreement").
The Amended Shareholders Agreement entered into on August 27, 2020 by the Company, 2265866 Ontario Inc. and Ganfeng generally provides for the following:
- the parties' respective rights regarding ownership interests in Exar and Exar Capital;
- requirements for funding and development of the Cauchari-Olaroz Operation, and rights and obligations of parties upon a failure to fund, including dilution of interest under certain circumstances;
- the formation of the Exar shareholder committee to direct the business and affairs of Exar, comprised of three representatives of Ganfeng and two representatives from the Company;
- the composition of the board of directors of Exar, being two representatives of Ganfeng and one representative of the Company;
- the composition of the board of directors of Exar Capital, being two representatives of Ganfeng and one representative of the Company;
- an 80% approval threshold for the Exar shareholder committee to approve a number of material corporate actions, thereby providing protection to the Company as a minority shareholder in Exar, such approvals of material corporate actions including but not limited to the following: (i) programs and budgets, and changes thereto or to contributions required to be made by the parties; (ii) issuances of securities or restructuring transactions involving Exar and Exar Capital; (iii) any sale, transfer or other disposition of an ownership interest in Exar or Exar Capital; (iv) changes to the composition of the Exar shareholder committee or the board of directors of Exar or Exar Capital; (v) material changes to terms contemplated by the agreement with JEMSE; (vi) any change to development activities that would materially delay the expected timeline for the Cauchari-Olaroz Operation to reach commercial production; and (vii) debt or guarantees above certain thresholds; and
5
- the obligation of each party to purchase its pro rata share of production from the Cauchari-Olaroz Operation.
C. Organizational Structure
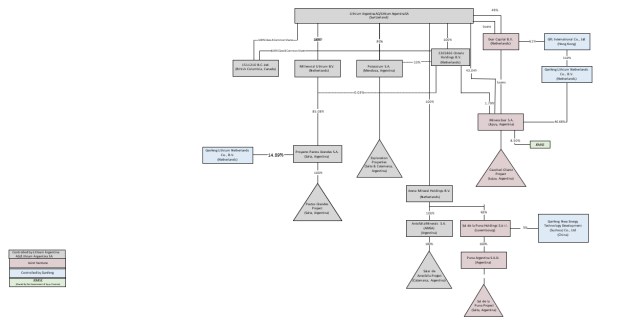
The following diagram sets out the organizational structure of the Company:
D. Property, Plants and Equipment
Summary Overview of Mining
As used in this annual report, the terms "mineral resource," "measured mineral resource," "indicated mineral resource," "inferred mineral resource," "mineral reserve," "proven mineral reserve" and "probable mineral reserve" are defined and used in accordance with S-K 1300. All determinates of mineral resources and mineral reserves have been prepared by qualified persons. Under S-K 1300, mineral resources may not be classified as "mineral reserves" unless the determination has been made by a qualified person that the mineral resources can be the basis of an economically viable project. Mineral resources are not mineral reserves and do not meet the threshold for mineral reserve modifying factors, such as estimated economic viability, that would allow for conversion to mineral reserves. There is no certainty that any part of the mineral resources estimated will be converted into mineral reserves.
Except for that portion of mineral resources classified as mineral reserves, mineral resources have not demonstrated economic value. Inferred mineral resources are estimates based on limited geological evidence and sampling and have too high of a degree of uncertainty to apply relevant technical and economic factors likely to influence the prospects of economic extraction in a manner useful for evaluation of economic viability. Estimates of inferred mineral resources may not be converted to a mineral reserve. It cannot be assumed that all or any part of an inferred mineral resource will be upgraded to a higher category. A significant amount of exploration must be completed to determine whether an inferred mineral resource may be upgraded to a higher category. Therefore, you are cautioned not to assume that all or any part of an inferred mineral resource can be the basis of an economically viable project, or that it will be upgraded to a higher category.
6
Properties
The Company is helping to advance two significant lithium projects, the Cauchari-Olaroz Operation, located in the Province of Jujuy in Argentina, and the Pastos Grandes Project, located in the Province of Salta in Argentina. The Pastos Grandes Project includes the PGCo (Lithium Argentina owns approximately 85% interest). Cauchari-Olaroz is a production stage project. Pastos Grandes is an exploration stage project because the Company has not yet determined that Pastos Grandes has mineral reserves under S-K 1300.
The Cauchari-Olaroz Operation and the Pastos Grandes Project are the Company's two material projects. The Company also holds a 65% interest in the Sal de la Puna project and 100% in the Antofalla Project, each of which are exploration stage projects.
Except as otherwise stated, the scientific and technical information relating to Cauchari-Olaroz Salars contained in this annual report is derived from the Cauchari TRS prepared by Andeburg Consulting Services Inc. ("ACSI"), LRE Water, EnviroProTech-t and CSU Projects, none of which are affiliated with the Company. The Cauchari TRS was also prepared by Ernest Burga, P.Eng., David Burga, P.Geo., Daniel Weber, P.G., RM-SME, Anthony Sanford, Pr.Sci.Nat., and Marek Dworzanowski, C.Eng., Pr.Eng., each of whom is a "qualified person" under S-K 1300 for the sections of the Cauchari TRS that they are responsible for preparing and none of whom are affiliated with the Company.
Except as otherwise stated, the scientific and technical information relating to Pastos Grandes Salar contained in this annual report is derived from the Technical Report titled "SEC Technical Report Summary, Pastos Grandes Project Lithium Resource Estimate, Salta Province, Argentina" with an effective date of December 31, 2024 prepared for the Company by Frederik Reidel, CPG and Atacama Water SpA (the "Pastos Grandes TRS"), none of which are affiliated with the Company, and each of whom is a ""qualified person" under S-K 1300 for the sections of the Pastos Grandes TRS that they are responsible for preparing and none of whom are affiliated with the Company.
Except as otherwise stated, all technical and scientific information contained in this annual report has been reviewed and approved by David Burga, P.Geo, a qualified person for the purposes of NI 43-101 and S-K 1300 by virtue of his experience, education, and professional association and who is independent of the Company.
Detailed scientific and technical information on the Cauchari-Olaroz Operation prepared in accordance with NI 43-101 (including mineral resources and reserves estimates prepared in accordance with CIM Definition Standards adopted by the Canadian Institute of Mining, Metallurgy and Petroleum on May 10, 2014) can be found in the NI 43-101 technical report entitled "NI 43-101 Technical Report - Operational Technical Report at the Cauchari-Olaroz Salars, Jujuy Province, Argentina". The technical report has an effective date of December 31, 2025, and was prepared by "Qualified Persons" for the purposes of NI 43-101, independent of the Company.
Detailed scientific and technical information on the Pastos Grandes Project prepared in accordance with NI 43-101 can also be found in the NI 43-101 technical report entitled "Lithium Resources Update, Pastos Grandes Project, Salta Province, Argentina". The technical report has an effective date of April 30, 2023, and was prepared by a "Qualified Person" for the purposes of NI 43-101, independent of the Company. Copies of the technical reports prepared in accordance with NI 43-101 are available on the Company's website at www.lithium-argentina.com and on the Company's SEDAR+ profile at www.sedarplus.ca.
7
The map below shows the locations of our principal mining operations in Argentina and the exploitation and exploration mining concessions that have been granted to us:
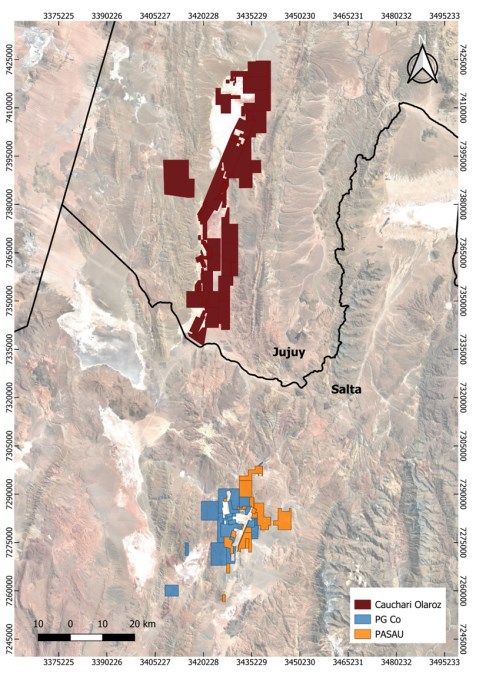
Figure 1. Location of Lithium Argentina mining operations in Argentina and the exploitation and exploration mining concessions. Location coordinates longitude and latitude, respectively: of (i) Cauchari-Olaroz, (the salars extend in a north-south direction from S 23° 18' to S 24° 05', and in an east-west direction from W 66° 34' to W 66° 51'), (ii) Pastos Grandes (including PGCo and PASAU): (24°34'44" south latitude and 66°42'26").
8
|
Summary of aggregate annual production (lithium carbonate) - Current as of December 31, 2024 |
|||
|
Salar |
2023 |
2024 |
TOTAL |
|
Cauchari-Olaroz |
6,000 |
25,400 |
31,400 |
|
Pastos Grandes |
0 |
0 |
0 |
|
Total annual production |
6,000 |
25,400 |
31,400 |
Mineral Resources
| Summary of Mineral Resource Estimate For Lithium and Potassium Exclusive Of Mineral Reserves - Current as of December 31, 2024 | ||||||||
| Category | Aquifer Volume (m3) |
Drainable Brine Volume (m3) |
Avg Li Conc. (mg/L) |
Avg K Conc. (mg/L) |
Lithium Metal (tonnes) |
K (tonnes) |
Lithium - Attributed Interest Portion (tonnes) (10) |
|
| Measured | ||||||||
| Cauchari-Olaroz | 1.07E+10 | 9.73E+08 | 587 | 571,150 | 255,875 | |||
| Pastos Grandes | 1.345E+10 | 1.5E+9 | 438 | 4,419 | 662,000 | 6,660,000 |
563,000 |
|
| Total Measured |
818,875 |
|||||||
| Indicated | ||||||||
| Cauchari-Olaroz | 4.66E+10 | 4.20E+09 | 589 | 2,475,630 | 1,109,082 | |||
| Pastos Grandes | 2.15E+9 | 1E+8 | 457 | 4,655 | 57,000 | 57,000 |
49,000 |
|
| Total Indicated |
1,158,082 |
|||||||
| Measured & Indicated | ||||||||
| Cauchari-Olaroz | 5.73E+10 | 5.18E+09 | 589 | 3,046,780 | 1,364,957 | |||
| Pastos Grandes | 1.56E+10 | 1.6E+9 | 441 | 4,452 | 719,000 | 7,230,000 |
1,976,957 |
|
| Total M&I | ||||||||
| Inferred | ||||||||
| Cauchari-Olaroz | 1.33E+10 | 1.50E+09 | 592 | 887,300 | 397,510 | |||
| Pastos Grandes | 5.22E+9 | 4E+8 | 460 | 4,794 | 205,000 | 2,100,000 |
174,000 |
|
| Total Inferred |
571,510 |
|||||||
Notes:
(1) See the footnotes to the resource tables in the property sections for Cauchari-Olaroz and Pastos Grandes for more information.
(2) The Mineral Resource estimate is reported in-situ.
(3) For Cauchari-Olaroz, calculated brine volumes only include Measured, Indicated, and Inferred Mineral Resource volumes above cut-off grade of 300 mg/L. For Pastos Grandes, calculated brine volumes only include Measured, Indicated, and Inferred Mineral Resource volumes above cut-off grade of 200 mg/L.
9
(4) Comparisons of values may not add due to rounding of numbers and the differences caused by use of averaging methods.
(5) Lithium processing recovery efficiency is assumed to be 53.7% for Cauchari-Olaroz and 65% for Pastos Grandes.
(6) For Cauchari-Olaroz, the commodity price of $20,000/tn for lithium carbonate (2025) for the life of the project was used to assess the economic viability for the mineral estimates. For Pastos Grandes, a cut-off grade of 200 mg/l has been applied to the M+I+I resource estimates, assuming an annual lithium carbonate equivalent (“LCE”) production of 24,000 tn over 40 years with an average LCE price of USD$20,000; a long-term OPEX of USD 6,183/tn LCE.
(7) The Company's attributed interest in Cauchari-Olaroz is 44.8% and its attributed interest in Pastos Grandes is 85.1%.
(8) The attributed portion of the potassium (K) is: measured 818,875 tonnes; indicated 1,158,082 tonnes; M&I 1,976,957 tonnes and inferred 571,510 tonnes.
| Summary of 2019 Mineral Resource Estimate for Lithium Represented as LCE, Exclusive of Mineral Reserves - Current as of December 31, 2024 | ||||
| Classification | LCE (tonnes) | LCE - Lithium Argentina's 44.8% Portion (tonnes) |
LCE |
LCE - Lithium |
| Measured Mineral Resources | 3,040,109 | 1,361,969 |
3,522,109 |
2,997,000 |
| Indicated Mineral Resources | 13,177,246 | 5,903,406 |
303,000 |
258,000 |
| Measured & Indicated Mineral Resources | 16,217,355 | 7,265,375 |
3,825,000 |
3,255,000 |
| Inferred Mineral Resources | 4,722,700 | 2,115,769 | ||
Notes:
(1) S-K §229.1300 definitions were followed for Mineral Resources and Mineral Reserves.
(2) The Qualified Person for the Mineral Resources and Mineral Reserves estimates for Cauchari-Olaroz, Mr. Daniel S. Weber, P.G., RM-SME, reviewed and confirmed that there have been changes to prices and data since the effective date of the estimates, however such change are not material and the Mineral Resources and Mineral Reserves and the underlying material assumptions remain current as of December 31, 2024.
(3) The Mineral Resource estimates is reported in-situ and exclusive of Mineral Reserves, where the lithium mass is representative of what remains in the reservoir after the LOM. To calculate Mineral Resources exclusive of Mineral Reserves, a direct correlation was assumed between Proven Reserves and Measured Resources, and similarly, between Probable Reserves and Indicated Resources. Proven Mineral Reserves (from the point of reference of brine pumped from the wellfield to the evaporation ponds) were subtracted. The average grade for Measured and Indicated Resources exclusive of Mineral Reserves was back-calculated based on the remaining brine volume and lithium mass.
(4) The Qualified Person for the Pastos Grandes Mineral Resource estimate is Frederik Reidel, CPG.
(5) LCE for the Cauchari-Olaroz project is calculated using mass of LCE = 5.322785 multiplied by the mass of Lithium reported in Table 11.5 of the Cauchari TRS, and LCE for the Pastos Grandes Project was converted using a conversion factor of 5.32.
(6) The Mineral Resource Estimate is not a Mineral Reserve Estimate and does not have demonstrated economic viability. There is no certainty that all or any part of the Mineral Resources will be converted to Mineral Reserves. Inferred Resources have great uncertainty as to their existence and whether they can be mined legally or economically.
(7) For Cauchari-Olaroz, calculated brine volumes only include Measured, Indicated, and Inferred Mineral Resource volumes above cut-off grade of 300 mg/L. For Pastos Grandes, calculated brine volumes only include Measured and Indicated Mineral Resource volumes above cut-off grade of 200 mg/L.
10
(8) Comparisons of values may not add due to rounding of numbers and the differences caused by use of averaging methods.
(9) Processing efficiency is assumed to be 53.7% for Cauchari-Olaroz and 65% for Pastos Grandes.
(10) For Cauchari-Olaroz, the commodity price of $20,000/tn for lithium carbonate (2025) for the life of the project was used to assess the economic viability for the mineral estimates. For Pastos Grandes, a cut-off grade of 200 mg/l has been applied to the M+I+I resource estimates, assuming an annual LCE production of 24,000 tn over 40 years with an average LCE price of USD$20,000; a long-term OPEX of USD 6,183/tn LCE.
Summary of Mineral Reserves
The Company's only project with mineral reserves is Cauchari-Olaroz.
| Summary of Estimated Proven and Probable Mineral Reserves (Without Processing Efficiency) | ||||||
| Reserve Classification |
Production Period (Years) |
Brine Pumped (m3) |
Average Lithium Concentration (mg/L) |
Lithium Metal (tonnes) |
LCE (tonnes) |
LCE - Lithium Argentina's 44.8% Portion (tonnes) |
| Proven | 0 through 5 | 156,875,201 | 616 | 96,650 | 514,450 | 230,474 |
| Probable | 6 to 40 | 967,767,934 | 606 | 586,270 | 3,120,590 | 1,398,024 |
| Total | 40 | 1,124,643,135 | 607 | 682,920 | 3,635,040 | 1,628,498 |
Notes:
(1) The Mineral Reserve Estimate has an effective date of May 7, 2019. The Qualified Person for these Mineral Resources and Mineral Reserves estimates for Cauchari-Olaroz, Mr. Daniel S. Weber, P.G., RM-SME, reviewed and confirmed that the Mineral Reserves estimates, along with the material assumptions related to them, as presented in the Cauchari TRS, remained accurate as of the effective report date of December 31, 2024.
(2) LCE is calculated using mass of LCE = 5.322785 multiplied by the mass of Lithium Metal.
(3) The conversion to LCE is direct and does not account for estimated processing efficiency.
(4) The values in the columns for "Lithium Metal" and "LCE" above are expressed as total contained metals.
(5) The production period is inclusive of the start of the model simulation (Year 0).
(6) The average lithium concentration is weighted by per well simulated extraction rates.
(7) Tonnage is rounded to the nearest 10.
(8) Comparisons of values may not be equivalent due to rounding of numbers and the differences caused by use of averaging methods.
(9) Processing efficiency is assumed to be 53.7%.
(10) The point of reference is brine pumped from the wellfield to the evaporation ponds.
(11) The commodity price of $20,000/tn for lithium carbonate (2025) for the life of the project was used to assess the economic viability for the mineral estimates.
For information regarding our material projects, please see the information below under the headings "Cauchari-Olaroz Operation" and "Pastos Grandes Project."
11
| Sal de la Puna Project | ||
| Location | Salta Province, Argentina | |
| Type and amount of ownership interests | 65% of the project owned by Arena Mineral Holdings B.V, a wholly-owned indirect subsidiary of the Company. The Sal de la Puna Project is held through a joint venture interest in Sal de la Puna Holdings S. à.r.l., the 100% owner of the Argentine subsidiary, Puna Argentina S.A.U., the owner of the claims forming part of the Sal del la Puna Project. The remaining 35% of Sal de la Puna Holdings S.à.r.l. is owned by joint venture partner Ganfeng New Energy Technology Development (Suzhou) Co., Ltd | |
| Titles, mineral rights, leases or options and acreage | The project covers 13,200 hectares southern and eastern parts of the Pastos Grandes hydrological basin | |
| Key permit conditions | Working in progress to change the environmental impact permit from production to exploration | |
| Mine types and mineralization styles | Lithium brine | |
| Processing plants and other facilities | None, Exploration Phase | |
| Antofalla Project | ||
| Location | Catamarca Province, Argentina | |
| Type and amount of ownership interests | 100% interest in the project | |
| Titles, mineral rights, leases or options and acreage | The project covers covering approximately 5,800 hectares of the Antofalla salar and basin in the Province of Catamarca, Argentina | |
| Key permit conditions | Valid permit for surface water extraction. The Exploration DIA has been submitted to proceed with drilling, and it is under evaluation by the authorities | |
| Mine types and mineralization styles | Lithium brine | |
| Processing plants and other facilities | None, Exploration Phase | |
12
Cauchari-Olaroz Operation
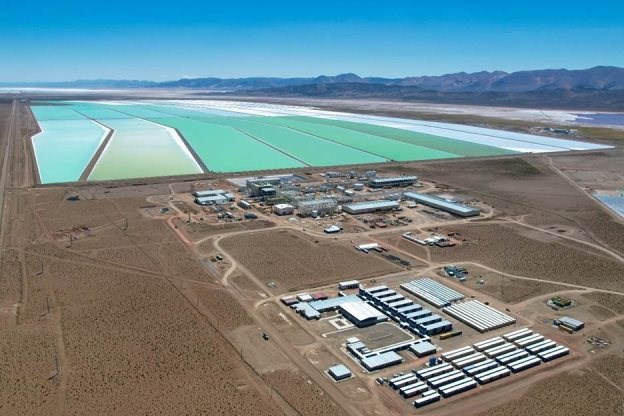
Project Overview
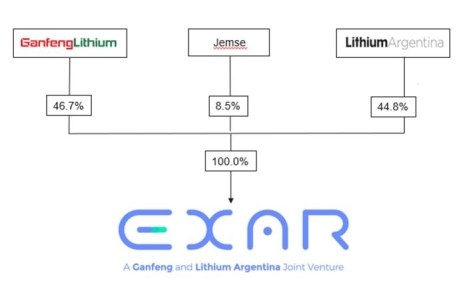
Cauchari-Olarozis owned by Exar, a company incorporated under the laws of Argentina. Exar, in turn, is 44.8% owned by the Company, 46.7% by Ganfeng and 8.5% by JEMSE, a mining investment company owned by the government of Jujuy Province in Argentina.
The book value for our investment in the Cauchari-Olaroz Operation is $Nil as of December 31, 2024. As of December 31, 2024, the total outstanding loans advanced by the Company to Cauchari-Olaroz, including accrued interest, was $448 million (including $380.5 million provided to Exar through Exar Capital and $67.5 million provided directly to Exar).
Detailed Property Description
Technical Information
All capitalized terms used in the disclosure below that are not otherwise defined shall have the meanings ascribed thereto in the Cauchari TRS.
Information contained in the Cauchari TRS, including (but not limited to) mineral extraction, processing and recovery operations, projected costs, and project economics for the Cauchari-Olaroz Operation (including, for greater certainty, revenue, net present value, cash flow and earnings) are presented as of the date of the Cauchari TRS based on criteria, assumptions, estimates and other information available at the time and therefore may not reflect actual results and outcomes, updated project economics, capital costs and/or operating costs for the project. As a result, actual results may differ from those presented. See " Item 3.D - Risk Factors".
13
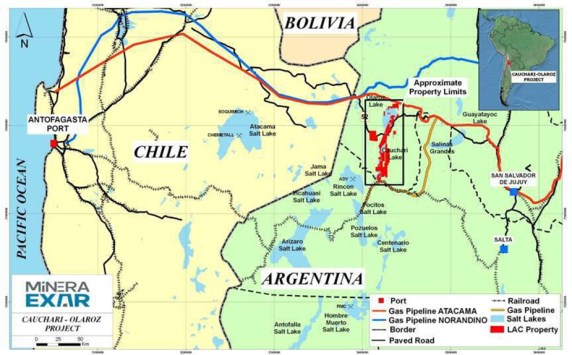
Property Description and Location
The Cauchari and Olaroz Salars are located in the Department of Susques in the Province of Jujuy in northwestern Argentina, approximately 250 km northwest of San Salvador de Jujuy, the provincial capital. The salars extend in a north-south direction from S23°18' to S24°05' and in an east-west direction from W66°34' to W66°51'. The average elevation of the salars is 3,940 metres. The midpoint between the Olaroz and Cauchari Salars is located along National Highway 52, 55 km west of the Town of Susques. The nearest port is Antofagasta (Chile), located 530 km west of the Project by road.
Ownership
The Company holds its interest in the Cauchari-Olaroz Operation through a 44.8% interest in Exar, with Ganfeng holding a 46.7% interest. Exar acquired mining and exploration permits applications through acquisition of such permits applications, direct request of permits from the applicable provincial mining authority and/ or through brines usufruct agreements in the Province of Jujuy, Argentina, covering a total of 60,712 ha in the Department of Susques, of which 28,717 ha can support the entire project. The claims are contiguous and cover most of the Cauchari Salar and the eastern portion of the Olaroz Salar. The annual aggregate payment (canon rent) required by Exar to maintain the claims is US$268,346. Under Exar's usufruct agreement with Borax Argentina S.A., Exar acquired Borax Argentina S.A.'s usufruct rights on properties in the area in exchange for an annual royalty of US$200,000 plus annual canon rent property payments to Jujuy Province. The area that contains the Mineral Resource and Mineral Reserve estimate is covered by mining concessions which grant the holder a perpetual mining right, subject to the payment of a fee and an agreed upon investment in accordance with the principal legislation that regulates the mining industry in Argentina, the Código de Minería.
On March 28, 2016, Exar entered into a purchase option agreement ("Option Agreement") with Grupo Minero Los Boros ("Los Boros") for the transfer of title to Exar for certain mining properties that comprised a portion of the Cauchari-Olaroz Operation. Under the terms of the Option Agreement, Exar paid US$100,000 upon signing, and obtained a right to exercise the purchase option at any time within 30 months for the total consideration of US$12M payable in sixty quarterly installments of US$200,000.
14
On November 12, 2018, Exar exercised the purchase option, acquired the properties by taking on the obligation to pay US$12,000,000 in 60 quarterly payments of US$200,000 and;, as a result, the following royaltyies became payable to Los Boros:
• US$300,000 was paid on November 27, 2018 because the commercial plant construction started (purchase option established payment within 10 days of the commercial plant construction start date);
• Quarterly installments of US$200,000; and
• 3% net profit interest for 40 years, to be paid annually in Argentine pesos, within 10 business days after calendar year end.
Exar can cancel the first 20 years of net profit interest in exchange for a one-time payment of US$7M and the second 20-year period for an additional US$7M.
On March 28, 2016, Sociedad Química y Minera de Chile S.A. ("SQM") and Exar executed a shareholders agreement that established the terms by which the parties planned to develop the Cauchari-Olaroz Operation.
On October 31, 2018, the Company closed a transaction with Ganfeng and SQM. Ganfeng agreed to purchase SQM's interest in the Cauchari-Olaroz Operation. The Company increased its interest in the Cauchari-Olaroz Operation from 50% to 62.5% with Ganfeng holding the remaining 37.5% interest and the parties entered into a shareholder agreement to govern their ownership and business operations of Exar. Ganfeng also provided the Company with a US$100 million unsecured, limited recourse subordinated loan facility as part of funding its 62.5% share of the project expenditures.
On August 19, 2019, the Company and Ganfeng completed a transaction whereby Ganfeng contributed US$160 million in Exar and increased its participating interest in Exar to 50%. At such transaction closing, the Company and GFL International Co., Limited ("GFL") each owned a 50% equity interest in Exar. The parties made certain consequential amendments to the shareholders' agreement governing their relationship to refer to the new equity ownership structure in Exar. The Company and GFL authorized Exar to undertake a feasibility study on a development plan to increase the initial production capacity from 25,000 tpa to 40,000 tpa of lithium carbonate, as well as certain permitting and development work in advance of a decision to increase the project production rate.
On August 27, 2020, the Company and Ganfeng closed a transaction whereby Ganfeng increased its participating interest in Exar to 51% by completion of a US$16 million capital contribution to Exar.As part of this transaction, Ganfeng provided $40 million to Exar Capital in non-interest-bearing loans, repayable in 2029 (with a right for an additional one-year extension) and contributed $600,000 to Exar Capital's equity to increase its interest from 37.5% to 51%. Proceeds of the loans from Ganfeng were used by Exar Capital to repay $40 million of loans owed to Lithium Argentina. At such transaction closing, GFL owned a 51% equity interest in Exar and Lithium Argentina a 49%. The parties made certain consequential amendments to the shareholders' agreement governing their relationship to refer to the new equity ownership structure in Exar.
On August 26, 2020, GFL, the Company and Exar entered into a Share Acquisition Option Execution Agreement with JEMSE, a Province of Jujuy state company, setting the guidelines of JEMSE acquisition of an 8.5% participating interest in Exar, proportionally diluting GFL and the Company participating interest accordingly. JEMSE acquired the Exar shares for a consideration of US$1 plus an amount equal to 8.5% of the capital contributions in Exar. JEMSE will pay for the amount owed to the shareholders through the assignment of one-third of the dividends to be received by JEMSE from Exar after taxes. In accordance with the agreement, for future equity contributions GFL and the Company are obliged to loan to JEMSE 8.5% of the contributions necessary for JEMSE to avoid dilution, which loans also would be repayable from the same one-third dividends assignment, after taxes.
15
On October 3, 2023, the Company separated into two independent public companies, Lithium Americas (Argentina) Corp. and a new Lithium Americas Corp. The Company retained the Cauchari-Olaroz Operation as well as the Pastos Grandes Project and Sal de la Puna project in Argentina.
Current ownership of the Project is summarized in the following figure:
Ownership Structure
The surface rights of the area subject to exploitation are local aboriginal communities' land. Exar signed contracts with each aboriginal community to have the right to explore the property and for surface use, water use, transit, and building ponds and facilities. Most of these contracts also cover development and mining operations by Exar. For those contracts in which development and mining are not specifically addressed, Exar is working with the relevant community to extend the coverage of the contract to those areas. Exar has also agreed to support local communities through a number of infrastructure and education programs.
History
Mining activities on the western side of the Cauchari Salar by Rio Tinto and on the eastern side of the Olaroz Salar by Los Boros date back to the 1990s.
| 2009 to 2010 |
|
| 2012 |
|
16
| 2016 |
|
| 2017 |
|
| 2018 |
|
| 2019 |
|
| 2020 |
|
| 2021 |
|
| 2022 |
|
| 2023 |
|
| 2024 |
|
Geological Setting, Mineralization and Deposit Types
There are two dominant structural features in the region of the Cauchari and Olaroz Salars: north-south trending high-angle normal faults and northwest-southeast trending lineaments. The high-angle north-south trending faults form narrow and deep horst-and-graben basins which are accumulation sites for numerous salars, including Olaroz and Cauchari. Basement rock in this area is composed of Early Ordovician turbidites (shale and sandstone) intruded by Late Ordovician granitoids. It is exposed to the east, west and south of the two salars, and generally along the eastern boundary of the Puna Region.
The salars are in-filled with laminar deposits, dominated by the following five primary informal lithological units that have been identified in drill cores: (i) red silts with minor clay and sand; (ii) banded halite beds with clay, silt and minor sand; (iii) fine sands with minor silt and salt beds; (iv) massive halite and banded halite beds with minor sand; and (v) medium and fine sands.
17
Alluvial deposits intrude into these salar deposits to varying degrees, depending on location. The alluvium surfaces slope into the salar from outside the basin perimeter. Raised bedrock exposures occur outside the salar basin. The most extensive intrusion of alluvium into the basin is the Archibarca Fan, which partially separates the Olaroz and Cauchari Salars. Route 52 is constructed across this alluvial fan. In addition to this major fan, much of the perimeter zone of both salars exhibits encroachments of alluvial material associated with fans of varying sizes.
The brines from Cauchari are saturated in sodium chloride with total dissolved solids ("TDS") on the order of 27% (324 to 335 grams per litre) and an average density of about 1.215 grams per cubic centimetre. The other primary components of these brines include potassium, lithium, magnesium, calcium, sulphate, bicarbonate, and boron as borates and free boric acid. Since the brine is saturated in sodium chloride, halite is expected to precipitate during evaporation. In addition, the Cauchari brine is predicted to initially precipitate halite and ternadite as well as a wide range of secondary salts that could include: astrakanite, schoenite, leonite, kainite, carnalite, epsomite and bischofite.
The Cauchari and Olaroz Salars are classified as "Silver Peak, Nevada" type terrigenous salars. Silver Peak, Nevada in the United States was the first lithium-bearing brine deposit in the world to be exploited. These deposits are characterized by restricted basins within deep structural depressions in-filled with sediments differentiated as inter-bedded units of clays, salt (halite), sands and gravels. In the Cauchari and Olaroz Salars, a lithium-bearing aquifer has developed during arid climatic periods. On the surface, the salars are presently covered by carbonate, borax, sulphate, clay and sodium chloride facies. Cauchari and Olaroz have relatively high sulphate contents and therefore both salars can be further classified as "sulphate type brine deposits".
Exploration
The following exploration programs were conducted between 2009 and 2024 to evaluate the lithium development potential of the Cauchari-Olaroz Operation area:
- Surface Brine Program - 55 brine samples were collected from shallow pits throughout the salars to obtain a preliminary indication of lithium occurrence and distribution.
- Seismic Geophysical Program - Seismic surveying was conducted to support delineation of basin geometry, mapping of basin-fill sequences, and siting borehole locations.
- Gravity Survey - A limited gravity test survey was completed to evaluate the utility of this method for determining depths to basement rock.
- Time Domain Electromagnetic ("TEM") Survey - TEM surveying was conducted to attempt to define fresh water and brine interfaces within the salar.
- Air Lift Testing Program - Testing was conducted within individual boreholes as a preliminary step in estimating aquifer properties related to brine recovery.
- Vertical Electrical Sounding ("VES") Survey - A VES survey was conducted to attempt to identify fresh water and brine interfaces, and surrounding freshwater occurrences.
- Surface Water Sampling Program - A program was conducted to monitor the flow and chemistry of surface water entering the salars.
- Pumping Test Program 2011-2019 - Pumping wells were installed at eleven locations, to estimate aquifer parameters related to brine recovery. One of the locations was used to estimate the capacity of fresh water supply. Some tests were carried out using multiple wells on the same platform in order to estimate three-dimensional aquifer parameters.
- Boundary Investigation - A test pitting and borehole program was conducted to assess the configuration of the fresh water/brine interface at the salar surface and at depth, at selected locations on the salar perimeter.
18
Drilling
From September 2009 to August 2010, a total of 4,176 m of Reverse Circulation ("RC") Borehole drilling was conducted to develop vertical profiles of brine chemistry at depth in the salars and to provide geological and hydrogeological data. The program included installation of 24 boreholes and collection of 1,487 field brine samples (and additional Quality Control samples). The sampled brines have a relatively low magnesium-to-lithium ratio (lower than most sampling intervals), indicating that the brines would be amenable to a conventional lithium recovery process.
Diamond drilling at the Cauchari-Olaroz Operation was conducted between October 2009 and August 2010. This program was conducted to collect continuous cores for geotechnical testing and geological characterization. The program included 29 boreholes and collection of 127 field brine samples (and additional quality control samples).
A drilling and sampling program was conducted from July 2017 to June 2019. The program included a total of 49 boreholes and 9,703 meters of cores recovered. In 2019, 58 additional samples were sent for testing (this program also included a total of 1,006 samples sent to the laboratory for brine characterization, including quality assurance and quality control ("QA/QC") samples).
Information from the exploration drilling and pump tests was used to select the locations of the production wells that will be used to pump lithium brine to the evaporation ponds. Since 2011 a total of 10 production wells have been drilled on the Property.
The production well field uses three wells drilled in 2011. These wells had a smaller diameter of 8 inches. The wells drilled in 2018 and 2019 were drilled deeper and used a larger diameter based on the expected flow. The production wells were drilled with conventional rotary rigs and a surface casing at the top of the wells to ensure the stability of the well head over time. The design of the deeper wells used larger diameter casing in the upper 200/250 m, continuing with smaller diameter casing below.
Mineral Resource and Reserve Estimates
The Company has not previously disclosed mineral reserve or resource estimates in accordance with S-K 1300. The following is a brief discussion of the material assumptions and criteria underlying the mineral resource and reserve estimates. Please see Section 11 and 12 of the Cauchari TRS for more detail.
A Mineral Resource and Mineral Reserve estimate for the Cauchari-Olaroz Operation is summarized in the tables below.
Mineral Resources
The prior Mineral Resource estimate from 2019 was not prepared in accordance with S-K 1300. The Company has previously filed the NI 43-101 technical reports on the Cauchari-Olaroz Operation providing prior Mineral Resource estimates for lithium and the previous resource estimate was prepared in accordance with CIM standards under NI 43-101. The Mineral Resource estimate included in the Cauchari TRS complies with S-K 1300 and has an effective date of May 7, 2019. Mr. Daniel S. Weber, P.G., RM-SME for Cauchari-Olaroz, and a qualified person under S-K 1300, reviewed and confirmed that the Mineral Resource and Mineral Reserve estimates, along with the material assumptions related to them, as presented in the Cauchari TRS, remained current as of the effective report date of December 31, 2024.
Since the 2019 mineral estimates, the results of deeper drilling and sampling have allowed for partial conversion of the Inferred Resource aquifer volume in the updated HSU model to Measured and Indicated Resource aquifer volume of the deeper HSUs. This conversion of aquifer volume to more confident Mineral Resource estimate categories provided support for simulated wells in the Mineral Reserve estimate numerical model to be completed in the deeper and more permeable lower sand and basal sand HSUs in the southeast part of the model domain. This resulted in the Mineral Resource estimate included in the Cauchari TRS with an effective date of May 7, 2019.
19
The Mineral Resource estimate below is based on the total amount of lithium in brine that is theoretically drainable from the bulk aquifer volume. The Mineral Resource estimate is computed as the overall product of the Mineral Resource evaluation area and aquifer thickness resulting in an aquifer volume, lithium concentration dissolved in the brine and specific yield of the Mineral Resource aquifer volume. This framework is based on an expanded and updated hydro stratigraphic model incorporating bulk aquifer volume lithologies and specific yield estimates for block modeling of the Mineral Resource estimate. Radial basis function was performed as the main lithium distribution methodology using variogram modeling techniques; the interpolation method was verified with ordinary kriging. The Mineral Resource block model was validated by means of visual inspection, checks of composite versus model statistics and swath plots. No areas of significant bias were noted. The S-K 1300 regulations were followed for the Mineral Resource Estimate.
| Summary of 2019 Mineral Resource Estimate For Lithium Exclusive Of Mineral Reserves - Current as of December 31, 2024 | |||||
| Category | Aquifer Volume (m3) |
Drainable Brine Volume (m3) |
Average Lithium Concentration (mg/L) |
Lithium Metal (tonnes) |
Lithium - Lithium Argentina's 44.8% Portion (tonnes) |
| Measured | 1.07E+10 | 9.73E+08 | 587 | 571,150 | 255,875 |
| Indicated | 4.66E+10 | 4.20E+09 | 589 | 2,475,630 | 1,109,082 |
| Measured & Indicated | 5.73E+10 | 5.18E+09 | 589 | 3,046,780 | 1,364,957 |
| Inferred | 1.33E+10 | 1.50E+09 | 592 | 887,300 | 397,510 |
Notes:
(1) S-K §229.1300 definitions were followed for Mineral Resources and Mineral Reserves.
(2) The Qualified Person for these Mineral Resources and Mineral Reserves estimates for Cauchari-Olaroz, Mr. Daniel S. Weber, P.G., RM-SME, reviewed and confirmed that there have been changes to data since the effective date of the estimates, however such change are not material and the Mineral Resources and Mineral Reserves and the underlying material assumptions remain current as of December 31. 2024.
(3) The Mineral Resource estimate is reported in-situ and exclusive of Mineral Reserves, where the lithium mass is representative of what remains in the reservoir after the life of mine ("LOM"). To calculate Mineral Resources exclusive of Mineral Reserves, a direct correlation was assumed between Proven Reserves and Measured Resources, and similarly, between Probable Reserves and Indicated Resources. Proven Mineral Reserves (from the point of reference of brine pumped from the wellfield to the evaporation ponds) were subtracted.
(4) The Mineral Resource Estimate is not a Mineral Reserve Estimate and does not have demonstrated economic viability. There is no certainty that all or any part of the Mineral Resources will be converted to Mineral Reserves.
(5) Calculated brine volumes only include Measured, Indicated, and Inferred Mineral Resource volumes above cut-off grade of 300 mg/L.
(6) Comparisons of values may not add due to rounding of numbers and the differences caused by use of averaging methods.
20
(7) Processing efficiency is assumed to be 53.7%.
(8) The commodity price of $20,000/tn for lithium carbonate (2025) for the life of the project was used to assess the economic viability for the mineral estimates.
| Summary of 2019 Mineral Resource Estimate for Lithium Represented as LCE, Exclusive of Mineral Reserves - Current as of December 31, 2024 | ||
| Classification | LCE (tonnes) | LCE - Lithium Argentina's 44.8% Portion (tonnes) |
| Measured Mineral Resources | 3,040,109 | 1,361,969 |
| Indicated Mineral Resources | 13,177,246 | 5,903,406 |
| Measured & Indicated Mineral Resources | 16,217,355 | 7,265,375 |
| Inferred Mineral Resources | 4,722,700 | 2,115,769 |
Notes:
(1) S-K §229.1300 definitions were followed for Mineral Resources and Mineral Reserves.
(2) The Qualified Person for these Mineral Resources and Mineral Reserves estimates for Cauchari-Olaroz, Mr. Daniel S. Weber, P.G., RM-SME, reviewed and confirmed that there have been changes to prices and data since the effective date of the estimates, however such change are not material and the Mineral Resources and Mineral Reserves and the underlying material assumptions remain current as of December 31. 2024.
(3) The Mineral Resource estimate is reported in-situ and exclusive of Mineral Reserves, where the lithium mass is representative of what remains in the reservoir after the LOM. To calculate Mineral Resources exclusive of Mineral Reserves, a direct correlation was assumed between Proven Reserves and Measured Resources, and similarly, between Probable Reserves and Indicated Resources. Proven Mineral Reserves (from the point of reference of brine pumped from the wellfield to the evaporation ponds) were subtracted. The average grade for Measured and Indicated Resources exclusive of Mineral Reserves was back-calculated based on the remaining brine volume and lithium mass.
(4) LCE is calculated using mass of LCE = 5.322785 multiplied by the mass of Lithium reported in Table 11.5.
(5) The Mineral Resource Estimate is not a Mineral Reserve Estimate and does not have demonstrated economic viability. There is no certainty that all or any part of the Mineral Resources will be converted to Mineral Reserves. Inferred Resources have great uncertainty as to their existence and whether they can be mined legally or economically.
(6) Calculated brine volumes only include Measured, Indicated, and Inferred Mineral Resource volumes above a lithium concentration cut-off grade of 300 mg/L.
(7) Comparisons of values may not add due to rounding of numbers and the differences caused by use of averaging methods.
(8) Processing efficiency is assumed to be 53.7%
(9) The commodity price of $20,000/tn for lithium carbonate (2025) for the life of the project was used to assess the economic viability for the mineral estimates.
The following material assumptions and parameters were used for the mineral resource estimates. Also, this information is available in Cauchari TRS Section 11:
21
| Table 11.2 Summary of Hydrostratigraphic Units and Assigned Specific Yield Estimates for the 2019 Mineral Resource Estimate (LAC, 2019) |
||
| Primary Unit | Minor Units | Specific Yield Estimate for Primary Unit (percent) |
| Alluvial Fan Sand and Gravel | Silt and Clay Lenses | 24.9 |
| Clay and Silt | Sand and Halite Lenses | 5.6 |
| Sanda | Clay/Silt, and Halite Lenses | 24.9 / 16.0 / 12.1 |
| Sand and Clay/Silt | Minor Halite Lenses | 16.0 |
| Halite | Clay/Silt and Sand Lenses | 5.9 |
| Basal Sand | Silt and Weathered Bedrock | 13.7 |
| (a) Sand unit modeled similarly to the LAC 2012 model where Sy generally decreases with depth: hydrostratigraphic model layers 4, 8, 11, and 16 were assigned values of specific yield of 24.9 percent; layer 13 was assigned 16.0 percent; layers 6, 19, and 21 were assigned 12.1 percent. |
||
22
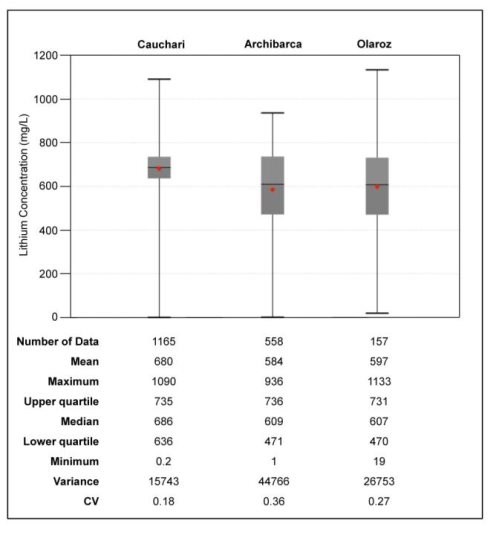
Figure 11.17 Box Plots of Lithium Concentrations - SdC, Archibarca, and SdO Areas
Mineral Reserve
The prior Mineral Reserve estimate for lithium, which was not prepared in accordance with S-K 1300, incorporates the updated Mineral Resource estimate and additional drilling and testing through an effective date of May 7, 2019. The Company has previously filed the NI 43-101 technical reports on the Cauchari-Olaroz Operation providing prior Mineral Resource estimates for lithium and the previous resource estimate was prepared in accordance with CIM standards under NI 43-101. To obtain the updated Mineral Reserve estimate, the previous hydro stratigraphic and numerical models and the expanded database were analyzed and updated by LRE Water. Once formulated and calibrated, the updated numerical model used a simulated production wellfield to project extraction from the brine aquifer and verify the feasibility of producing sufficient brine for processing a minimum target of 40,000 tpa of lithium carbonate for a 40-year operational period. After verifying the capability of the simulated wellfield to produce sufficient brine for the minimum 40,000 tpa lithium carbonate process target, the model was then used to predict a maximum production rate for assessment of total Mineral Reserve estimate for a 40-year production and process period of lithium carbonate.
23
The Proven and Probable Mineral Reserve estimate is summarized without factoring estimated process efficiency (pre-processing). The Measured and Indicated Mineral Resources correspond to the total amount of lithium enriched brine estimated to be available within the aquifer while the Proven and Probable Mineral Reserves represent a portion of the Mineral Resource estimate that can be extracted under the proposed pumping schedule and wellfield configuration. Therefore, the Mineral Reserve estimation is not "in addition" to the Mineral Resource estimate, and instead, it simply represents a portion of the total Mineral Resource that is extracted during the life of mine plan. A cut-off value was not employed in the Mineral Reserve estimate because the average calculated lithium concentration after 40 years of simulated mine life was significantly above the processing constraint.
| Summary of Estimated Proven and Probable Mineral Reserves (Without Processing Efficiency) | ||||||
| Reserve Classification |
Production Period (Years) |
Brine Pumped (m3) |
Average Lithium Concentration (mg/L) |
Lithium Metal (tonnes) |
LCE (tonnes) |
LCE - Lithium Argentina's 44.8% Portion (tonnes) |
| Proven | 0 through 5 | 156,875,201 | 616 | 96,650 | 514,450 | 230,474 |
| Probable | 6 to 40 | 967,767,934 | 606 | 586,270 | 3,120,590 | 1,398,024 |
| Total | 40 | 1,124,643,135 | 607 | 682,920 | 3,635,040 | 1,628,498 |
Notes:
(1) The Mineral Reserve Estimate has an effective date of May 7, 2019. The Qualified Person for these Mineral Resources and Mineral Reserves estimates for Cauchari-Olaroz, Mr. Daniel S. Weber, P.G., RM-SME, reviewed and confirmed that the Mineral Reserves estimates, along with the material assumptions related to them, as presented in the Cauchari TRS, remained accurate as of the effective report date of December 31, 2024.
(2) LCE is calculated using mass of LCE = 5.322785 multiplied by the mass of Lithium Metal.
(3) The conversion to LCE is direct and does not account for estimated processing efficiency.
(4) The values in the columns for "Lithium Metal" and "LCE" above are expressed as total contained metals.
(5) The production period is inclusive of the start of the model simulation (Year 0).
(6) The average lithium concentration is weighted by per well simulated extraction rates.
(7) Tonnage is rounded to the nearest 10.
(8) Comparisons of values may not be equivalent due to rounding of numbers and the differences caused by use of averaging methods.
(9) Processing efficiency is assumed to be 53.7%.
(10) The point of reference is brine pumped from the wellfield to the evaporation ponds.
(11) The commodity price of $20,000/tn for lithium carbonate (2025) for the life of the project was used to assess the economic viability for the mineral estimates.
The QPs believe the Mineral Reserve estimate has been conservatively modeled and represents a Proven Mineral Reserve for year one through five of full-scale extraction wellfield pumping and Probable Reserve for years six through 40 of extraction wellfield pumping. The division between Proven and Probable Mineral Reserves is based on: 1) sufficiently short duration of wellfield extraction to allow a higher degree of predictive confidence yet long enough to enable significant production; and 2) a duration long enough to enable accumulation of a strong data record to allow subsequent conversion of Probable to Proven Mineral Reserves.
24
During 2023 and 2024, the first years of operation, 39 wells were operative to support LCE production. During 2023, 496 l/s of brine were delivered to the wellfield and in 2024 an average of 706 l/s of brine were pumped.
Considering a conservative processing efficiency of 53.7%, the predicted results for the 40-year production period are as follows.
• Average production rate of 47,700 tpa LCE for the 40-year pumping period.
• Average production rate of 48,700 tpa LCE following the completion of the 40-year pumping period.
• Average lithium concentration of 609 mg/L for the 40-year pumping period, considering an average lithium grade assumption is 638 mg/l during the first years of operation.
• Minimum lithium concentration of 598 mg/L near the end of the pumping period in year 40.
Overview of Mining and Production Operations
In 2019, Exar developed a process for converting brine to high- purity lithium carbonate. The proposed process follows industry standards: pumping brine from the salar, concentrating the brine through evaporation ponds, and taking the brine concentrate through a hydrometallurgical facility to produce high-grade lithium carbonate. While the 2012 process model employed proprietary, state-of-the-art physiochemical estimation methods and process simulation techniques for electrolyte phase equilibrium, the 2019 model uses a process model that has been further refined using the results of lab scale and pilot scale testing from Exar, Ganfeng, and equipment suppliers, the results of which were implemented in the detail engineering of the facilities. The basis of the process methods has been tested and supported by laboratory test work, pilot testing facilities, and equipment vendor testing and design to support equipment guarantees.
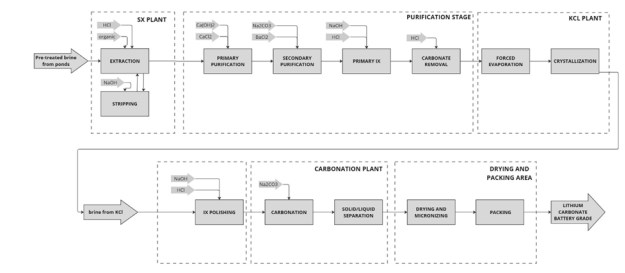
The process route simulated for the production of lithium carbonate from Cauchari brines resembles the flowsheet presented in shown in the "Overall Process Block Diagram" below.
Primary process inputs include evaporated brine, water, lime, soda ash, HCl, NaOH, and natural gas. The evaporation ponds produce salt tailings composed of Na, Mg, Ca, K, and borate salts. The brine concentrate from the terminal evaporation pond is further processed, through a series of polishing and impurity removal steps. Soda ash is then added with the purified brine concentrate to produce lithium carbonate that is dried, micronized, and packaged for shipping.
25
Overall Process Block Diagram
Operating criteria for the lithium carbonate plant is presented in the table below.
| Lithium Carbonate Plant Operating Criteria | ||
| Description | Unit | Value |
| Lithium carbonate production | tpa | 40,000 |
| Annual operation days | days | 292 |
| Annual operation hours | hours | 7,008 |
| Availability | % | 80 |
| Utilization (22 hours/day) | % | 97.2 |
| Plant Overall Efficiency | % | 53.7 |
Mineral Extraction
It is contemplated that brine will be extracted from 56 production wells situated across the Mineral Reserve area. The wells comprising the brine extraction wellfield are spatially distributed in the Mineral Reserve evaluation area of the Cauchari-Olaroz Operation to optimize well performance and capture of brine enriched in lithium. Production was initiated in year one of the pumping schedule representing 23 Stage 1 wells. In years two through 40, 33 wells are added to the pumping schedule for the duration of the life of mine plan. During the "Stage 2" pumping period, the average nominal pumping rate per well is 16 L/s capacity, providing approximately 903 L/s of lithium enriched brine from the aquifer to the evaporation ponds.
The pond system consists of 28 evaporation ponds segregated into the following types: (i) 16 pre-concentration ponds; (ii) six ponds used as halite ponds; (iii) two ponds used as sylvinite ponds; (iv) two ponds used for control; and (v) two ponds used for lithium ponds.
An average evaporation rate of 6.05 mm per day (2,157 mm/year) was used as a criterion to design the pond system. This rate corresponds to measured evaporation rates observed at the site where the ponds will be located. Assuming the above-mentioned evaporation rate, the total evaporation area required for the production of 40,000 tpa of lithium carbonate is 1,200 hectares when including consideration for harvesting of salt deposited in the ponds. The ponds are lined with a multi-layer liner consisting of polymer-based material and engineered granular bedding. The ponds configuration includes provision for uninterrupted production during salt harvesting and maintenance work. Brine will be transferred between the successive evaporation ponds using self-priming pumps.
26
Along with lithium, the pumped brine is projected to contain significant quantities of potassium magnesium, sulfate and boron. These constituents will be removed from the brine during the extraction and evaporation process to enable effective retrieval of lithium.
Processing and Recovery Operations
Exar and its consultants subjected the brine chemistry of the deposits to a process simulation, using physicochemical properties estimation methods and process simulation techniques for phase equilibrium of solids in electrolytes (brine), specially prepared for this project. This work has been supported by the results of laboratory evaporation test work and test work at both the pilot plant and the pilot ponds.
The process route simulated for the production of lithium carbonate from Cauchari brines is outlined in a flowsheet in the Cauchari TRS. Primary process inputs include evaporated brine, water, lime, soda ash, hydrochloride, sodium hydroxide, steam, and natural gas. The evaporation ponds produce salt tailings composed of sodium, magnesium, potassium and borate salts. The brine concentrate from the terminal evaporation pond is further processed, through a series of polishing and impurity removal steps. Soda ash is then added with the purified brine concentrate to produce a lithium carbonate precipitate, that is dried, compacted/micronized and packaged for shipping.
The Company estimates that the required brine production rate should be achieved with 46 brine wells. An additional seven wells are planned for backup purposes. It is estimated that an additional one well per year of operation will be drilled throughout the 40-year operation to maintain brine productivity.
At start-up, 40 production wells were delivered for brine production, with an estimated average nominal capacity of 16.3 L/s, that will provide up to 652 L/s of brine to the ponds. Additionally, 13 wells will be completed during the first five years to have the operation fed by 53 wells. This flow rate assumes a yield of 53.7% on the whole lithium carbonate process
The wells will be screened across the most productive lithium and sealed against freshwater aquifers.
Site Infrastructure and Support Systems
Construction of the project commenced in 2018. Natural gas is obtained from the Rosario gas compression station, which is on the Gas Atacama pipeline, 52 km north of the project site. This pipeline is be capable of supplying natural gas at capacities that are sufficient for a 40,000 tpa lithium carbonate facility.
Electricity is provided by a 33 kV transmission line that interconnects with an existing 345 kV transmission line located approximately 60 km south of the Cauchari-Olaroz Operation. The interconnection involves a sub-station with a voltage transformer (345/138 kV) and associated switchgear. Another substation at the Cauchari-Olaroz Operation site consists of A stepdown 33/13.2 kV substation at the Project site, consist of two voltage transformers (33/13,2 kV, 15-20 MVA), one (1) 33 kV electrical room and one (1) 13.2 kV electrical room with suitable switchgears and auxiliary equipment for the 13.2 kV local distribution system.
The 13.2 kV local electrical distribution system provides power to the plant, camp, intermediate brine accumulation and homogenizing pools/lime pumps, wells and evaporation ponds. In general, all distribution is aerial unless there are major restrictions, in which case underground distribution is adopted. The estimated load for the Cauchari-Olaroz Operation is approximately 123,461 MWh/y or 16.4 MW/h, which includes a design safety factor of 1.2. The power line has sufficient capacity for this load plus the existing users A stand-by dual diesel/gas generating station, located close to the main substation, can power selected equipment during grid outages.
27
Water for industrial use is supplied by groundwater wells adjacent to the salar and a water pipeline from the north. The infrastructure for water handling includes wells, low-voltage transmission lines to power the wells, pipelines, storage tanks and reverse osmosis plants. Water is required by the process and both camps.
The construction and permanent camps are located approximately 8,000 m south of National Highway 52. The permanent camp is a full habitation and administrative complex to support all workforce activities, with a capacity for 634 people, and includes office buildings, bedrooms, dining facilities, medical room, and recreation areas, consisting of a gym, an indoor sports center, a recreation room and an outdoor soccer field. The permanent camp covers a footprint of 8,500 m2 of buildings and 35,700 m2 of external facilities. In the construction camp there are eight housing modules with a total capacity of 392 people, of which only three modules are currently in use. In addition, this camp includes the pilot plant facilities, water treatment plants, and contractor workshops.
Additional buildings in permanent camp include: lithium carbonate plant; spare parts and consumables warehouse building; soda ash storage building; final product - lithium carbonate - storage building; chemical laboratory; maintenance shop; and water treatment plants.
The figure below shows the location of the main facilities that are part of the Cauchari-Olaroz Operation, including:
• Well field;
• Evaporation ponds;
• Lithium carbonate plant;
• Salt and process residues disposal; and
• Camp.
28
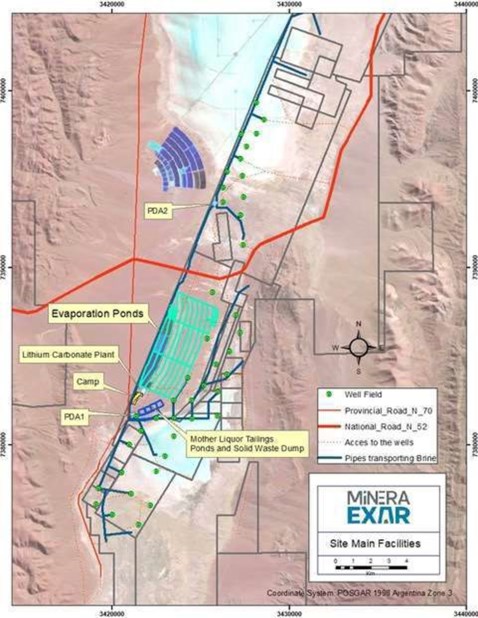
Well Production Equipment Selection. Screened wells target the largest lithium brine aquifers. Submersible electric pumps are used for brine pumping. These pumps send the brine to evaporation ponds through a network of pipelines and mixing pools.
Evaporation Ponds. An average water evaporation rate of 6.26 mm per day was used as criterion to design the pond system. This rate corresponds to measured evaporation rates observed at the site where the ponds are located.
Assuming the above-mentioned evaporation rate, the total evaporation area required for the production of 40,000 tpa of lithium carbonate is 1,200 ha when including consideration for harvesting of salt deposited in the ponds. The ponds are lined with multi-layer liner consisting of a polymer-based material and engineered granular bedding. The ponds configuration includes provision for uninterrupted production during salt harvesting and maintenance work.
Brine is transferred between the successive evaporation ponds using self-priming pumps.
29
Salt Harvest Equipment. In order to recover pond volume taken up by precipitated salt and recover lithium values entrapped with the brine; salt is harvested. Harvesting began after the third year of steady pond operation.
The harvesting operation consists of draining the free brine from the pond, scraping the salt to a minimum depth, and making drainage trenches before removing salt.
Exar is allocating land to host waste salt deposits, which are expected to reach up to 15 m in height and cover 740 hectares over a 40-year mine life. These deposits are inert, with sodium chloride and sulphate making up approximately 87% of the material, and do not introduce foreign compounds to the environment. Cauchari-Olaroz has established an evaporation pond for its industrial liquid waste, and a 50 hectare area is allocated for this purpose.
Mining and Environmental Permits
Exar has developed a plan that promotes social and economic development within a sustainable framework. Exar began work on the Communities Relations Program with the Department of Susques in the Province of Jujuy in 2009. This plan was created to integrate local communities into the Cauchari-Olaroz Operation by implementing programs aimed at generating positive impacts on these communities.
Permitting processes for the Cauchari-Olaroz Operation are governed by Argentina's national and provincial laws, with oversight from the Jujuy provincial government. Recent updates under Decree No. 7,751- DEyP-2023 have modernized permitting standards, including enhanced consultation protocols and mandatory financial assurances for closure. The Cauchari-Olaroz Operation's permits for exploration and exploitation activities are in full compliance, with biannual updates submitted as required.
| SUMMARY OF KEY PERMITTING MILESTONES | ||
| Permit Type |
Date Approved |
Key Updates |
| Exploration | August 2009 (initial) | Regular biannual updates reflecting new activities. |
| Exploitation | November 2012 (initial) | Expand production capacity and operational adjustments. |
| Water Use | December 2020 (160 L/s) |
Permanent concession granted; additional permits pending. |
An additional water concession permit for a further 160 L/s from the south of the basin, for the exploitation phase for a 40 year terms, has been submitted and is currently under evaluation.
The Cauchari-Olaroz Operation has also obtained approvals for the provision of electricity to the Exar plant and for internal consumption by Resolution No. 406/2019 SCA, for natural gas by Resolution No. 350/2019 SCA and addendum approved by Resolution No. 215/2020 SCA, for water treatment plant at the construction camp by Resolution No. 327/2018 SCA, for water treatment plant at the operations camp by Resolution No. 226/2020 SCA and for aqueduct with environmental feasibility by Resolution No. 310/2020 SCA.
Operating Costs
The Cauchari TRS presents a cost estimate (±15% expected accuracy) for the Cauchari-Olaroz Operation of US$6,543 per tonne of lithium carbonate, based on 40,000 tpa lithium carbonate production. This estimate is based upon vendor purchase orders for main costs such as reagents, fuel (diesel and natural gas), electricity, maintenance, halite harvesting, transport, and catering and camp services. Reagents consumption rates were determined by pilot plant and laboratory work, as well as detailed process mass and energy balances. Energy consumption was determined on the basis of the specific equipment considered in each sector of the facilities and their utilization rate. Labour requirements are based on Exar's actual manpower used during the ramp up period.
30
Labour costs have been estimated using the results of a salary survey, carried out on behalf of Exar in Argentina, on mining companies with similar conditions and actual salaries paid by Exar. Consumables costs were estimated on the basis of existing supplier contracts and forecasted changes in future prices.
The exchange rate between the Argentine peso and the U.S. dollar has been assumed as AR$970/US$1. No provision for currency escalation has been included.
| Operating Costs Summary | |||
| Description | Total (US$ 000s/Year) |
Lithium Carbonate (US$/Tonne) |
Allocation of Total OPEX (%) |
| Direct Costs | |||
| Reagents | 100,981 | 2,525 | 38.60% |
| Maintenance | 24,701 | 618 | 9.4% |
| Electric Power | 9,283 | 232 | 3.5% |
| Pond Harvesting & Tailing Management | 24,348 | 609 | 9.3% |
| Water Treatment System | 0 | 0 | 0 |
| Natural Gas | 4,455 | 111 | 1.70% |
| Manpower | 32,059 | 801 | 12.20% |
| Catering, Security & Third-Party Services | 32,083 | 802 | 12.30% |
| Consumables | 6,443 | 161 | 2.50% |
| Diesel | 3,249 | 81 | 1.20% |
| Bus-In / Bus-Out Transportation | 0 | 0 | 0 |
| Product Transportation | 9,200 | 230 | 3.5% |
| Direct Costs Subtotal | 246,803 | 6,170 | 94.30% |
| Indirect Costs | |||
| G&A | 14,912 | 373 | 5.7% |
| Indirect Costs Subtotal | 14,912 | 373 | 5.7% |
| Total Operating Costs | 261,714 | 6,543 | 100.0% |
Capital Costs
Capital costs for Cauchari-Olaroz ("CAPEX") are based on the total engineering and construction work, having a design capacity of 40,000 tonnes per year of lithium carbonate. The CAPEX is expressed in current US dollars on a 100% project equity basis. The Company contributed 49% of these costs, matching its shareholding in Exar and excluding JEMSE's 8.5% interest.
Capital costs include direct and indirect costs for:
31
- Brine production wells.
- Evaporation and concentration ponds.
- Lithium carbonate plant.
- General site areas, such as electric, gas, and water distribution.
- Stand-by power plant, roads, offices, laboratory and camp, and other items.
- Off-site infrastructure, including gas supply pipeline and high voltage power line and water pipeline; and
- Salaries, construction equipment mobilization, and other expenses.
The capital investment for the 40,000 tpa lithium carbonate project, including equipment, materials, indirect costs and contingencies after completion of the construction period is consolidated to US$979 million. This total excludes interest expense capitalized during the same period. Disbursements of these expenditures started in 2017 as part of the 25,000 tpa lithium carbonate project.
These capital expenditures are summarized in the table below:
| Capital Costs Summary | |
| Item | US$ M |
| Direct Cost | |
| Salar Development | 51.0 |
| Evaporation Ponds | 175.5 |
| Lithium Carbonate Plant and Aux. | 361.7 |
| Reagents | 26.2 |
| On-Site Infrastructure | 108.7 |
| Off-Site Services | 13.6 |
| Total Direct Cost | 736.7 |
| Indirect Cost | |
| Total Indirect Cost | 224.5 |
| Total Direct and Indirect Cost | 961.2 |
| Others | 17.8 |
| Total Capital | 979 |
| Expended to date | 979 |
| Estimate to complete | - |
Sustaining capital expenditures are estimated to total US$990.5 million over the 40-year evaluation period of the Cauchari-Olaroz Operation.
Capital costs include direct and indirect costs for:
- Brine production wells;
- Evaporation and concentration ponds;
- Lithium carbonate plant;
- General site areas, such as electric, gas and water distribution;
- Stand-by power plant, roads, offices, laboratory and camp and other items;
- Off-site infrastructure, including gas supply pipeline and high voltage power line and water pipeline; and
32
- Contingencies, salaries, construction equipment mobilization and other expenses.
The following items were not included in the estimate:
- Legal costs;
- Costs to implement the COVID Protocol and special incentives and allowances;
- Mineral license costs;
- Escalation; and
- Start-up costs beyond those specifically included.
Project Economics
An economic analysis was outlined in the Cauchari TRS considering that construction for the project commenced in 2018 and significant funds were spent since then. All capital expenditures prior to December 31, 2024 are considered sunk and are not included in the capital expenses in the economic model. Only capital expenditures from December 31, 2024, onwards are included. Investment decisions are made on a forward-looking basis. The purpose of the economic model is to assess whether future capital expenses and operations, with updated product price, production costs, and other assumptions, will bring a positive economic result. Positive economic results include future cash flows, generated from sales of the finished product, less related cost of sales and other expenses, excluding capital expenditures prior to December 31, 2024. The economic assessment ignores sunk costs in the determination of cash flows and economic indicators. However, these costs are considered as opening balances for the purpose of determining tax assets and liabilities. With the exclusion of the historic capital spent from the discounted cashflow, the presentation of an IRR value is not considered to be applicable.
Information contained in the Cauchari TRS, including (but not limited to) the project economics for the Cauchari-Olaroz Operation presented below (including, for greater certainty, revenue, net present value, cash flow and earnings) are presented as of the effective date of the Cauchari TRS based on criteria, assumptions, estimates and other information available at the time and therefore may not reflect actual results and outcomes, updated project economics, capital costs and/or operating costs for the project. As a result, actual results may differ from those presented. See "Item 3.D. - Risk Factors".
The following criteria have been used to develop the economic model:
- Engineering and construction period is estimated at four years, while the life of mine is estimated to be 40 years;
- Pricing was obtained from a market study (see Section 16 of the Cauchari TRS). Deductions to the price related to the removal of trace levels of impurities to achieve battery quality lithium carbonate are described as tolling costs in the economic model and deducted from revenue;
- Production based on design capacity of 40,000 tpa of lithium carbonate;
- Valuation date of December 31, 2024;
- For project evaluation purposes, it has been assumed that 100% of capital expenditures, including pre-production expenses and working capital are financed with owners' equity;
- Brine composition may be suitable for extraction and commercial production of other salts or other chemical compounds such as Boric Acid (H3BO3), potassium, etc. These options were not included in the Cauchari TRS;
- The economic evaluation was carried out on a constant money basis so there is no provision for escalation or inflation on costs or revenue;
- All values are expressed in current US dollars; the exchange rate between the Argentine peso and the US dollar as at October 31, 2024 was AR$970/US$. Argentine peso denominated costs follow the exchange rate as a result of inflation, and the impact of the exchange rate fluctuation on CAPEX and OPEX has been incorporated; no provision for currency escalation has been included; and
33
- The base-case assessment was carried out on a 100%-equity basis. Apart from the base case discount rate of 8.0%, two (2) variants of 6.0% and 10.0% were used to determine the NPV of the Cauchari-Olaroz Operation. These discount rates represent possible costs of equity capital.
In addition to capital and operating cost expenses as set forth in the Cauchari TRS, project economics are based on additional expenses and cash flow items including: Argentinean transaction tax, Jujuy provincial and private royalties, licenses and permits, export refunds, easement rights, equipment depreciation, sustaining capital, exploration expenses, amortization and remediation allowances.
Production Schedule
The Cauchari TRS production model outlines lithium carbonate production totaling 1,452,000 tonnes over period from 2025 to 2060. Overall efficiency of brine processing to produce lithium carbonate is reported to be 53.7%. To account for processing efficiency, the net amount of lithium carbonate produced was computed by multiplying the LCE extracted from the well field by 53.7%. The resulting values from each production well were then summed for each production year to determine the predicted annual lithium carbonate production. During the entire 40-year simulated production period the cumulative lithium carbonate, after accounting for processing efficiency, is projected to average 38,667 tonnes from the years 2025-2023 and 40,000 tonnes for years 2031-2060.
In the Cauchari TRS production model, it is assumed that in for years 2025-2030 average annual revenue will be US$709,000,000 and for years 2031-2060 average annual revenue will be US$780,000,000. The production model assumes a lithium carbonate price of US$20,757/tonne. The commodity price of $20,000/tn for lithium carbonate (2025) was used to assess the economic viability for the mineral estimates but was not used for cut-off purposes.
NPV
Set forth below is a table that illustrates the sensitivity of the project economics based on three lithium carbonate pricing scenarios and discount rates. The below is presented on a 100% project equity basis and measured from the end of the capital investment period. The Company owns 44.8% of the Cauchari-Olaroz Operation as of the date of this annual report.
| TABLE 19.6 PROJECT EVALUATION ECONOMIC SUMMARY |
||||
| Price Case | Unit | High | Medium | Low |
| Average Lithium Price Li2CO3 | US$/tonne | $21,645 | $20,757 | $19,641 |
| Key Statistics | ||||
| Project capacity | tonnes | 40,000 | 40,000 | 40,000 |
| Sustaining CAPEX | US$ M | $990 | $990 | $990 |
| OPEX | US$/tonne | $6,543 | $6,543 | $6,543 |
| Max negative cash flows | US$ M | $-13 | $2 | $-87 |
| Average Lithium price Li2CO3 | US$/tonne | $21,645 | $20,757 | $19,641 |
34
| Average yearly values | ||||
| Revenue | US$ M | $793 | $758 | $714 |
| OPEX | US$ M | $-258 | $-258 | $-258 |
| Other Expenses | US$ M | $-38 | $-38 | $-35 |
| EBITDA1 | US$ M | $497 | $463 | $421 |
| Before taxes | ||||
| NPV (6%) | US$ M | $7,430 | $6,538 | $5,311 |
| NPV (8%) | US$ M | $6,044 | $5,230 | $4,101 |
| NPV (10%) | US$ M | $5,049 | $4,305 | $3,263 |
| After taxes | ||||
| NPV (6%) | US$ M | $5,035 | $4,466 | $3,630 |
| NPV (8%) | US$ M | $4,122 | $3,603 | $2,830 |
| NPV (10%) | US$ M | $3,466 | $2,992 | $2,274 |
1 EBITDA is non-GAAP financial measures and has no standardized meaning under IFRS Accounting Standards as issued by the International Accounting Standards Board (IASB) ("IFRS Accounting Standards") and may not be comparable to similar measures used by other issuers. The Company does not have historical non-GAAP financial measures nor historical comparable measures under IFRS, and therefore the foregoing prospective non-GAAP financial measure may not be reconciled to the nearest comparable measure under IFRS. Because the Company has provided these measures on a forward-looking basis, it is unable to present a quantitative reconciliation to the most directly comparable financial measure calculated and presented in accordance with IFRS without unreasonable efforts. This is due to the inherent difficulty of forecasting the timing or amount of various reconciling items that would impact the most directly comparable forward-looking IFRS measure that have not yet occurred, are outside of the Company's control and/or cannot be reasonably predicted.
35
Discounted Cash Flow
The figure below summarizes cash flows on a yearly basis for the period for the medium price scenario.
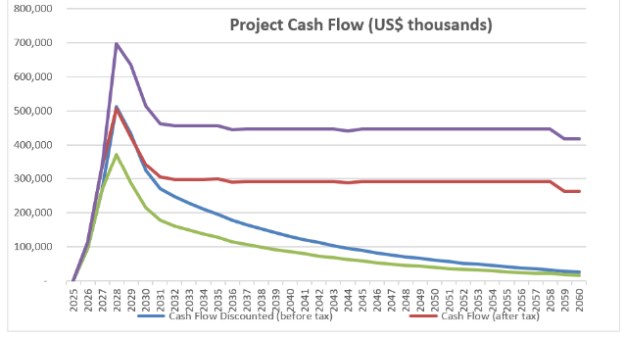
Mineral Reserve and Resource Estimate Comparison Between December 31, 2023 and 2024
For the year ended December 31, 2023, the Company was not subject to S-K 1300, and reported its mineral reserve and resources in accordance with NI 43-101. For ease of comparison, the estimates for the project are shown on a 100% basis. The Company's attributable interest is 44.8% of the tonnage stated in the tables.
Mineral Resources
The table below sets forth the comparison of the Mineral Resources as set forth in the Company's annual report on Form 40-F for the year ended December 31, 2023, and as set forth in the Company's annual report on Form 20-F for the year ended December 31, 2024. The decreases in the mineral resources are primarily due to the fact that under S-K 1300, mineral resources are estimated exclusive of mineral reserves.
| December 31, 2024(1) | December 31, 2023(2) | Percent Difference | ||||
| Category | Lithium Tonnes |
LCE Tonnes | Lithium Tonnes |
LCE Tonnes | Lithium | LCE |
| Measured | 571,150 | 3,040,109 | 667,800 | 3,554,700 | (14)% | (14)% |
| Indicated | 2,475,630 | 13,177,246 | 3,061,900 | 16,298,000 | (19)% | (19)% |
| Measured + Indicated | 3,046,780 | 16,217,355 | 3,729,700 | 19,852,700 | (18)% | (18)% |
| Inferred | 887,300 | 4,722,700 | 887,300 | 4,722,700 | -% | -% |
36
Mineral Reserves
There has been no change in the proven and probable mineral reserves as set forth in the Company's annual report on Form 40-F for the year ended as of December 31, 2023, and as set forth in the Company's annual report on Form 20-F for the year ended December 31, 2024.
37
Pastos Grandes Project
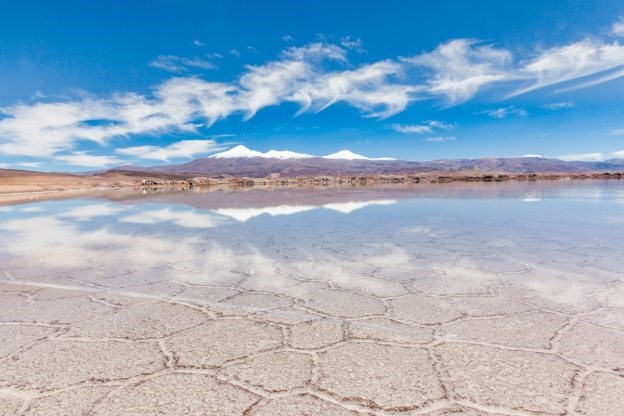
Project Overview
The Pastos Grandes Project was acquired by the Company in connection with the acquisition of 100% of the issued and outstanding shares of Millennial Lithium on January 25, 2022. The Pastos Grandes Project is an exploration stage lithium brine mineral project located in the central portion of the Salar de Pastos Grandes basin in the Salta Province, Argentina.
The site of the Pastos Grandes Project is near Highway 129 which connects 40 km north with Highway 51. Highway 51 traverses from Salta to the international border with Chile at the Sico Pass and connects further west to the major mining center of Calama, as well as the ports of Antofagasta and Mejillones in northern Chile. Both ports are major transportation hubs for the importation of mining equipment and the exportation of mineral commodities.
The total book value of the Pastos Grandes Project is $351 million as of December 31, 2024.
The Company retained Atacama Water to prepare "NI 43-101 Technical Report: Lithium Resource Update Pastos Grandes Project, Salta Province, Argentina" with an effective date of April 30, 2023, with the objective of updating the resource estimate for lithium contained in brine for the Company's properties in the Pastos Grandes basin excluding the Sal de la Puna properties based on the consolidation and integration of available information. The resource estimation for the Pastos Grandes Project was developed using SgeMS and the geological model as a reliable representation of the local lithology. The principal author was closely involved with the block model development; all results have been reviewed and checked at various stages and are believed to be valid and appropriate for these resource estimates. CIM definitions were followed for Mineral Resources, and the works were certified by the "qualified person" Frederik Reidel, CPG. The effective date of the Mineral Resources estimate is December 31, 2024.
38
Information contained in the Pastos Grandes TRS Grandes Project are presented as of the date of the Pastos Grandes TRS based on criteria, assumptions, estimates and other information available at the time and therefore may not reflect actual results and outcomes for the project. As a result, actual results may differ from those presented. See "Risk Factors - Risks Related to Resource Development".
Recent Developments
In August 2024, the Company completed the transaction with a subsidiary of Ganfeng whereby Ganfeng Lithium acquired $70 million in newly issued shares of PGCo, the Company's indirect wholly-owned Argentinian subsidiary holding the Pastos Grandes Project, which represents an approximate 14.89% interest in PGCo and the project. Proceeds of the subscription were allocated to the advancement of the Company's lithium projects in Argentina. In connection with the subscription, the Company and Ganfeng executed a shareholders agreement that, among other terms, provides for limited term rights and obligations as between the parties, including the following: (i) from the closing date until December 31, 2024, a standstill on the sale of an interest in the Pastos Grandes Project; (ii) during the course of 2025, enhanced consent rights in favour of Ganfeng in respect of operational matters, as well as a right of first refusal in favour of Ganfeng over a sale of an interest in PGCo at the same valuation as that applicable to the Pastos Grandes Transaction (with the Company having a right of first refusal over a sale by Ganfeng of its interest); (iii) from closing through to December 31, 2025, a right in favour of Ganfeng to acquire an aggregate 50% interest in the Pastos Grandes Project upon a change of control of the Company by subscribing for share capital of PGCo in consideration for an incremental cash subscription price of US$330 million; and (v) from January 1, 2025 to September 30, 2025, an enhanced 'tag-along' right of Ganfeng to include its interest along with a sale by the Company of its interest in PGCo , and to realize a portion of the consideration that would otherwise be payable to the Company upon such sale in addition to the equivalent proportionate consideration payable for the interest of Ganfeng (after such period the "tag along right" will survive but will only include the proportionate consideration).
Ganfeng and Lithium Argentina had have begun advancing thepreparation of a regional development plan for the Pastos Grandes basin, which includes the Company's Pastos Grandes Project and the Sal de la Puna project, and Ganfeng's adjacent Pozuelos project. The development plan will include significant technical collaboration to explore the best technologies, including direct lithium extraction ("DLE") technology to complement the existing conventional solar evaporation process. The Company and Ganfeng have conducted significant early works studies at the Pastos Grandes Project and Ganfeng's adjacent Pozuelos project, respectively. As a result, there is a rich data set that can be used to produce a comprehensive development plan. The Company also continues to investigate measures by which it can leverage the Company's experience and learnings from development of the Cauchari-Olaroz Operation.
The offtake rights for the Pastos Grandes Project remain uncommitted, which will allow the Company to explore opportunities to bring in new customers and financing to accelerate and support development of the global lithium chemical supply chain.
Detailed Property Description
Technical Information
More detailed scientific and technical information on the Pastos Grandes Project can be found in "NI 43-101 Technical Report: Lithium Resource Update Pastos Grandes Project, Salta Province, Argentina" with an effective date of April 30, 2023, that was filed with the securities regulatory authorities in each of the provinces and territories of Canada, and was prepared by Frederik Reidel, CPG, of Atacama Water, who is a "qualified person" for the purposes of NI 43-101 and S-K 1300 by virtue of his experience, education, and professional association and who is independent of the Company. Reference should be made to the full text of the "NI 43-101 Technical Report: Lithium Resource Update Pastos Grandes Project, Salta Province, Argentina" with an effective date of April 30, 2023, which is available for viewing under the Company's profile on SEDAR+ at www.sedarplus. com. All capitalized terms used in the disclosure below that are not otherwise defined shall have the meanings ascribed thereto in "NI 43-101 Technical Report: Lithium Resource Update Pastos Grandes Project, Salta Province, Argentina" with an effective date of April 30, 2023.
39
Property Description and Location
The Company acquired the Pastos Grandes Project from Millennial Lithium in January 2022. The Company subsequently acquired additional mining concessions (LAC Norte and Sur) during 2022.
The Pastos Grandes Project is situated within the Department of Los Andes, approximately 10 km south of the village of Santa Rosa de Los Pastos Grandes, and 130 km west of the city of Salta, the capital of the Salta Province in Argentina. The center point of the Pastos Grandes Project is situated at approximately 3,428,966 mE, 7,283,194 mN (POSGAR 04 / Argentina zone 3). The Pastos Grandes Project encompasses a surface area of more than 24,000 hectares in the hydrographic basin of Salar de Pastos Grandes at an elevation of roughly 3,785 masl.
The Pastos Grandes Project site is situated near Highway 129 which connects 40 km north with Highway 51. Highway 51 traverses from Salta to the international border with Chile at the Sico Pass and connects further west to the major mining center of Calama, as well as the ports of Antofagasta and Mejillones in northern Chile. Both ports are major transportation hubs for the importation of mining equipment and the exportation of mineral commodities. The Pastos Grandes Project is in the vicinity of the existing railroad between Salta and Antofagasta that is administrated by two different companies: The Chilean Ferrocarril Antofagasta - Bolivia (Luksic Group) and the Argentinean state owned Ferrocarril Belgrano. It consists of a narrow-gauge railway connecting Antofagasta (Chile) on the Pacific coast to the northern part of Argentina with connections to Buenos Aires on the Atlantic coast. The connection between Pocitos - Antofagasta has been reinstated in cooperation between the regional governments and is currently active shipping product for a lithium operation in Salar del Hombre Muerto. A natural gas line (Gas de la Puna) with a distribution terminal is in the village of Pocitos. Here gas is redistributed to lithium operations in the Puna currently being developed. It is planned that the Pastos Grandes Project will connect to this terminal with a dedicated pipeline for the supply of natural gas during operations. It is expected that all industrial water supply requirements for the Pastos Grandes Project can be developed from groundwater resources hosted in the alluvial fans surrounding Salar de Pastos Grandes. The Pastos Grandes Project controls sufficient surface rights to execute the contemplated mining and processing activities.
40
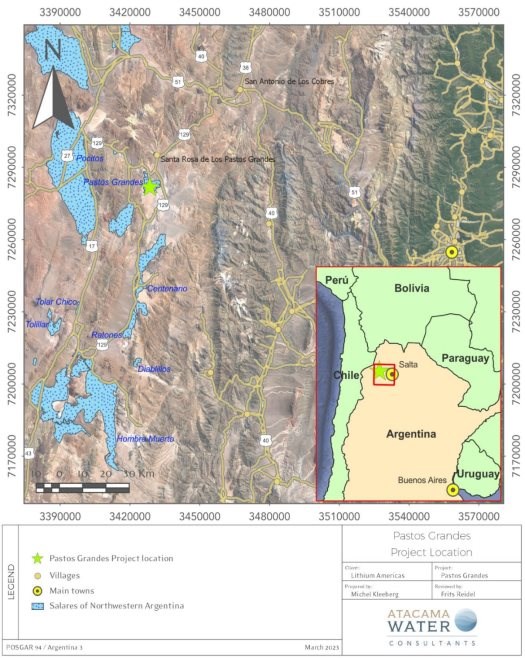
Mineral Tenure
Argentine Tenure Regime
The Argentine mining regulations recognize two types of tenements. Cateos, also known as Exploration Permits, grant permission to explore the tenement for a period that is proportional to its size. The other type of tenement is known as "Mines" or "Claims". This kind of permit grants authorization to exploit the tenement, subject to regulatory environmental approval. These licenses have no time limit, provided that the property holder fulfils their obligations under the Mining Code. These obligations include:
● Paying the annual rent (canon);
● Completing a survey of the property boundaries;
41
● Submitting a mining investment plan; and
● Meeting the minimum investment commitment.
The mining concessions comprising the Pastos Grandes Project is registered as "Mines" under the file numbers listed in the table below in the Department of Los Andes (Salta Province). The properties the Company recently acquired through the acquisition of Arena Minerals are not included in this list.
Through its 85.1% percent ownership of PGCo (which ownership interest is subject to the Pastos Grandes Transaction; see "Item 4. - Property, Plants and Equipment - Recent Developments"), the Company controls the Pastos Grandes Project. There are no known obstacles to PGCo maintaining ownership on these titles, with the caveat (i) on those areas that were claimed by multiple parties that a lottery may be held, and that area be awarded to a third party (Title 37). All patent (canon) payments are up to date on all those claims where the patent is due. All claims are free from any evidence of mortgages, encumbrances, prohibitions, interdictions, or litigation.
Mining Tenements of the Pastos Grandes Project
| Nª | Name | File No. | Property | Salar | Surface area (ha) |
| 1 | Aguamarga 10 | 19092 | PPG-SA | Pastos Grandes | 3,087 |
| 2 | Aguamarga 15 | 19097 | PPG-SA | Pastos Grandes | 1,298 |
| 3 | Centenario I | 19475 | PPG-SA | Pastos Grandes | 799 |
| 4 | Corral colorado - Cantera | 24333 | PPG-SA | Pastos Grandes | 50 |
| 5 | Daniel Ramon | 18571 | PPG-SA | Pastos Grandes | 1,837 |
| 6 | El Milagro | 17588 | PPG-SA | Pastos Grandes | 101 |
| 7 | Ignacio I | 17606 | PPG-SA | Pastos Grandes | 501 |
| 8 | Ignacio IV | 17630 | PPG-SA | Pastos Grandes | 178 |
| 9 | Ignacio IV (*) | 17630 | PPG-SA | Pastos Grandes | 850 |
| 10 | Jorge Eduardo | 18693 | PPG-SA | Pastos Grandes | 598 |
| 11 | Neptali II. | 18403 | PPG-SA | Pastos Grandes | 166 |
| 12 | Norte Argentino I | 18550 | PPG-SA | Pastos Grandes | 358 |
| 13 | Nueva Sijesytea-01 | 23736 | PPG-SA | Pastos Grandes | 110 |
| 14 | Ona | 1268 | PPG-SA | Pastos Grandes | 297 |
| 15 | Papadopulos LXXIV | 20247 | PPG-SA | Pastos Grandes | 3,044 |
| 16 | Papadopulos XXXII | 19667 | PPG-SA | Pastos Grandes | 301 |
| 17 | PPG01. | 24231 | PPG-SA | Pastos Grandes | 971 |
42
| 18 | PPG02 | 24255 | PPG-SA | Pastos Grandes | 3,324 |
| 19 | PPG04 | 734830 | PPG-SA | Pastos Grandes | 95 |
| 20 | PPG05 (ULEX-BORAX-PPG) | 741663 | PPG-SA - PASA | Pastos Grandes | 231 |
| 21 | TABAPG | 20016 | PPG-SA | Pastos Grandes | 316 |
Note:
(1) Tenement coordinates are given in the Argentine coordinate system which uses the Gauss Krueger Transverse Mercator projection and the Argentine Posgar 94 datum.
Royalties
In addition to certain royalties mentioned above, the Argentine federal government regulates ownership of mineral resources, although mineral properties are administered by the provinces. In 1993 the federal government established a limit of 3% on mining royalties to be paid to the provinces as a percentage of the "pit head" value of extracted minerals. ANG is expecting a 3% royalty payable to the Salta Province based on earnings before income tax if a brine mining operation is established.
History
Borate mining has taken place in the general vicinity of Salar de Pastos Grandes since the early 1960s. Borax Argentina, recently divested by Allkem Limited, extracts colemanite, hydroboracite, and ulexite from the Sijes Formation located on tenements situated on the southern and eastern edges of the Pastos Grandes basin. These minerals are processed at the Sijes borates plant.
In 1979, DGFM (a state-owned Argentine arms manufacturer) conducted a lithium exploration program that covered several salars in north-western Argentina, including Salar de Pastos Grandes. The exploration included surface mapping and sampling of six brine samples from surface, eight from hand-dug pits, and four from streams around the Salar de Pastos Grandes. The sampling campaign found lithium and potassium concentration anomalies with average values of 384 parts per million (ppm) Li and 4,066 ppm K for the pit samples, and 327 ppm Li and 3,518 ppm K for the surface samples. The stream samples reported lithium concentration below detection limits.
In 1987 ULEX S.A. began borate production at the Sol de Mañana Mine in the south-eastern portion of the Salar near the Rio Sijes reaching a production of near 1,000 tonnes of colemanitehydroboracite- ulexite per year (Hains et al., 2018). Tramo SRL has mined borates (colemanite) at the Quebracho property on the southern border of Salar de Pastos Grandes and common salt (halite, NaCl) on the salar's surface since 2006. Other smaller mining companies have also carried out salt exploitation over various properties in the Salar.
During 2011 and 2012, Eramet SA ("Eramet") through its subsidiary Eramine Sudamerica SA ("Eramine") carried out exploration activities in the Salar de Pastos Grandes including geophysical surveys (VES, TEM and Controlled Source Audio Magnetotellurics survey ("CSAMT") campaigns, all as defined below), drilling (exploration and production wells to maximum depth of 160 m), testing, and geochemical sampling. This work has been referred to as the Stage One of investigation of the Pastos Grandes Project and identified a lithium-enriched brine aquifer with lithium concentrations ranging between 330-560 mg/L and a ratio Mg:Li of between 5.35 - 7.87.
LSC Lithium Corporation ("LSC Lithium") undertook an exploration program between 2016 and 2018 focused on the western and central portion of Salar de Pastos Grandes.
Millennial Lithium conducted an extensive program of field work across the Salar de Pastos Grandes from 2016 to 2021 known as the Stage Two and Three investigations of the Pastos Grandes Project. In January of 2022, the Company completed the acquisition of Millennial Lithium including the Pastos Grandes Project. The Company is currently carrying out additional works, engineering and other optimization studies. In addition, in connection with the Pastos Grandes Transaction, the Company announced that Ganfeng, with support of the Company, will undertake preparation of a regional development plan for the Pastos Grandes basin, which includes the Pastos Grandes Project and the Sal de la Puna project and Ganfeng's adjacent Pozuelos project, and which is expected to be finalized in 2025.
43
Centaur Resources Ltd. ("Centaur") carried out lithium exploration activities on the 'Alma Fuerte' mining claim of its Sal de la Puna project immediate to the south and east of the Company mining claims during 2018/2019. This program included drilling of three boreholes including a pumping well to around 600 m depth, pumping tests, and seismic & TEM geophysical surveys.
Geological Setting, Mineralization and Deposit Types
Regional Geology
Tectonic Context
The main lithium-containing region of South America is in the Puna Plateau of the central Andes. The Puna Plateau is approximately 2,000 km long, 300 km wide and has an average elevation of 3,700 masl. The eastern volcanic arc and centres have been active from the Miocene to the present and are the source of mineralized fluids throughout the plateau. The uplift of the Puna Plateau is the result of the crustal shortening that occurred in the Tertiary and magmatic accumulation.
The section of the Puna which developed in Argentina shows distinct features of the Altiplano than those seen in Bolivia and Peru. This zone can be divided into Southern Puna and Northern Puna according to their relative position with respect to the Olacapato lineament. This lineament corresponds to a regional megafracture on a WNW-ESE course that crosses other geological provinces of the Andean axis. The observed geological differentiation in the upper crust is a response to the deep segmentation of the subducted Nazca plate which would condition a different metallogenic development. The southern Puna is considered the plateau region associated with the volcanic arc developed between 24" and 27" S and the Northern Puna to the region between 24" and 22" S.
The volcanic arc limits the Puna hydrological basin to the west while the Eastern Cordillera limits this basin to the east. Towards the Puna Austral (Southern Puna), a combination of east-west striking volcanic chains with uplifted blocks caused by north-south striking reverse faults limit numerous hydrological sub-basins, with numerous and extensive salt flats covering their bases, frequently surrounded by important alluvial systems. Thick sections of Neogene strata (up to 5 km) are present within depositional basins, which contain evaporites (mainly halite, gypsum, and borates) and alluvial clastic material with smaller tuff horizons. Exposed Neogene strata is present along the margins of the salars due to reverse faulting or as intra-basin uplift within the salt flats.
Stratigraphy
The units that outcrop in the region correspond only to rocks of Ordovician and Cenozoic age. The Ordovician outcrops are represented by leptometamorphic shales and greywackes, green to grey, strongly folded and fractured that make up the Cordón de Copalayo, on the western flank of the depression, as well as its basement. Additionally, Ordovician plutonites and metamorphites assigned to the Oire Eruptive Complex are found in a conspicuous northern prolongation of the Oire ridge and on the eastern edge of the depression.
In strong angular unconformity and with an inclination towards the east, a thick sequence of tertiary continental sedimentary rocks developed which outcrop across the width of the basin (17 km), although in many cases without continuity. Based on chromatic and lithological differences, these tertiary sedimentary rocks can be subdivided into Fm Geste, Fm. Pozuelos and Fm. Sijes, components of what are called the Pastos Grandes Group. Alonso and Gutierrez (1986) identified the Fm. Singuel and separated it from the top originally assigned to the Fm. Sijes of this thick sequence of sparsely consolidated conglomerates with increasing gradation.
Structures
The dominant structures in the Puna trending N-S to NNE-SSW are generally compressional or transgressive in nature formed mainly during the Neogene. Other structures are lineaments of regional magnitude, transversal to the Andean strike with a northeast and northwest direction along with displacements that occur in the strike direction and changes in the orientation of the Neogene folds and faults as well aligned volcanic flows of Cretaceous, Miocene-Pliocene and Quaternary ages. Some of the transversal lineaments have a well-documented pre-Cenozoic history, such as the Calama-El Toro- Olacapato lineament. South of this lineament, the deepest levels of the crust are exposed in both the Puna and Calchaquenia suggesting that the pre-Neogene deformation was dominated by vertical movements, descending towards the north. In addition, immediately north of the lineament, the western edge of the Cretaceous rift basin undergoes a marked westward displacement.
44
Local Geology
Based on the lithological descriptions of the drill core and cuttings together with the interpretation of the available geophysical information and field observations five major geological units were defined and correlated, these units were incorporated into a 3-D geological model of the Pastos Grandes sub-basin. The geological units are described hereafter:
Fluvial/Alluvial Unit
The Fluvial/Alluvial Unit is characterized by a heterogeneous sequence of alluvial and fluvial sediments of variable texture, dominated by clastic sediments formed by gravel and sand that surround the Salar de Pastos Grandes. These fractions may present low proportions of fine sediments (sands or clays) which develop mainly along the northern and southern edges of the Salar de Pastos Grandes, prograding in depth towards the center, to interdigitate with finer silt sediments formed by clay and sandy clays from the Central Clastics Unit.
Upper Clay Unit (Blanca Lila Formation)
Formed by a superficial sequence of clays with a wide distribution in the center-south of the basin, as well as in the western margins where, according to field observations, it occurs in outcrop. This clay dominated unit intercalates with layers of evaporites, halites and borates, while in the bibliography travertine and tuff horizons were also described.
Saline/Lacustrine Unit
Immediately below the Blanca Lila Fm and in the north-central sector from the surface, a thick halite sequence is recognized. This Unit is characterized by a massive and compact halite body with the presence of interstitial clastic material and occasional intercalations of finer levels of clay. The average thickness of this Unit is ranges between 200 m and 300 m, reaching maximum thicknesses of 700 m in the central- eastern sector of the basin, which is interpreted as an ancient depocenter.
Central Clastic Unit
This Unit consists of clay and clayey sands and occurs within the central sector of the basin underneath the halite deposits. This Unit is poorly characterized due to limited and low-quality borehole information, but seems to represent a distal sector of an alluvial fan and its interaction with marginal lacustrine deposits of the Salar de Pastos Grandes. Additional core drilling is planned to improve the hydrogeological characterization of this Unit.
Base Breccia/Gravels Unit
Based on Millennial Lithium's lithological description, a sedimentary breccia unit of coarse fragments of silicified conglomerate and ignimbrites was recognized in borehole PGMW19-21. This Unit corresponds to intermixed levels of sand and gravel with a thickness of 200 m on the western edge of the basin and deepening towards the north-central limit of the model where due to limited information its thickness becomes uncertain.
Mineralization
The brines from Pastos Grandes are solutions saturated in sodium chloride with an average concentration of TDS of 302 g/L and an average density of 1.19 g/cm3. The other components present in the Pastos Grandes brine are K, Li, Mg, SO4, Cl and B with relatively low Ca. The brine can be classified as a sulphate-chloride type with anomalous lithium. Lithium concentrations in Salar de Pastos Grandes have an average value of 392 mg/L, with some samples reaching up to 700 mg/L.
45
The table below shows a breakdown of the principal chemical constituents in the Pastos Grandes brine including maximum, average, and minimum values, based on 605 primary brine samples collected between 2017 and 2022.
Maximum, average and minimum elemental concentrations of the Pastos Grandes brine
| B | Ca | Cl | Li | Mg | K | Na | SO4 | Density | |
| Units | mg/L | mg/L | mg/L | mg/L | mg/L | mg/L | mg/L | mg/L | g/cm3 |
| Maximum |
938.00 |
1,707 | 196,869 | 701.00 | 5,130 | 6,660 | 130,032 | 13,998 | 1.22 |
| Average | 557.62 | 821 | 169,838 | 391.76 | 2,257 | 3,733 | 102,381 | 7,547 | 1.19 |
| Minimum | 20.20 | 11.00 | 116,00 | 8,75 | 23,20 | 18,00 | 196,00 | 12.00 | 1,00 |
Brine quality is evaluated through the relationship of the elements of commercial interest, such as lithium and potassium, with those components that constitute impurities, such as Mg, Ca and SO4.
The calculated ratios for the averaged chemical composition are presented in the table below.
Average values (g/L) of key components and ratios for the Pastos Grandes brine
| K | Li | Mg | Ca | SO4 | B | Mg/Li | K/Li |
| 3,730 | 390 | 2,260 | 820 | 7,550 | 560 | 5.76 | 9.53 |
Hydrogeology
Salar de Pastos Grandes is a mature salt flat with a well-developed halite crust. In the central portion of the salar, the crust can reach a thickness of several hundred meters with a thin clay layer that is constantly being generated through evaporation in the shallower beds. The Salar de Pastos Grandes is the lowest topographic point in the Pastos Grandes basin. The salt flat itself is surrounded by alluvial fans which drain into the Salar de Pastos Grandes and tertiary rocks that may act as impermeable boundaries, although further hydrogeological characterization work of the Tertiary is recommended. The surface of the Salar de Pastos Grandes in the north is composed of mainly chloride facies (halite crust) with active evaporation occurring since the brine level occurs within 5 cm from the surface. The Salar de Pastos Grandes surface in the south is covered by the Blanca Lila Fm with an average thickness of 3 m. Depth to brine in the southern part of the Salar de Pastos Grandes is between 3 m and to 4 m, below the evaporation extinction depth that is estimated around 2.5 m.
Based on the interpretation of drilling and testing work in the basin, four hydrogeological units have been identified and are described below:
1. UH-1 Fine Grained Shallow Deposits: These sediments belong to the Blanca Lila formation and are in conformity with the underlying Saline Lacustrine Unit, reaching a maximum thickness of 30 m in the northeast of the Salar de Pastos Grandes. Because of the fine texture, permeability and storage properties for this Unit are estimated to be low with a hydraulic conductivity (K) ranging between 0.1 - 0.01 m/d, a specific storage (Ss) of 1x10⁻⁶ 1/m and drainable porosity below 2%. Geophysics and field sampling suggests that this Unit is saturated with brine inside the Salar de Pastos Grandes and with brackish water around the margins.
46
2. UH-2 Evaporitic Deposits: Massive evaporitic unit intercalated with lenses of fine-grained sediments that can have a thickness up to 700 m. This relatively homogeneous Unit includes the saline lacustrine material that forms the surface of the salar nucleus and is overlain by the Blanca Lila Fm (UH-1) in the south. Based on drilling and testing results this Unit has a relatively low permeability and could limit hydraulic connectivity between the upper and deeper hydrogeological units in the basin. The hydraulic conductivity of this Unit is estimated to be lower than 0.01 m/d, the specific storage is estimated to be near 10-6 1/m and the specific yield could reach 4%. Geophysics and field sampling suggests that this Unit is saturated with brine.
3. UH-3 Alluvial and Colluvial Deposits: This hydrogeological unit includes the alluvial fans identified at the margins of the Salar de Pastos Grandes which are composed of unconsolidated gravels and sand. This Unit overlies and is in lateral contact with UH-2 and locally interfingers with UH-4. The hydraulic conductivity ranges between 30 m/d and 50 m/d. The average drainable porosity is 14%. Groundwater flow in the Alluvial and Colluvial Deposits is generally unconfined; however, locally semi-confined to confined flow conditions occur where this unit is overlain by UH-1 and UH-2. The unit hosts freshwater resources in the alluvial fans on higher ground above the margin of the Salar de Pastos Grandes and significant brine resources in the southern portion of the salar where it is partially overlain by UH-1.
4. UH-4 Lower Deposits: Overlaying basement rock, this hydrogeological unit includes the Central Clastics and Base Gravels. It is composed of sandy gravels with a high fraction of fine material in a sedimentary matrix and some clayey to silty lenses that decrease the bulk vertical hydraulic conductivity. This unit is constrained to the central portion of the basin, underlies UH-2, and is in lateral contact with the unconsolidated deposits of UH-3. The hydraulic conductivity of this unit is estimated to range between 0.1 - 1 m/d, the specific storage at 10-6 1/m, and the drainable porosity near 8%. This unit forms part of the confined lower brine aquifer from which future brine production will likely not affect the freshwater resources hosted in the alluvial system due to the overlying low-permeability halite unit.
Exploration
Various exploration programs were completed in Salar de Pastos Grandes between 2011 and 2021 by various owners prior to the Company.
Surface brine sampling
In 2011, Eramet took a total of nine samples from shallow hand-dug auger holes within the eastern section of the Salar de Pastos Grandes and the wetlands. Three brine samples toward the west of the Salar de Pastos Grandes had lithium concentrations near 600 mg/L and potassium concentrations near 7,000 mg/L while samples at the centre of the Salar de Pastos Grandes had lithium and potassium concentrations near 200 and 2,000 mg/L, respectively. LSC completed a second surface sampling program in 2016 which included 11 sampling sites (shallow brine bodies and hand dug pits) with similar results as Eramet in 2011.
Geophysical studies
Eramet (2011-2013)
47
Eramine carried out a TEM, VES, and CSAMT surveys in Salar de Pastos Grandes between 2011 and 2013. No information is available for the TEM survey. The objectives of these surveys were to map the occurrence of brine versus freshwater, and the distribution and relative continuity of lithological units.
Millennial exploration (2017 - 2019)
VES survey (2017)
Millennial Lithium conducted a VES survey in 2017 focused on the alluvial deposits in the northern portions of the Salar de Pastos Grandes. This study included 10 VES stations which were interpreted into 3 vertical sections to map the saline interphase, identify potential brine resources in the north, and help define new exploration drilling sites.
Seismic survey (2018 - 2019)
Millennial Lithium carried out a two-phase seismic investigation program during 2018-2019 to help refine the understanding of the lithology in the Salar de Pastos Grandes and help define new exploration targets. The seismic tomography survey provided valuable information on the vertical distinction and lateral continuity of lithological layers. Additionally, several structures were interpreted, especially in the north to south profile, suggesting north to northwest dipping beds.
Downhole temperature and electrical conductivity surveys
Down-hole electrical conductivity profiling was conducted in boreholes PGMW16-02, PGMW17-04b, PGMW17-05c, PGMW17-07d, and PGMW17-11 which were completed with 2-inch diameter PVC casing on completion of drilling. Temperature and electrical conductivity were recorded at 3 m intervals using an In-Situ brand Aquatroll 100 downhole probe and brine samples were taken to measure laboratory density.
The results showed a reasonably good correlation between the Aquatroll specific conductivity and the laboratory density measurements on the depth-specific samples.
LSC exploration (2017 - 2018)
VES survey (2017b)
LSC Lithium carried out a VES study in 2017 to map lithology and the freshwater/ brine interface. The survey consisted of 13 soundings. The results of this survey identified five geoelectrical units: 1) conductive gravels and sands; 2) a semi-conductive fine grained unit (silt and clays and/or halite gypsum and borates), probably related to the Blanca Lila Fm; 3) a highly conductive zone of evaporates and mixed halite/clastics saturated with brine; 4) a more resistive layer representing again the Blanca Lila Fm or other Tertiary sequences and; 5) a resistive zone interpreted as the hydrogeological basement composed of thick clastic facies (conglomerates) and/or facies of volcanic rocks (andesites).
Seismic survey (2018)
LSC undertook a seismic tomography survey consisting of six lines for a total of 15 km. The interpretation of the results of this survey was based on a combination of literature values, regional geological information and specific correlation to boreholes SPG-2017-02B and SPG-2017-04A and is summarized below.
To the west of the Salar de Pastos Grandes seven seismic units were identified without structure to a depth of 600 m: 1) dry alluvial deposits; 2) halite crust; 3) saturated sand, clay and/or organic material; 4) crystalline halite; 5) saturated sand, clay and/or organic material; 6) gravels and 7) breccia.
To the center and east of the Salar de Pastos Grandes 11 seismic units were identified without structure to a depth of 600 m, from top to bottom: 1) dry to partially saturated sediments and alluvial material (saturated sand, clay and/or organic material); 2) halite crust; 3) saturated sand, clay and/or organic material; 4) halite with scarce matrix; 5) halite with abundant matrix; 6) halite with scarce matrix; 7) sand; 8) alternation of halite and sand bands; 9) gravel, sand and/or clay; 10) halite with interbedded sand; 11) gravel and/or sand.
Centaur/Arena Minerals exploration (2018 - 2022)
TEM survey (2018)
48
Centaur conducted several TEM surveys to evaluate the presence of brine beyond the margins of the Salar de Pastos Grandes in the Corral Colorado river valley, the Sijes subbasin, and in the southern portion of the salar. The TEM lines in the north and east confirmed the existence of a deeper conductive anomaly associated with brine and the overlaying freshwater hosted in the alluvial sediments. The southern lines over the Blanca Lila Fm showed a conductive unit close to the surface interpreted as the halite unit saturated with brine, based on drilling.
Passive seismic survey (2019)
A passive seismic survey was conducted by Centaur in 2019 to map basement and confirm interpreted fractures to the south and east of the Salar de Pastos Grandes. This study consisted of 78 stations arranged in 10 east-west orientated lines (see figure directly above). The survey did not consistently identify basement rocks due to depth and the poor seismic contrast between the massive halite body and basement rocks.
TEM survey (2022a)
Arena Minerals carried out a TEM survey during 2022 along the eastern boundary of the Salar de Pastos Grandes to refine the delineation of the overburden and hydrogeological basement, and to further investigate the freshwater/brine interface in this portion of the Salar de Pastos Grandes based on Centaur's 2018 survey. The survey helped identify the limit between the unconsolidated sediments and basement rock. These results and interpretations were correlated to lithological information of boreholes DD-01, DD-02 and DD-03.
Company exploration (2022)
ERT survey (2022 b)
The Company conducted an ERT survey to refine the delineation of freshwater resources suitable for industrial water supply in the alluvial deposits in the north-eastern portion of the Pastos Grandes Project. The survey consisted of 12 lines with a vertical maximum resolution of 160 m - 200 m.
Three geoelectrical units were identified 1) fine grained sediments with abundant interstitial clay and saturated with brine of high electrical conductivity; 2) fine to coarse grained sediments saturated with water; and 3) medium to coarse grained sediments partially or not saturated.
Drilling
Three drilling campaigns have been carried out since 2011. Eramet conducted the first exploration program in 2011 including 11 shallow exploration boreholes (SW series), two diamond drill holes (DW01PGDDH and DW02PGDDH), four shallow exploration holes completed with 6-inch diameter casing (PMP series), and three exploration wells of varying depths completed with 6-inch diameter casing (DW03PG, DW04PG, DW05PG). Detailed information of these boreholes has not been published and is mostly unavailable, although maximum depths reached at this stage rarely exceeded 100 m. The second and third campaign conducted by Millennial Lithium included 32 brine exploration boreholes (PGMW16-01 through PGMW19-22), 6 freshwater exploration wells (PGWW18-01 to PGWW19-06) and 4 brine production wells (PGPW16-01 to PGPW18-17) with drilling depths of up to 600 m. Most of the monitoring wells were completed as piezometers with 2-inch diameter PVC slotted casing, while production wells were constructed with 6 to 8- inch diameter screened casing.
Arena Minerals and Centaur carried out drilling programs on the Sal de la Puna project in between 2018 and 2022. These programs consisted of two diamond core holes (DD-01 and DD-02), five combination core /rotary holes (PP-01-2018, PP-02-2018 and R-01 through R-03), two production wells (PP-03-2019 and PW-1), and several piezometer installations.
The objectives of the drilling program can be broken down into three general categories:
1. Exploration drilling to allow the estimation of "in-situ" brine resources: The drilling methods were selected to allow for 1) the collection of continuous cores to prepare "undisturbed" samples from specified depth intervals for laboratory porosity analyses and 2) the collection of depth- representative brine samples at specified intervals.
49
2. Test well installations: 8 rotary holes (PGPW16-01 to PGPW18-17; PGWW18-01 to PGWW19- 03, and PW-1) which were drilled and completed as production wells to carry out pumping tests and additional selective brine sampling. Monitoring wells were installed adjacent to most of these production wells for use during the pumping tests as observation points.
3. Pumping tests: Eight pumping tests have been completed in the Salar of Pastos Grandes. These tests included three short-term tests (PGWW18-02, PGWW19-02 and PGWW19-03), each lasting about one day and conducted on freshwater wells; three three-day tests conducted on brine wells (PGPW16-01, PGPW18-15 and PGPW18-17); and two long-term pumping tests (PGPW16-01 and PGPW17-04) with 23- and 30-day duration.
The table below provides summary information of the completed boreholes from 2016-2022.
Summary boreholes information
| Borehole | East (m) | North (m) | Elevation (masl) |
TD (m) | Method | Year | Completion | |
| Diameter (inches) |
Screened interval (m) |
|||||||
| PGMW16-01 | 3,429,218 | 7,283,662 | 3,775.60 | 190 | DDH | 2016 | 2" | 8.6-91.7 |
| PGMW16-01b | 3,429,221 | 7,283,655 | 3,775.60 | 355 | MR | 2016 | 2" | 0-283.6 |
| PGMW16-02 | 3,427,731 | 7,283,257 | 3,785 | 400 | DDH/MR | 2016 | 2" | 8.5-386.9 |
| PGMW17-03 | 3,428,367 | 7,283,805 | 3,773.6 | 154 | DDH | 2017 | - | - |
| PGMW17-04 | 3,427,853 | 7,280,921 | 3,789.80 | 245,5 | DDH | 2017 | - | - |
| PGMW17-04b | 3,427,849 | 7,280,949 | 3,786.90 | 564 | DDH/MR | 2017 | 2" | 4.2-206.0 |
| 211.6-389.4 | ||||||||
| 395.0-519.5 | ||||||||
| PGMW17-05 | 3,428,922 | 7,281,677 | 3,773.9 | 121 | DDH | 2017 | - | - |
| PGMW17-05b | 3,428,927 | 7,281,683 | 3,773.9 | 387 | DDH | 2017 | - | - |
| PGMW17-05c | 3,428,918 | 7,281,672 | 3,773.9 | 601 | MR | 2017 | 2" | 14.2-180.6 |
| 186.6-371 | ||||||||
| PGMW17-06 | 3,429,497 | 7,281,016 | 3,785 | 455 | DDH/MR | 2017 | - | - |
| PGMW17-06b | 3,429,497 | 7,281,016 | 3,785 | 424 | MR | 2017 | - | - |
| PGMW17-06c | 3,429,497 | 7,281,016 | 3,785 | 571 | MR | 2017 | - | - |
| PGMW17-07 | 3,426,888 | 7,282,228 | 3,763.1 | 203,3 | DDH | 2017 | - | - |
50
| Borehole | East (m) | North (m) | Elevation (masl) |
TD (m) | Method | Year | Completion | |
| Diameter (inches) |
Screened interval (m) |
|||||||
| PGMW17-07b | 3,426,888 | 7,282,228 | 3,763.1 | 203,3 | MR | 2017 | - | - |
| PGMW17-07c | 3,426,888 | 7,282,228 | 3,763.1 | 412 | DDH/MR | 2017 | - | - |
| PGMW17-07d | 3,426,901 | 7,282,217 | 3,763.1 | 510 | MR | 2017 | 2" | 12-17.95 |
| 29.70-249.88 | ||||||||
| 261.64-499.73 | ||||||||
| PGMW17-08 | 3,429,941 | 7,281,596 | 3,785 | 425,5 | DDH | 2017 | - | - |
| PGMW17-08b | 3,429,941 | 7,281,596 | 3,785 | 446 | MR | 2017 | - | - |
| PGMW17-09 | 3,428,156 | 7,283,107 | 3,785 | 595 | DDH/MR | 2017 | 2" | 11.7-198.8 |
| 204.7-397.3 | ||||||||
| 403.3-583.0 | ||||||||
| PGMW17-10 | 3,429,822 | 7,283,569 | 3,773.7 | 601 | DDH/MR | 2017 | - | - |
| PGMW17-11 | 3,429,826 | 7,285,591 | 3,817.60 | 568 | MR | 2017 | 2" | 278.95-546.66 |
| PGMW18-12 | 3,428,224 | 7,280,087 | 3,787.70 | 554 | MR | 2018 | 2" | 71.61-543.61 |
| PGMW18-13 | 3,428,223 | 7,278,696 | 3,795.30 | 559 | DDH/MR | 2018 | 2" | 82.49-314.85 |
| 320.81-553.16 | ||||||||
| PGMW18-14 | 3,428,234 | 7,277,357 | 3,797.10 | 635 | MR | 2018 | 2" | 70.79-313.69 |
| 319.66-628.57 | ||||||||
| PGMW18-15 | 3,426,687 | 7,278,678 | 3,792.70 | 594 | MR | 2018 | 2" | 74.23-321.96 |
| 327.85-587.38 | ||||||||
| PGMW18-16 | 3,429,618 | 7,279,568 | 3,790.40 | 641 | MR | 2018 | 2" | 73.19-321.38 |
| 327.28-629.08 | ||||||||
51
| Borehole | East (m) | North (m) | Elevation (masl) |
TD (m) | Method | Year | Completion | |
| Diameter (inches) |
Screened interval (m) |
|||||||
| PGMW18-17 | 3,426,685 | 7,280,094 | 3,767.50 | 605 | MR | 2018 | 2" | 17.63-129.24 |
| 135.21-170.61 | ||||||||
| 200.43-306.32 | ||||||||
| 312.28-595.05 | ||||||||
| PGMW18-18 | 3,426,656 | 7,277,421 | 3,798.70 | 605 | MR | 2018 | 2" | 8.35-273.46 |
| PGMW18-19 | 3,429,083 | 7,280,529 | 3,787.70 | 602 | MR | 2018 | - | |
| PGMW18-20b | 3,430,661 | 7,279,511 | 3,777.30 | 575 | MR | 2018 | 2" | 0.40-64.79 |
| 111.99-336.11 | ||||||||
| PGMW19-21 | 3,426,079 | 7,279,867 | 3,784.50 | 574,3 | DDH/MR | 2019 | 2" | 26.15-285.16 |
| 291.01-567.71 | ||||||||
| PGMW19-22 | 3,431,009 | 7,288,304 | 3,832.50 | 464,5 | DDH/MR | 2019 | 2" | 37.8-363 |
| PGPW16-01 | 3,429,204 | 7,283,655 | 3,775.60 | 351 | MR | 2016 | 6" | 20-351 |
| PGPW17-04 | 3,427,842 | 7,280,941 | 3,788.50 | 475 | MR | 2017 | 6" | 113.37-464.31 |
| PGPW18-15 | 3,426,687 | 7,278,707 | 3,792.70 | 610 | MR | 2018 | 6" | 76.88-592.8 |
| PGPW18-17 | 3,426,666 | 7,280,153 | 3,767.50 | 606 | MR | 2018 | 8" | 50.43-594.4 |
| PGWW18-01 | 3,428,857 | 7,286,244 | 3,781.20 | 42 | MR | 2018 | 6" | 4-34 |
| PGWW19-02 | 3,431,200 | 7,288,950 | 3,874.70 | 62 | MR | 2019 | 6" | 29.53 |
| PGWW19-03 | 3,431,279 | 7,287,953 | 3,821.70 | 62 | MR | 2019 | 6" | 17-53 |
| PGWW19-04 | 3,431,032 | 7,288,305 | 3,831.50 | 62 | MR | 2019 | - | - |
| PGWW19-05 | 3,430,916 | 7,287,889 | 3,844 | 62 | MR | 2019 | - | - |
| PGWW19-06 | 3,430,545 | 7,288,054 | 3,842.50 | 62 | MR | 2019 | - | - |
| PP-01-2018 | 3,427,028 | 7,275,405 | 3,805,70 | 611 | MR | 2019 | 2" | No data |
| PP-02-2019 | 3,427,171 | 7,273,819 | 3,772,50 | 650 | MR | 2019 | 2" | No data |
52
| Borehole | East (m) | North (m) | Elevation (masl) |
TD (m) | Method | Year | Completion | |
| Diameter (inches) |
Screened interval (m) |
|||||||
| PP-03-2019 | 3,428,251 | 7,276,673 | 3,803,2 | 542 | MR | 2019 | 10"-212-8" | No data |
| DD-01 | 3,429,329 | 7,278,639 | 3,793,5 | 700 | DDH | 2022 | 2" | 6m every 12m |
| DD-02 | 3,427,651 | 7,275,815 | 3,802,50 | 646 | DDH | 2022 | 2" | 380-440 |
| R-01 | 3,434,507 | 7,279,732 | 3,794,70 | 601 | MR | 2022 | 2" | 497-515 |
| R-02 | 3,435,359 | 7,283,016 | 3,813 | 411 | DDH/MR | 2022 | 2" | 6m every 12m |
| R-03 | 3,435,050 | 7,288,856 | 3,836 | 617 | MR | 2022 | 2" | 18m every 18m |
| PW-01 | 3,427,651 | 7,275,815 | 3,802,50 | 503 | MR | 2022 | 10"-200-8" | 350-500 |
Hydraulic Testing
Millennial Lithium completed eight pumping tests between 2017 and 2019. These tests included three one-day tests on the freshwater wells; three three-day tests on brine wells; and two long-term pumping tests (23- and 30- day duration) also on brine wells.
Brine Well Pumping Tests
PGPW 16-01 (2017)
A 3-day pumping test was carried out on well PGPW16-01 at an average pumping rate of 27.7 L/s. The configuration of the test and its results are shown in the table immediately below. The production well is screened across the saline halite unit and the underlying brine aquifer. This test included four observation wells but only SW03PG-1 (without completion information) reacted to pumping. Drawdown and recovery data were interpreted, respectively with Cooper & Jacob (1946) and Theis (1935) recovery solutions leading to a hydraulic conductivity (K) estimate of about 3 m/d.
Summary of pumping test PGPW16-01 (2017)
| PGPW16-01 (2017) | |||||||||
| Well |
Type |
Q (L/s) |
Duration (days) |
Lithology |
Minimum saturated thickness (m) |
Maximum drawdown (m) |
Fit |
T (m2/d) |
K (m/d) |
| PGPW16-01 | P | 27.7 | 3 | Mixed halite, sand, silt | 224 | 9.04 | C&J | 1.100 | 4.91 |
| Theis Rec. | 500 | 2.23 | |||||||
| SW03PG-1 | O | Mixed halite, sand, silt | #N/D | 1.19 | C&J | 1.100 | #N/D | ||
| Theis Rec. | 1 | #N/D | |||||||
PGPW 17-04
53
A 23-day pumping test was completed on PGPW17-04 at a pumping rate of 15.23 L/s in 2019. The production well is screened across halite, sand, and silt; because of the low permeability of the halite it is believed that the drawdown response is mainly related to the unconsolidated clastic sediments beneath it. Drawdown data during the pumping stage was discarded due to an apparent non-related water level recovery observed during test. Therefore, only recovery data were adjusted to the Theis (1935) recovery solution, leading to a transmissivity estimate of 40 m2/d, or a hydraulic conductivity 0.12 m/d assuming a saturated thickness of 329 m. The configuration of the test and its results are shown in the table immediately below.
Summary of pumping test PGPW17-04
| PGPW17-04 | |||||||||
| Well |
Type |
Q (L/s) |
Duration (days) |
Lithology |
Minimum saturated thickness (m) |
Maximum drawdown (m) |
Fit |
T (m2/d) |
K (m/d) |
| PGPW17-04 | P | 15.23 | 23 | Mixed halite, sand, silt | 329 | 57.11 | Theis Rec. | 40 | 0.12 |
PGPW 18-15
A pumping test (variable and constant rate, and recovery) was carried out in PGPW18-15 during April of 2019. The well was screened in the same lithological unit as PGPW-17-04. The configuration of this test and its results are shown in the table immediately below. Water levels during the test were also monitored in PGMW18-15. The hydraulic conductivity was estimated to range between 0.15 - 0.22 m/d.
Summary of pumping test PGPW18-15
| PGPW18-15 | |||||||||
| Well |
Type |
Q (L/s) |
Duration (days) |
Lithology |
Minimum saturated thickness (m) |
Maximum drawdown (m) |
Fit |
T (m2/d) |
K (m/d) |
| PGPW18-15 | P | 24.1 | 3 | Mixed halite, sand, silt | 456 | 38.7 | C&J | 90 | 0.2 |
| Theis Rec. | 70 | 0.15 | |||||||
| PGMW18-15 | O | Mixed halite, sand, silt | 453 | 6.5 | Theis | 100 | 0.22 | ||
PGPW 18-17
A three-day pumping test was conducted on well PGPW18-17 well with an average pumping rate of 19.4 L/s. The configuration of the test and its results are shown in the table immediately below. Drawdown data was measured only in the pumping well and was adjusted to the Cooper and Jacob (1946) and Theis (1935) recovery solutions. The estimated hydraulic conductivity ranges between 0.17 - 0.22 m/d, which is consistent with previous results for the same lithologies in the Salar de Pastos Grandes.
Summary of pumping test PGPW18-17
54
| PGPW18-17 | |||||||||
| Well |
Type |
Q (L/s) |
Duration (days) |
Lithology |
Minimum saturated thickness (m) |
Maximum drawdown (m) |
Fit |
T (m2/d) |
K (m/d) |
| PGPW18-17 | P | 19.4 | 3 | Mixed halite, sand, silt | 589 | 30.31 | C&J | 130 | 0.22 |
| Theis Rec. | 100 | 0.17 | |||||||
PGPW 16-01 (2019)
A 15-day pumping test was conducted on well PGPW16-01 at an average pumping rate of 23.2 L/s during May 2019. The results of this 2019 test are summarized in the table immediately below and are quite similar to the results of the 2017 test. Drawdown and recovery data were interpreted with the Theis (1935) recovery solution, leading to a hydraulic conductivity estimate of about 2 m/d.
Summary of pumping test PGPW16-01 (2019)
| PGPW16-01 (2019) | |||||||||
| Well |
Type |
Q (L/s) |
Duration (days) |
Lithology |
Minimum saturated thickness (m) |
Maximum drawdown (m) |
Fit |
T (m2/d) |
K (m/d) |
| PGPW16-01 | P | 23.2 | 15 | Mixed halite, sand, silt | 224 | 15.15 | Theis Rec. | 400 | 1.79 |
Pumping Tests Conducted in Freshwater Wells
PGWW18-01
A variable rate and a 1-day constant rate tests with an average flow rate of 0.85 L/s was carried out on well PGWW18-01 in May 2019. No hydraulic parameters could be obtained from this test because of the short test duration and the low pumping rate as shown in the table immediately below.
Summary of pumping test PGWW18-01
| PGWW18-01 | |||||||||
| Well |
Type |
Q (L/s) |
Duration (days) |
Target lithology |
Minimum saturated thickness (m) |
Maximum drawdown (m) |
Adjust |
T (m2/d) |
K (m/d) |
| PGWW18-01 | P | 0.85 | 1 | Gravels and sands | 10.96 | 5.13 | - | - | - |
PGWW 19-02
Well PGWW19-02 was pump tested in 2019 (a variable rate, a constant rate and a recovery). The layout of this test and results are shown in the table immediately below. Drawdown and recovery trends were adjusted with the Cooper and Jacob (1946) and Theis (1935) recovery solutions, respectively. Estimated hydraulic conductivity values ranged from 20 to 60 m/d which is considered reasonable for these types of coarse-grained unconsolidated sediments. The pumping test configuration didn't include observation wells; therefore, no storage estimates could be obtained.
55
Summary of pumping test PGWW19-02
| PGWW19-02 | |||||||||
| Well |
Type |
Q (L/s) |
Duration (days) |
Lithology |
Minimum saturated thickness (m) |
Maximum drawdown (m) |
Fit |
T (m2/d) |
K (m/d) |
| PGWW19-02 | P | 24 | 0.8 | Gravels and sands | 15.5 | 5.32 | C&J | 1.6 | 66.67 |
| Theis Rec. | 500 | 20.83 | |||||||
PGWW 19-03
A variable rate, constant rate test and recovery test were carried out on Well PGWW19-03. The layout of this test and main results are shown in the table immediately below. Drawdown and recovery trends were adjusted with the Cooper and Jacob (1946) and Theis (1935) recovery solutions, respectively. Estimated hydraulic conductivity ranges from 6 to 11 m/d, which is reasonable for this type of coarse-grained unconsolidated sediments with a higher fine fraction. The pumping test configuration didn't include any observation wells; therefore, no storage estimates could be obtained from this test.
Summary of pumping test PGWW19-03
| PGWW19-03 | |||||||||
| Well |
Type |
Q (L/s) |
Duration (days) | Lithology |
Minimum saturated thickness (m) |
Maximum drawdown (m) |
Fit |
T (m2/d) |
K (m/d) |
| PGWW19-03 | P | 3.41 | 1 | Gravels and sands | 36 | 3.46 | C&J | 250 | 6.94 |
| Theis Rec. | 400 | 11.11 | |||||||
Sampling, Analysis and Data Verification
Millennial Lithium drainable porosity analysis (2016-2019)
Samples were obtained from 'undisturbed' core during the 2016-2019 Millennial Lithium drilling programs and analysed for drainable porosity by Core Laboratories-Petroleum Services ("Corelabs") in Houston, Texas. In addition, rotary drill cuttings were sent to Geosystems Analysis ("GSA") in Tucson, Arizona for repacking, triaxial testing, and drainable porosity analysis. Both Corelabs and GSA are independent laboratories and have no relationship with the Company.
Both Corelabs and GSA offer advanced petrophysical and geological analysis and interpretation services for core samples. These laboratories operate in compliance with ISO 9001:2008 Certification ensuring that processes and procedures adhere to internationally recognized quality standards. The analytical procedures for determining drainable porosity for each laboratory are further described below.
Corelabs drainable porosity analysis are based on centrifuge methodology and involve the following:
56
1. 38 mm (1.5-inch) diameter cylindrical plugs were cut from the sample material.
2. Samples were frozen with dry ice to maintain their integrity, if required.
3. Sample weight and thickness were measured.
4. The plugs were encapsulated in Teflon and nickel foil as required, and nickel screens were placed on the ends of the plugs. The encapsulated samples were then weighed.
5. Bulk density was calculated as: (Mass of plug before encapsulation) / (Calliper bulk volume).
6. The plugs were placed in brine and saturated under vacuum to ensure full saturation. Corelabs utilized a standard sodium chloride brine with a NaCl concentration of 244,000 ppm with a density of 1.184 gm/cm3.
7. The weight of the saturated cores was recorded.
8. The samples were desaturated in a high-speed centrifuge for 4 hours. Spin rates were calculated to provide a drainage pressure of 1 pound per square inch (psi) for poorly cemented or loose sands and 5 psi for clay and halite.
9. The drainage was collected, and the volume was recorded. The effluent was saved for possible analysis. However, it should be noted that the fluid collected from these cores may not be representative of in situ brines if re-saturation with NaCl was required.
10. Plugs were removed from the centrifuge and weight was recorded. Drained fluid volume was calculated as: (saturated plug weight - drained plug weight) /1.184. Drainable porosity was calculated as (Drained fluid volume) / (Calliper bulk volume).
11. Total porosity was calculated after drying the samples for 5 days at 115.6 degrees Celsius to record dry weight.
12. All weight loss is assumed to be water lost from pore space where volume of water loss is calculated as: ((Drained plug weight) - (Oven-dried plug weight))/ (Water density of 1 g/cc).
13. Total porosity is calculated as ((Drained fluid volume) + (Oven drying fluid loss))/ (Calliper bulk volume).
GSA drainable porosity analysis procedures for repacked sediment samples include the following steps:
1. All loose and sandy samples were packed into test cells with moderate effort without prior knowledge of bulk density or other consolidation tests. Additional repacking was performed on some samples with minimum and maximum effort to evaluate the effectiveness and variation of hand-packing at higher and lower densities. Bulk densities approximately 0.1 g/cm3 lower and higher than the initial density were achieved, respectively.
2. The sandy material was packed into a stainless-steel ring in several small lifts. The weight and packing height of the first lift were used to guide the subsequent lifts to ensure consistent density packing. Scales were used to track the equipment, cell, and sample weights throughout the process, and the final packed and assembled core weight was recorded.
3. Plastic air tubing, approximately 6 inches in length, was inserted into the top of each core to monitor saturation and prevent brine solution spillage. The cores were then assembled and saturated slowly from the bottom up using provided brine. A combination of gravity feed and vacuum suction was used to achieve the target saturation. If the target saturation could not be reached using gravity feed alone, vacuum suction was applied. The saturation process lasted for up to 24 hours. Once fully saturated, the cores were closed at the bottom with a hose clamp to prevent brine solution loss and disconnected from the saturation setup.
4. Each cell assembly underwent three pressure steps after being transferred to a test rack. The first step, at 0 mbar pressure, lasted for 24 hours and was applied to remove excess saturation solution. To approximate the release of brine solution at 120 mbar and 1/3 bar of the brine solution, two sequential pressure steps were used at 120 mbar and 1/3 bar, respectively. The 120-mbar pressure step was maintained for 2 days, and the 1/3 bar was continued for another 2 to 4 days. Weight measurements were taken twice a day to determine the loss of brine solution over time. After the final step the cores were disassembled and samples were oven dried to determine total porosity following the procedure described in MOSA, 2002, Part 4 Ch. 2, 2.3.2.1.
5. To estimate the brine solution release volumes at the 120 millibar and 1/3 bar pressure steps, the difference was calculated between the measured total porosity and the moisture retained after the pressure plate measurements as outlined in MOSA (2002), Part 4, Chapter 3, Section 3.3.3.5. The solution's release volume obtained at 1/3 bar was regarded as an approximation of the maximum solution drainage that could occur under gravity or pumping conditions, and hence was used to determine the specific yield.
57
After completing the tests, the estimated particle density and weight data from core samples at various pressure steps were entered into a spreadsheet. The spreadsheet was programmed to automatically calculate the salt weight left in the sample after drying, estimated porosity, and water content change. Furthermore, particle density was optimized during data processing by utilizing all prior test measurements and using a solver in Microsoft Excel. The laboratory report presented the calculated particle density for each sample.
Arena Minerals drainable porosity samples (2021-2022)
36 samples from the Arena Minerals 2021-2022 drilling program were sent to GSA for drainable porosity analysis. All samples were tested using the 'Rapid Brine Release' method to measure specific yield ("Sy") and total porosity ("Pt.") Brine release drainable porosity was measured at 120 mbar and 333 mbar of pressure, where:
● Brine release at 120 mbar represents drainable porosity from sand dominated sediments and Rapid Brine Release ("RBR") from macropores.
● Brine release at 333 mbar represents the Sy for intermediate to finer texture sediments.
Brine release values at 120 mbar were provided for reference and 333 mbar values were presented as the estimated Sy (drainable porosity). A subset of paired samples representative of the range in lithology types were selected by Atacama Water and GSA for testing using the Relative Brine Release Capacity ("RBRC") method by Daniel B. Stephens & Associates, Inc. ("DBSA") in Albuquerque, NM. The goals of the test work were to provide Sy and Pt values for each sample, summary statistics of Sy and Pt by lithological group, and to compare the Sy and Pt values derived for paired core samples using the RBR and RBRC methods.
The table immediately below lists the physical properties analyses carried out by GSA. In addition to the RBR testing, physical property tests were run by GSA to assist in lithologic characterization and interpretation of results including bulk density testing (ASTM D2937-17e2) on all RBR samples.
Summary of laboratory tests conducted by GSA
| Test Type | Sample Type and Number | Test Method | Testing Laboratory | Standard |
| Physical | 36 core samples | Bulk density | GSA Laboratory (Tucson, AZ) | ASTM D2937-17e2 |
| 36 core samples |
Estimated Particle Density |
GSA Laboratory (Tucson, AZ) | MOSA Part 4 Ch. 2, 2.2 |
|
| 5 core samples | RBRC | DBSA (Albuquerque, NM) | Stormont et. al., 2011 | |
| Hydraulic | 36 core samples | Estimated Total Porosity | GSA Laboratory (Tucson, AZ) | MOSA Part 4 Ch. 2, 2.3.2.1 |
| Estimated Field Water Capacity | MOSA Part 4 Ch. 3, 3.3.3.2 |
|||
| RBR | Modified ASTM D6836-16 | |||
| MOSA Part 4 Ch. 3, 3.3.3.5 |
58
Three packing methods were used to prepare RBR core samples:
1. Stainless steel rings were pushed into intact sediment cores to preserve the structure and retain the original bulk density and porosity distribution in the sample.
2. Sediment cores with loose sediment and/or disturbed samples were extruded, and voids were filled in using moderate packing effort to eliminate voids in the test samples.
3. Most solid halite and/or rock cores were cut with a rock saw to fit GSA's RBR test cells and then fit into a 6.35 cm diameter ring and sealed as discussed below.
RBR test cells were prepared by placing a pre-wetted micro-pore membrane (rated 1,200 mbar air entry value) into the bottom PVC cap. This membrane maintains a permeable saturated bottom boundary for solution flow and prevents air entry under the target air pressures applied during RBR testing. The PVC caps contain gaskets to create an air-tight test cell that maintains constant air pressure and allows continuous solution outflow through the membrane.
The RBR method is based on the moisture retention characteristic method using the Tempe cell design (Modified ASTM D6836-16), whereby Sy is determined by applying pressures equivalent to gravity drainage to the Test Cell and measuring the amount of brine solution released. Pt is also measured in the RBR method, and is equal to the sum of Sy and Sr.
Each saturated RBR test cell was transferred to a test rack for the pressure extraction procedure where no pressure was applied for one day to remove any excess brine solution due to core over-saturation. Two sequential pressure steps were used to approximate brine solution release at 120 mbar and 333 mbar of matric potential (MOSA Part 4 Ch. 3, 3.3.3.2).
The 120-mbar pressure step was maintained for at least two days, and the 333-mbar pressure step was continued for another two to four days. Core assemblies were weighed prior to saturation, after saturation, and then two times daily to determine brine solution loss over time.
All samples were oven dried for three days at 60°C and one day at 105°C after the final step to determine the specific retention ("Sr"), dry bulk density, and Pt (MOSA Part 4 Ch. 2, 2.3.2.1), where Sr is the volume of water retained by the sample under 333 mbar soil water potential. This drying approach allowed for quantification of the amount of moisture lost due to crystalline water present in gypsum.
Brine solution release volumes at the 120 mbar and at 333 mbar pressure steps were estimated by the weight of brine lost between the initial cell assembly mass and the mass after each pressure plate step divided by the brine specific gravity (Equation 2, MOSA Part 4 Ch3, 3.3.3.5):
|
𝑆𝑦 |
= |
𝑤𝑠 − 𝑤333 𝑚𝑏𝑎𝑟 |
|
𝐴 ∗ 𝐿 ∗ 𝐵𝑠𝑔 |
where 𝑤𝑠 is the saturated weight, 𝑤333 𝑚𝑏𝑎𝑟 is the weight at 333 mbar, A is the sample core area, L is sample length, and Bsg is the specific gravity of the brine solution. The Sy is assumed to approximate the solution release volume from saturation to 333 mbar. Particle density was estimated from the measured porosity and bulk density according to:
59
|
1 |
= |
Bulk Density |
|
Particle Density |
Brine samples
Depth-specific brine samples were collected during core and rotary drilling by packer-system, bailing, or drive-point sampling. Bulk (compound) brine samples were obtained during pumping tests on selected exploration wells.
● Depth-specific packer sampling was the primary method used to collect brine samples during the drilling programs for Phase II and III (2016-2020). Most samples were obtained during drilling, although some were also taken after drilling had concluded. Samples were considered acceptable and representative of the depth interval only if they showed no, or minimal traces of drilling mud. The intervals were typically 3 m long and determined by the site geologist after inspecting drill cores or at predetermined depths. However, the interval length may vary depending on the specific circumstances of a given hole or interval, such as borehole stability. To ensure accurate sampling, intervals were flushed out multiple times before collecting the actual sample. The flushed brine was then collected in a barrel, and the time taken to fill the barrel was recorded.
● Drive-point sampling: five brine samples were collected using this method where a drive-point was installed onto BT-sized drill rods after removing the core barrel. The drive-point was then lowered past the drill bit with the help of a drop hammer and an impermeable diaphragm was used to prevent filling of the drill rods during the descent. Once the desired depth was reached, an electric water level sounder was used to confirm that the interior was dry before perforating the diaphragm using a weighted pin lowered with the wireline. This piercing allowed the brine to flow into the drive point and fill the BT rods and collect the samples with the use of a bailer.
● Bailing: the borehole was purged by bailing up to three well volumes of brine from the drill casing as calculated from the water level measurement, prior to collecting the final brine sample from the bottom of the hole. The final brine sample was discharged from the bailer into a 20-liter clean bucket from which one-litre sample bottles were rinsed and filled with brine. Each bottle was taped and marked with the borehole number and depth interval. A small sub-sample from the bucket was used to measure field parameters (density, electric conductivity, pH and temperature) at the wellhead.
● Samples from pumping tests: This method involved collecting samples directly from the discharge pipe at regular intervals during pumping tests. Temperature and density were recorded on internal field sheets.
Regardless of the sampling method, samples were collected in 20-litre containers that were washed with distilled water and rinsed with brine several times prior to filling. The temperature and density were recorded before filling 1-litre sample bottles which were also flushed with brine from the 20-litre container. The sample bottles were then sealed with a secure screw top to prevent leakage and labelled clearly with their identification number. Samples did not undergo any further preparation before being shipped to their respective laboratories.
After the sampling process the site geologist would retain possession of the brine samples until they were delivered to the office for shipment to the assay laboratory. Once at the office, duplicates, blanks, and standards were inserted into the assay batches before being sent to the laboratory. Prior to shipment all samples were kept under controlled temperature conditions.
The chemical analysis of brines was conducted by two reputable laboratories: SGS Argentina S.A ("SGS") and Norlab S.R.L, the later partnered with Alex Stewart Assayers ("ASANOA"). The mentioned laboratories have extensive experience analysing lithium-bearing brines and hold accreditation to ISO 9001 standards and follow the ISO 17025 guidelines. SGS and ASANOA are independent laboratories and have no relationship with the Company.
60
For the primary constituents of interest, including boron, calcium, potassium, lithium, and magnesium, both Alex Stewart and SGS utilized Inductively Coupled Plasma Analysis as the analytical technique, with samples diluted 100:1 prior to analysis. A summary of the analytical methods employed by each laboratory for each physicochemical parameter and analyte is shown in the table immediately below.
Analytical methods used by Alex Stewart and SGS for brine assays
| Analysis | ASA Code | ASA Method | SGS Code | SGS Method |
| Physicochemical Parameters | ||||
| Alkalinity | LMFQ167 | Volumetric | SM 2320B | Titration |
| Conductivity | LMFQ01 | Potentiometric | SM 2510 B | Resistor Network |
| Density | LMFQ19 | Pycnometer | ASTM D4052-16 | Digital Density Meter |
| Hardness (CaCO3) | LMFQ13 | Volumetric | SM 2320B | Titration |
| PH | LMC128 | Potentiometric | SM 4500 H B | Potentiometric |
| TDS | LMFQ08 | Gravimetric | SM 2540C | Gravimetric |
| Inorganic Parameters | ||||
| Chlorides (Cl) | LMC101 | Argentometric | SGS.ME.108 | Ion Chromatography |
| Sulphates (SO4) | LMC107 | Gravimetric | SGS.ME.108 | Ion Chromatography |
Drainable porosity QA/QC
Five duplicate samples were sent to Daniel B. Stephens & Associates, Inc ("DBSA") to serve as check samples to test for accuracy within the drainable porosity analysis. Summary statistics for paired samples by GSA lithologic category for Pt and Sy are provided in the two tables below. QA/QC testing was run on subsamples from the same core, but not on identical samples. Minor differences in material type (sand/silt/clay content) and core physical structure (bulk density, degree of cementation, rock content, macropore content) may result in discrepancies between laboratory measured values.
Variations can likely be attributed to sample heterogeneity within cores which result in subsamples with slightly to significantly different material properties, and differences in laboratory methods such as testing duration. The Sy values measured by GSA were often considerably higher than the Sy values measured by DBSA, particularly for the 333 mbar RBR measurement (see table below). Differences were most pronounced for halite samples due to lithological variability within the group (one crystalline sample with large crystals and one massive to crystalline sample with very scarce matrix).
In the absence of sample heterogeneity, differences are likely attributable to testing equilibration time and testing method. DBSA's RBRC method only applied 333 mbar of equivalent pressure for 24 hours and did not use a filter paper to prevent air moving through samples, whereas GSA's RBR testing was run at 120 mb for two days and then 333 mbar for two to four days no air was allowed to move through samples. Therefore, the lower Sy values reported by DBSA may be due to the samples not reaching equilibrium over the testing period. This may be most pronounced in materials with a greater predominance of macropores such as sands. It should be noted that Sy values measured at 120 mbar were generally in better agreement with DBSA's measured Sy values for all sediment lithological groups (see table below).
61
Specific gravity was higher for the RBR DD-01 451-451,2 sample (SG = 2.29) compared to the RBRC sample (SG = 2.13). Comparison of average values by lithological group was also limited due to small sample number. Average Pt values measured using the RBRC method (DBSA) were 7% lower for the clastic material group and 129% lower for the halite group. Average Pt values were considerably higher for the clastic group (0.24), with the halite group having a mean Pt value of 0.02.
There was general agreement between the total porosity data (R2 = 0.85). Correlation was slightly lower for the specific yield data (R2 = 0.80). The slope of the line was relatively high, indicating that GSA Sy values were approximately 35% higher than those reported by DBSA. The adjusted correlation coefficient between RBRC Sy and the drainable porosity at 120 mbar was R2 = 0.80.
All the samples tested for Sy fell below the 1:1 line indicating that GSA measured Sy values were typically higher than DBSA measured Sy values. In contrast, while three Pt points were scattered below the 1:1 line, two clastic material samples were plotted on the 1:1 line meaning the measured Pt values were similar for both laboratories.
There is acceptable variation between the laboratories for samples in the clastic material classification, but unacceptable variation for samples in the halite classification.
Total porosity results for paired samples using GSA lithologic classification
| Total Porosity Statistics | Clastic material | Halite | ||
| RBR | RBRC | RBR | RBRC | |
| N | 3 | 2 | ||
| Avg | 0.26 | 0.24 | 0.11 | 0.02 |
| StdDev | 0.02 | 0.02 | 0.07 | 0.02 |
| Average Relative Percent Difference | 7% | 129% | ||
Specific yield results for paired samples using GSA lithological classification
| Specific Yield Statistics |
Clastic material | Halite | ||||
| RDR @ 120 | RBR @ 333 | RBRC | RBR @ 120 | RBR @ 333 | RBRC | |
| N | 3 | 2 | ||||
| Avg | 0.10 | 0.14 | 0.10 | 0.02 | 0.07 | 0.00 |
| StdDev | 0.05 | 0.04 | 0.03 | 0.00 | 0.01 | 0.00 |
| Average Relative Percent Difference(1) | 2% (120 mbar), 29% (333 mbar) | 123% (120 mbar), 177% (333 mbar) |
||||
Note:
(1) Calculated as 2*absolute value of (RBR-External Lab)/(RBR+External Lab), expressed as a percentage.
Brine QA/QCQA/QC procedures were implemented for laboratory chemistry analysis of brine samples obtained during drilling and pumping activities by Millennial Lithium, Arena Minerals, and Centaur. Each QA/QC program involved randomly inserting duplicates, check samples, field blank, and standards, with the following percent of quality control samples for each party: 21% for Millennial Lithium, 21% for Arena Minerals and 17% for Centaur. The purpose each QA/QC program was to confirm the accuracy and precision of the analysis, as well as to detect any potential contamination of the samples.
62
ASANOA was the primary laboratory used by Millennial Lithium while SGS was used as the secondary lab for check samples. This arrangement was in place until August 21, 2017, when Alex Stewart was replaced by SGS as the main laboratory. No registered secondary lab was used for check samples. Arena Minerals used SGS as their primary laboratory throughout the 2021/2 campaign, while ASANOA was used as the main lab for Centaur throughout the 2018/9 campaign.
Accuracy which is the closeness of measurements to the "true" or accepted value was monitored by the random insertion of standards, and the implementation of check samples analysed by a secondary, independent laboratory. Precision, the ability to consistently reproduce a measurement in similar conditions, was monitored by submitting blind field duplicates to the laboratory, monitoring any variability in the sampling and analytical program. Contamination which is the transference of material from one sample to another was measured by inserting blank samples into the sample stream. By implementing a QA/QC program that monitors these three factors, it is possible to ensure the reliability and accuracy of the laboratory results.
Millennial Lithium duplicate brine samples
To ensure the laboratory's precision, duplicate brine samples were submitted to the same facility. Millennial Lithium's Phase II and Phase III exploration programs included a total of 51 duplicate samples, some of these also used as check samples. 16 duplicates and their original samples were submitted to ASANOA (Alex Stewart), while 35 were submitted to SGS. The following two tables list the main statistics regarding the duplicates versus their original samples for lithium and potassium for each laboratory.
Statistical analysis of duplicate samples - ASANOA
| Statistic | Li (mg/L) | Duplicate Li (mg/L) | K (mg/L) | Duplicate K (mg/L) |
| Count | 16 | 16 | 16 | 16 |
| Min | 247.1 | 273.8 | 2783.2 | 3300.5 |
| Max | 579.4 | 570.7 | 6092.0 | 6367.8 |
| Mean | 478.5 | 471.8 | 5147.9 | 5047.5 |
| Std Dev | 92.0 | 85.6 | 926.4 | 817.1 |
| RPD | 1.4 | 2.0 | ||
Statistical analysis of duplicate samples - SGS
| Statistic | Li (mg/L) | Duplicate Li (mg/L) | K (mg/L) | Duplicate K (mg/L) |
| Count | 35 | 35 | 35 | 35 |
| Min | 10.0 | 10.0 | 15.0 | 15.0 |
| Max | 701.0 | 758.0 | 6,660.0 | 7,170.0 |
| Mean | 415.6 | 416.2 | 4,340.5 | 4,362.1 |
| Std Dev | 155.4 | 162.1 | 1,574.4 | 1,653.4 |
| RPD | 0.2 | 0.5 | ||
63
The assay results for duplicate samples at both ASANOA and SGS laboratories demonstrate a high degree of precision and consistency for key parameters of lithium and potassium. The highest Relative Percent Difference ("RPD") is only 2% for ASANOA and 0.5% for SGS. This is significantly lower than the commonly accepted 10% cut-off and suggests that the laboratory's analytical procedures are consistently producing results that are in close agreement with each other.
Millennial Lithium check samples
To test the laboratory's accuracy, samples were randomly selected and analysed at a secondary and independent laboratory - SGS. It's important to note that this only occurred before August 21, 2017, when SGS replaced Alex Stewart as the main laboratory. Since that date, no secondary laboratory has been registered for check samples. Millennial Lithium's Phase II and III exploration programs included 29 check samples to both primary and secondary labs. The main statistics regarding the check samples for lithium and potassium are listed in the table below:
Statistical analysis of check samples - ASANOA & SGS
| Statistic | ASANOA-Li (mg/L) | SGS-Li (mg/L) | ASANOA-K (mg/L) | SGS-K (mg/L) |
| Count | 29.0 | 29.0 | 29.0 | 29.0 |
| Min | 0.5 | 10.0 | 2.5 | 10.0 |
| Max | 554.4 | 714.0 | 5,424.3 | 7,740.0 |
| Mean | 468.8 | 543.9 | 4,779.2 | 5,916.2 |
| Std Dev | 104.1 | 123.8 | 970.3 | 1,248.8 |
| RPD | 14.8 | 21.3 | ||
The assay results for check samples between ASANOA and SGS fall within a 20% relative difference for lithium, but slightly over 20% for potassium. A RPD over 20% indicate that there may be an issue with the accuracy of one or both laboratories testing methods, but this cannot be determined solely by the RPD value, and further investigation is needed to identify the cause of the discrepancy. The RPD value for lithium of 14.8% is within the accepted 20% cut-off, but still suggests there is some difference between the results obtained by the two labs.
The check samples for both lithium and potassium show a failure rate that exceeds the accepted 10% cut- off. However, one of the three failures for lithium falls only marginally beyond the failure line which, if considered acceptable, would result in a failure rate of 6.9%. In contrast, the failure rate for potassium is 58.6%, with several samples falling beyond the failure line, indicating an unacceptable level of variation.
Millennial Lithium field blanks
To measure potential contamination 32 blank samples consisting of distilled water were inserted into the sample stream and sent to the laboratories for analysis. ASANOA received 10 blanks, while SGS received 22. Neither laboratory detected any lithium in the samples, although traces of potassium were detected by ASANOA. It is important to note that the detected potassium concentrations were below the standard safe limit, which is generally considered to be three times the detection limit.
64
Millennial Lithium standard samples
The Millennial Lithium sampling program utilized two types of standards. The first standard, 'RR', consisted of a large sample of brine collected from the Salar de Pastos Grandes during testing at well PGPW16-01 with the concentrations being obtained from a round robin style quality control check. Five RR standards were sent to ASANOA for analysis while 26 samples were sent to SGS. The concentrations (best values) of the standard obtained through the round robin are shown in the table below.
Element concentrations (best values) for Standard RR - Millennial Lithium
| Sample | Li (mg/L) |
Ca (mg/L) | Mg (mg/L) |
B (mg/L) | Na (mg/L) | K (mg/L) | Density (g/mL) | EC (mS/cm) |
TDS (mg/L) |
| PGS17153 | 450.2 | 618.8 | 3,033.9 | 774.9 | 107,255.0 | 4,890.0 | 1.2 | 189.0 | 334,800.0 |
The second type of standard, 'INBEMI', consisted of a synthetic solution prepared by the National University of Salta. INBEMI standards were only sent to SGS for analysis, amounting to a total of six samples. The concentration values for this standard are reported in the table below.
Element concentrations for Standard INBEMI ML
| Sample | Li (mg/L) | Ca (mg/L) | Mg (mg/L) | B (mg/L) | Na (mg/L) | K (mg/L) | SO4 (mg/L) |
Density (g/mL) |
| PGS17153 | 295.0 | 440.0 | 189.0 | 532.0 | 75,518.0 | 3,188.0 | 189.0 | 1.2 |
The RR standards analysed by ASANOA show that none of the lithium nor potassium values fall outside the ± 2 standard deviations from the mean. Additionally, all lithium values fall within the ± 5% range of the reference values while only one potassium value falls outside this range. There were not enough INBEMI standard samples analysed by ASANOA to conduct a graphical analysis as the moving average does not have enough data.
Notably, a bias check for the assay results revealed a negative bias ranging from -3.1% for Li to -5.7% for potassium indicating that the measured values are consistently lower than the expected or reference values. However, this detected bias is well below the accepted 10% and is not considered to be significant.
The RR standards analysed by SGS show that 6 out of 26 samples had a bias over the accepted limit of 10% bias lithium with no outliers and a total relative bias of -1.9% which is considered acceptable. Similarly, the potassium samples present 4 out of 26 values over 10% bias with one outlier, and a total relative bias of -3.1%, also deemed acceptable.
Regarding the INBEMI standards analysed by SGS, 2 out of 6 lithium samples showed a bias over 10% with no outliers and a total relative bias of 0%. For potassium samples show 1 out of a total of 6 had a bias over 10%, with no outliers and a total relative bias of 0%.
In summary, while some individual samples showed a bias beyond the generally accepted 10% limit, the overall bias for both lithium and potassium within the standard samples analysed by both laboratories is considered acceptable with the highest being -5.7% for lithium within the RR standards assayed by ASANOA.
65
Arena Minerals duplicate brine samples
SGS was used as the main assay laboratory by Arena Minerals and to ensure that the precision of the lab was acceptable, a total of 9 duplicate brine samples were submitted. There were no check samples used during the Arena Minerals drilling campaign due to COVID-19 related issues. The table below lists the main statistics regarding the duplicates for lithium and potassium.
66
Statistical analysis of duplicate samples - SGS
| Statistic | Li (mg/L) | Duplicate Li (mg/L) | K (mg/L) | Duplicate K (mg/L) |
| Count | 9.0 | 9.0 | 9.0 | 9.0 |
| Min | 33.6 | 31.9 | 197.0 | 177.9 |
| Max | 658.8 | 657.8 | 6022.9 | 6075.6 |
| Mean | 419.1 | 413.8 | 3726.1 | 3686.1 |
| Std Dev | 185.0 | 183.3 | 1788.9 | 1757.4 |
| RPD | 1.3 | 1.1 | ||
The assay results for duplicate samples at SGS demonstrate a high degree of precision and consistency for key parameters of lithium and potassium. The RPD is low, with values of only 1.3% for lithium and 1.1% for potassium. These are significantly lower than the commonly accepted 10% cut-off and suggests that the laboratory's analytical procedures are consistently producing results that are in close agreement with each other.
There were no failures for neither lithium nor potassium within duplicates analysed by SGS. The generally accepted threshold for failure rates is 10%, so duplicates are not only considered acceptable, but the lack of failures suggests high precision within the SGS laboratory for the current project.
Arena Minerals field blanks
To measure potential contamination within the sampling process a total of six blank samples consisting of distilled water were inserted into the sample stream and sent to the SGS laboratory for analysis. Neither lithium nor potassium were detected in any samples, therefore all concentrations were below the standard safe limit, which is generally considered to be three times the detection limit.
Arena Minerals standard samples
The Arena sampling program utilized two different standards, both obtained from brine within Salar de Pastos Grandes and named STD-1 and STD-2. Six samples were sent to SGS for analysis for each standard, amounting to a total of 12 standard samples. Their respective concentrations (best values) were obtained from a round robin style quality control check and are shown in the table below:
Element concentrations (best values) for Standards 1 & 2 - Arena Minerals
| Sample | Li (mg/L) | Mg (mg/L) | Na (mg/L) | K (mg/L) |
| STD-1 | 645.7 | 2,395.5 | 55,435.8 | 6,709.8 |
| STD-2 | 352.6 | 1,292.0 | 29,825 | 3,682.5 |
The STD-1 standard has no outliers nor values with a bias higher than 10% for neither lithium nor potassium, which suggests high accuracy and precision. Two lithium values fall outside the ± 5% variation from the reference value which still can be considered acceptable. The total relative bias for lithium is 6.7% and 2.6% for potassium, indicating that the measured values are consistently higher than the reference values, but are both within the acceptable 10% threshold. Finally, no values of lithium nor potassium fall outside the ± 2 standard deviations from the mean.
67
The STD-2 standard has no outliers but has one value with a bias higher than 10% for both lithium and potassium. Additionally, the same lithium and potassium value falls outside the ± 5% variation from the reference value, although can still be considered acceptable. The total relative bias for lithium is 7.3% and 3.6% for potassium indicating that the measured values are consistently higher than the reference values but are both within the acceptable 10% threshold. Finally, no values of lithium nor potassium fall outside the ± 2 standard deviations from the mean.
In summary, while some individual samples showed a bias beyond the generally accepted 10% limit, the overall bias for both lithium and potassium within the standard samples analysed by both laboratories is considered acceptable, with the highest being 7.3% for lithium within the STD-2 standard.
Centaur duplicate brine samples
ASANOA was used as the main laboratory by Centaur and to ensure acceptable precision within the lab, a total of six duplicate brine samples were submitted to the same facility. To date, there is no data regarding the use of check samples for the Pastos Grandes Project developed under Centaur. The table below lists the main statistics regarding the duplicates for lithium and potassium.
Statistical analysis of duplicate samples - ASANOA
| Statistic | Li (mg/L) | Duplicate Li (mg/L) | K (mg/L) | Duplicate K (mg/L) |
| Count | 6.0 | 6.0 | 6.0 | 6.0 |
| Min | 409.6 | 411.5 | 2,894.1 | 2,886.7 |
| Max | 548.3 | 627.9 | 5,093.1 | 5,213.7 |
| Mean | 507.3 | 543.2 | 4257.6 | 4617.1 |
| Std Dev | 52.5 | 65.8 | 880.1 | 824.0 |
| RPD | 6.8 | 8.1 | ||
The assay results for duplicate samples at ASANOA demonstrate a high degree of precision and consistency for key parameters of lithium and potassium. The Relative Percent Difference (RPD) is below the commonly accepted 10% cut-off for lithium and potassium, with values of 6.8% and 8.1% respectively. This suggests that the laboratory's analytical procedures are consistently producing results that are in close agreement with each other.
Out of the six duplicates tested, only one failure occurred for lithium while there were no failures for potassium. This translates to a 16.7% failure rate for lithium and 0% for potassium. The generally accepted failure rate threshold is 10% which means that duplicates are considered acceptable for potassium but unacceptable for lithium. However, it is important to note that the sample size taken under Centaur is limited, with only six duplicates assayed. Therefore, in this case, a single failure surpasses the 10% threshold. Taking this into consideration a 16.7% failure rate is deemed to be acceptable.
Centaur field blanks
To measure potential contamination a total of five blank samples consisting of distilled water were inserted into the sample stream and sent to ASANOA for analysis. Neither lithium nor potassium were detected in any samples, which means that all concentrations were below the standard safe limit, generally considered to be three times the detection limit.
Centaur standard samples
68
The Centaur sampling program utilized two different standards both obtained from brine within Salar de Pastos Grandes with their respective concentrations being obtained from a round robin style quality control check. These standards were named STD-A and STD-B, and three samples of the former were sent to the lab for analysis while only two of the latter were assayed. The concentrations (best values) for each standard obtained through the round robin are shown in the table below:
Element concentrations (best values) for Standards A & B - CR
| Sample | Li (mg/L) | Mg (mg/L) | Na (mg/L) | K (mg/L) |
| STD-A | 707.0 | 4,641.9 | 111,699.2 | 7,041.9 |
| STD-B | 370.5 | 2,444.3 | 58,074.0 | 3,543.1 |
The STD-A standard has no outliers nor values with a bias higher than 10% for neither lithium nor potassium, which suggests high accuracy and precision. Similarly, no lithium nor potassium values fall outside the ± 5% variation from the reference value, which is also a good indicator of accuracy and precision. The total relative bias for lithium and potassium is 0% indicating that the measured values are in accordance with the reference values. No lithium nor potassium values fall outside the ± 2 standard deviations from the mean.
Mineral Resource Estimates
The Company has not previously disclosed a mineral resource estimate in accordance with S-K 1300. The following is a brief discussion of the material assumptions and criteria underlying the mineral resource estimate. Please see Section 11 of the Pastos Grandes TRS for more detail.
The qualified person of the Pastos Grandes TRS is of the opinion that the quantification of parameters used in the resource estimate, including lithium concentrations, drainable porosity and aquifer geometry, is appropriate (and follow S-K 1300 standards) to support the Mineral Resource estimate for the Pastos Grandes Project described herein.
A Mineral Resource estimate for the Pastos Grandes Project is summarized in the tables below.
The Mineral Resource estimate was determined by defining the aquifer geometry, the drainable porosity or specific yield ("Sy") of the hydrogeological units in the Salar, and the concentration of the elements of economic interest, mainly lithium and potassium. Mineral Resources were defined as the product of the first three parameters. The model resource estimate is limited to the PGSALAC mining concessions in Salar de Pastos Grandes and do not include the AMSA properties The resource model domain is constrained by the following factors:
The upper boundary of the model is determined by the highest elevation samples within the dataset and, or the phreatic brine level.
The lateral extent of the resource model covers an area of 56 km2, confined within the boundaries of the PGSALAC mining claims in the Salar. Additionally, the extent is restricted by the contact between the Quaternary basin and the underlying basement rock.
The lower boundary of the model domain is set to coincide with the basement from the geological model or the total depth of 635 m when the basement is not present.
The specific yield values used to develop the resources are based on results of the logging and hydrogeological interpretation of chip samples and recovered core from the drilling programs, results of drainable porosity analyses carried out on 76 undisturbed core samples by Corelabs, GeoSystems Analysis, Daniel B Stephens & Associates. Boreholes within the measured and indicated resource areas are appropriately spaced at a borehole density of one bore per 4 km2. The table below shows the drainable porosity values assigned to the different geological units for the resource model. The distributions of lithium and potassium concentrations in the model domain are based on a total of 501 brine analyses (not including QA/QC analyses).
69
| Lithology | Sy Average |
| Blanca Lila | 0.5% |
| Alluvium | 13.9% |
| Saline Lacustrine | 4.1% |
| Clastic Central | 5.4% |
| Base Gravels | 12.5% |
The Mineral Resource estimation for the Pastos Grandes Project was developed using the Stanford Geostatistical Modelling Software (SGeMS) and the geological model as a reliable representation of the local lithology. The author of the Pastos Grandes TRS was closely involved with the block model development; all results have been reviewed and checked at various stages and are believed to be valid and appropriate for these resource estimates. The table below shows the mineral resource estimate for lithium and potassium for the PGSA mining claims of the Pastos Grandes Project.
| Measured (M) | Indicated (I) | M+I | Inferred (I) | |||||
| Li | K | Li | K | Li | K | Li | K | |
| Aquifer volume (km3) | 13.45 | 2.15 | 15.60 | 5.22 | ||||
| Mean specific yield (Sy) | 0.11 | 0.06 | 0.10 | 0.08 | ||||
| Brine volume (km3) | 1.5 | 0.1 | 1.6 | 0.4 | ||||
| Mean grade (g/m3) | 49 | 495 | 26 | 260 | 46 | 462 | 39 | 403 |
| Concentration (mg/l) | 438 | 4419 | 457 | 4,655 | 441 | 4,452 | 460 | 4,794 |
| Resource (tonnes) | 662,000 | 6,660,000 | 57,000 | 570,000 | 719,000 | 7,230,000 | 205,000 | 2,100,000 |
| LAR 85.1% interest (tonnes) | 563,000 | 5,668,000 | 49,000 | 485,000 | 612,000 | 6,153,000 | 174,000 | 1,787,000 |
Notes to the resource estimate:
1. S-K 1300 definitions were followed for Mineral Resources.
2. The Qualified Person for this Mineral Resource estimate is Frederik Reidel, CPG
3. No Mineral Reserves have been estimated for this updated Mineral Resource Estimate.
4. The Mineral Resource Estimate is reported as lithium contained in brine in-situ.
5. The Mineral Resource Estimate is not a Mineral Reserve Estimate and does not have demonstrated economic viability. There is no certainty that all or any part of the Mineral Resources will be converted to Mineral Reserves. Inferred Resources have great uncertainty as to their existence and whether they can be mined economically.
6. A cut-off grade of 200 mg/l has been applied to the M+I+I resources estimates.
The cutoff grade is based on the various inputs and the formula blow:
Cutoff Grade
| (Total Capital Expenditure+Total Operating Expense) | |
| = | Total Brine Extracted |
| (Recovery*Conversion from Li to Li2CO3*Projected LCE Price*(1 - Export Duties)*(1 - Royalties)) |
70
Where:
Total Capital Expenditure= USS 1,781 million
Total Operating Expenditure = USS 6,020 million
Cost of Capital = USS 178 million (10 percent of Total Capital)
Total Brine Extracted = 628 Mm3
Conversion from Li to Li2CO3= 5.323
Projected LCE Price = USS 20,00 per metric ton of LCE
Export Duties =4.5%
Royalties= 3.0%
Calculated Recovery= 65%
Resulting in a calculated cut-off grade of 200 mg/l.
Factors that may affect the Brine Resource estimate include: locations of aquifer boundaries; lateral continuity of key aquifer zones; presence of fresh and brackish water which have the potential to dilute the brine in the wellfield area; the uniformity of aquifer parameters within specific aquifer units; commodity price assumptions; changes to hydrogeological, metallurgical recovery, and extraction assumptions; density assignments; and input factors used to assess reasonable prospects for eventual economic extraction. Currently, Mr. F. Reidel (the QP), does not know any environmental, legal, title, taxation, socio-economic, marketing, political, or other factors that would materially affect the current Resource estimate.
7. Numbers may not add due to rounding averaging.
8. The effective date is December 31, 2024.
Mineral Resource Estimate Comparison Between December 31, 2023 and 2024
For the year ended December 31, 2023, the Company was not subject to S-K 1300, and reported its mineral resources in accordance with NI 43-101. For ease of comparison, the estimates for the project are shown on a 100% basis. The Company's attributable interest is 85.1% of the tonnage stated in the tables.
Mineral Resources
The table below sets forth the comparison of the Mineral Resources as set forth in the Company's annual report on Form 40-F for the year ended December 31, 2023, and as set forth in the Company's annual report on Form 20-F for the year ended December 31, 2024. The decreases in the mineral resources are primarily due to the fact that under S-K 1300, mineral resources are estimated exclusive of mineral reserves.
| December 31, 2024 | December 31, 2023 | Percent Difference | ||||
| Category | Lithium Tonnes | LCE Tonnes | Lithium Tonnes | LCE Tonnes | Lithium | LCE |
| Measured | 662,000 |
3,522,000 |
662,000 |
3,522,000 |
0% | 0% |
| Indicated | 57,000 |
303,000 |
118,000 |
628,000 |
-52% | -52% |
| Measured + Indicated | 719,000 |
3,825,000 |
780,000 |
4,150,000 |
-8% | -8% |
| Inferred | 205,000 | - |
208,000 |
- | -1% | -% |
71
Mining Operations Based on the results of the pumping tests carried out for the Pastos Grandes Project (as described above) brine abstraction from the Salar de Pastos Grandes will take place by installing and operating a conventional production wellfield. The production process starts when brine is extracted from the aquifer beneath the Pastos Grandes Salar, it is then pumped from each well to pre-concentration ponds located near the active wells. From these latter ponds brine is pumped to the remaining evaporation ponds and, once concentrated and partially purified, it is sent to the lithium carbonate plant.
Results of the pumping tests for the project indicate that pumping rates of individual brine production wells will be an average of 20 l/s for each well. Therefore, it is planned that an average of 30 production wells will be operative at various flow rates optimized to extract brine from areas of higher lithium grades and higher transmissivity in order to meet the required brine feed rate of 540 l/s, as an average (varying from 480 l/s in Stage 1 to 600 l/s in Stage 2). Seasonal fluctuations in the evaporation rate dictate that the required brine feed rate which will decrease during the winter months and will increase during the summer months. Well completion depths will vary and are still being studied. Brine production wells will be completed with 12-inch diameter stainless steel production casing and equipped with 380 V submersible pumping equipment. Permanent power will be delivered to the wellfield area through a mid-range power line.
The overall wellfield configuration is in process of being defined. Each well is to be completed with a submersible electric pump. These pumps can be powered initially by an adjacent dual-fuel (gas or diesel) generator, and eventually by an electrical distribution system from the centralized power house.
Brine discharged from each wellhead will be piped through 8-inch diameter HDPE feeder pipelines to two central collection/transfer ponds that are located near the well field. Collected brine will then be pumped at a diurnal, seasonal, and at an adjusted, as needed, rate to the evaporation ponds located mainly on the flat Salar surface.
Planned Exploration and Development
The following technical work may further advance the Pastos Grandes Project towards construction and into production.
● Incorporate the lithium resources hosted on the Arena Minerals properties into the resource estimate for the Pastos Grandes Project so that these resources can be properly incorporated in the numerical groundwater flow and transport modeling for final brine production wellfield design, evaluation of potential environmental constraints, and the estimation of updated reserves.
● Carry out a 30-day pumping test on Arena Minerals production well PW-1 to characterize the southern extent of the lower brine aquifer.
● Drill three deep core holes into the lower brine aquifer to improve the confidence level of geological and drainable porosity parameters in the central clastics and basal gravel /breccia units. These holes should be completed as deep monitoring wells for additional observations point during the additional pumping tests recommended.
● Carry out 30-day pumping tests in existing brine production wells PGPW18-15 and PGPW18-17 with water level monitoring in the above-mentioned new observations points.
● Carry out 7-day pumping test on water production wells PGMW19-2 and PGPW19-3; along with additional groundwater exploration work to secure future water supply requirements from freshwater resources within the Pastos Grandes and Sijes basins.
● Numerical modelling should be resumed with the Arena Minerals developed 3D FEFLOW groundwater flow and transport model for the basin to carry out predictive simulations for the design and layout of the future brine production wellfield, evaluation of potential environmental effects, and the preparation of updated lithium reserves for the Pastos Grandes Project.
● Based on the results of the predictive model simulations, install three additional brine production wells in the lower brine aquifer.
● Implement systematic hydro(geo)logical monitoring programs of surface water and groundwater features to reinforce the baseline characterization of the Pastos Grandes basin. Continue with the surveys and studies to improve the quantification of the water balance components of the basin.
72
● Drill 7-10 deep exploration core holes aimed at increasing the lithium resource base of the Pastos Grandes Project.
● Drill four industrial water exploration wells to evaluate the resources and optimize the production strategy, including Arena Minerals' blocks to the North and East of the basin.
The estimated budget to complete and implement the above recommendations are shown in the table below:
| Item | Cost |
| Pumping tests on existing wells (3) | US$360,000 |
| Infill resource drilling (3 holes) | US$6,300,000 |
| Resource exploration drilling (7 holes) | US$16,800,000 |
| Production drilling (8 holes) | US$32,800,000 |
| Hydrogeological monitoring programs | US$775,000 |
Internal Controls Over Mineral Resource and Reserve Estimates.
The Company has internal controls for reviewing and documenting the information supporting the Mineral Resource and Mineral Reserve estimates, describing the methods used, and ensuring the validity of the estimates. Information that is used to compile mineral resources and reserves is prepared and certified by appropriately qualified persons at the project sites and is subject to our internal review process which includes review by appropriate management. An independent Qualified Person is contracted by the Company to certify resources and reserves estimates according to S-K 1300 standards.
73
ITEM 6. DIRECTORS, SENIOR MANAGEMENT AND EMPLOYEES
A. Directors and Senior Management
The following are the directors and Named Executives (as defined below) of the Company:
| Name | Age(1) | Position | Date of Appointment as Director |
| John Kanellitsas | 63 | Executive Chair | September 4, 2015 |
| Samuel Pigott | 41 | President and Chief Executive Officer | March 19, 2024 |
| George Ireland* | 68 | Lead Director | November 13, 2015 |
| Diego Lopez Casanello* | 51 | Director | October 3, 2023 |
| Robert Doyle* | 56 | Director | October 3, 2023 |
| Franco Mignacco | 42 | Chair of the Shareholder Committee of Exar and Director** | September 4, 2015 |
| Monica Moretto* | 59 | Director | March 19, 2024 |
| Calum Morrison* | 45 | Director | October 3, 2023 |
| Alec Meikle | 36 | Executive Vice President, Corporate Development | N/A |
| Alex Shulga | 42 | Vice President and Chief Financial Officer | N/A |
| Mariano Chiappori | 55 | Vice President and Chief Operating Officer | N/A |
Note:
* Independent Director
** Mr. Mignacco was formerly President of Exar until December 6, 2024, at which time he became Chair of the Shareholder Committee of Exar.
(1)As of March 14, 2025
Biographical information with respect to each of our directors and our Named Executives is set forth below.
John Kanellitsas, Executive Chair
Mr. Kanellitsas is the Executive Chair of the Company. He joined the Company (when formerly known as Lithium Americas Corp.) in June 2013 and has been a director of the Company and has served in various executive roles with the Company since September 2015. He also served as the Interim CEO from October 2023 until March 2024. Mr. Kanellitsas also serves as a director of Largo Physical Vanadium Corp. and Lithium Royalty Corp.
He has over 25 years of experience in the investment banking and asset management industries. He co-founded and was a partner of Geologic Resource Partners, LLP, where he served as its Chief Operating Officer from 2004 to 2014. Prior to Geologic, Mr. Kanellitsas was employed by Sun Valley Gold, LLC and Morgan Stanley & Co. in New York and San Francisco.
Mr. Kanellitsas has a Bachelor of Science in Mechanical Engineering from Michigan State University and a Master of Business Administration from the University of California in Los Angeles.
74
Samuel Pigott, President and Chief Executive Officer
Mr. Pigott joined the Company as President and Chief Executive Officer on March 18, 2024 and as a director on March 19, 2024. Prior to this, he served as Head of Business Development, of Ganfeng from October 2018 to March 2024. Before joining Ganfeng in 2018, Mr. Pigott worked in several financial and investment banking institutions in a variety of senior roles.
Mr. Pigott holds a Master of Business Administration from Oxford University and a Bachelor of Arts in Economics and History from McGill University.
George Ireland, Lead Director
Mr. Ireland joined the Company as a director in November 2015. He has over forty years of experience in the mining and metals industry in positions ranging from field geologist and operations, to banking and venture capital. In 2004, Mr. Ireland founded Geologic Resource Partners LLP and serves as Chief Investment Officer and CEO. He previously held various roles as an analyst and partner with investment firms including Knott Partners LP, Cleveland Cliffs Inc., the Chase Manhattan Bank, ASARCO Inc. and Ventures Trident LP.
He graduated from the University of Michigan with a BSc degree from the School of Natural Resources and is a Fellow in the Society of Economic Geologists.
Diego Lopez Casanello, Director
Mr. Casanello joined the Company as a director in October 2023 with the Separation Transaction. He has served as Chief Executive Officer of Farmers Business Network, Inc. (farmer-to-farmer network and e-commerce platform) since March 2024; Managing Partner of Vidavo Ventures (venture capital firm focused on decarbonization technologies) since March 2022; and Executive Advisor to New Mountain Capital LLC (private equity firm) since June 2021. Prior to this he served as President and Chief Operating Officer of UPL Limited (global agricultural and specialty chemicals manufacturer) from March 2019 to May 2021 and as the Chief Executive Officer of Arysta LifeScience Corporation (global agricultural chemicals manufacturer) from February 2016 to February 2019, following its sale in July 2018 to UPL. He currently serves on the board of Profile Products LLC since November 2021 (environmental solutions).
Mr. Casanello started his career at chemical manufacturer BASF SE and worked in senior executive positions in Europe, Asia, South and North America, including as Managing Director of BASF Argentina S.A. and leading the Oilfield and Mining Chemicals business in North America. He has extensive M&A experience and holds a BA in Business Administration from the University of Hagen.
Robert Doyle, Director
Mr. Doyle joined the Company as a director in October 2023 with the Separation Transaction. He has been a corporate director since June 2016, serving on the boards of Faraday Copper Corp. (development-stage copper company) since April 2022, OreZone Gold Corp. (TSX-listed gold producer) since June 2022 and Maverix Metals Inc. (royalty streaming company) from June 2016 until its acquisition by Triple Flag Precious Metals Corp. in January 2023. He previously served as CFO of Pan American Silver Corp. (TSX and NASDAQ-listed, leading producer of silver) from January 2004 until retiring in March 2022.
Mr. Doyle has over 20 years of international experience in corporate finance, functional management and capital markets roles. Mr. Doyle holds a BSc of Finance from the University of Cape Town and is a Chartered Accountant in South Africa and Chartered Financial Analyst in Canada.
Franco Mignacco, Director
Mr. Mignacco has been a director of the Company since September 2015 and has been serving on the board of Full Circle Lithium Corp. since April 21, 2023. He served as President of Exar from June 2013 - December 2024, overseeing operations and development of the Cauchari-Olaroz mineral project. Previously, he was the Vice Chair of the former Lithium Americas Corp. from June 2013 to September 2015 prior to its merger with Western Lithium USA Corp.
75
Mr. Mignacco holds an MBA from San Andres University in Buenos Aires, Argentina and a mining degree with honours from Universidad Austral, Buenos Aires, Argentina.
Monica Moretto, Director
Ms. Moretto joined the Company as a director in March 2024. She has served as Vice President, Social Sustainability, Diversity, and Inclusion of Pan American Silver Corp. (TSX and NASDAQ-listed, leading producer of silver) since April 2008.
Ms. Moretto is a seasoned senior executive with vast experience in the mining industry who has provided leadership and strategic advice to industry boards and international committees in North America for almost two decades. She currently chairs the International Social Responsibility committee at the Mining Association of Canada. Ms. Moretto holds a Bachelor of Art in communications from Argentina and holds an ESG designation from Competent Boards. She was the recipient of the Robert H. Hedley Sustainability Award of Excellence, given by the prestigious Association for Mineral Exploration of British Columbia in January 2019, and more recently, the 2021 Trailblazer Award given by Women in Mining Canada.
Calum Morrison, Director
Mr. Morrison joined the Company as a director in October 2023 with the Separation Transaction. He has served as a corporate director since February 2023, serving on the board of Snowline Gold Corp. He previously served as President and Chief Executive Officer of Great Bear Royalties Corp. (royalty company) from January 2020 to September 2022 until its sale to Royal Gold Inc.; VP Business Development and CFO of Great Bear Resources Ltd. (precious metals company) from November 2019 to February 2022 until its sale to Kinross Gold Corporation; and Senior Commercial Lead, Corporate Development of Teck Resources Ltd. (leading copper, zinc, coal and energy producer) from June 2013 to October 2019.
Mr. Morrison has over 20 years of experience in the mining industry, having worked both in corporate development and investment banking roles. He has managed and led negotiations on numerous transactions with aggregate value in excess $5 billion; including acquisitions, divestments, joint ventures, and other strategic initiatives. Mr. Morrison currently resides in Vancouver, Canada, holds a BSc from Dalhousie University and is a Chartered Professional Accountant in British Columbia and Chartered Financial Analyst in Canada.
Alec Meikle, Executive Vice President, Corporate Development
Mr. Meikle has over 15 years experience in capital markets and the resource industry. Prior to joining the Company (formerly Lithium Americas Corp.) in 2016, Alec was a research analyst at Cormark Securities covering base metals and lithium companies. In his various capacities with the Company, Alec has been responsible for over $2 billion in M&A and financing transactions. He holds a Bachelor of Commerce from University of Toronto. Mr. Meikle currently resides in Europe.
Alex Shulga, Vice President and Chief Financial Officer
Mr. Shulga is a Chartered Professional Accountant (CPA-CGA) and a member of the Association of Chartered Certified Accountants (FCCA, UK). He has 20 years of experience in the mining sector focusing on finance management, corporate finance, financial reporting and compliance and mergers & acquisitions. Prior to joining the Company (formerly Lithium Americas Corp.) in 2018, Mr. Shulga held senior roles in audit and assurance practice at PricewaterhouseCoopers LLP. Currently, Mr. Shulga is a Director and Sponsorship Committee Chair for the Vancouver Chapter of Financial Executives International. He was Vice-President of Finance for Lithium Americas Corp. prior to assuming his current role at Lithium Argentina. Mr. Shulga earned an accounting degree and Master of Finance from Taras Shevchenko National University in Kyiv.
76
Mariano Chiappori, Vice President and Chief Operating Officer
Mr. Chiappori is a mechanical engineer with extensive expertise and experience managing complex businesses and projects at national and international levels. Before his eight-year tenure with lithium producer FMC Corp. (now Livent USA Corp.), where he held several senior roles including Global Director of Manufacturing and Supply Chain, Mr. Chiappori was Operations Manager for United Phosphorus Ltd. and managed both construction and industrial operations for Bunge Argentina. He was Vice-President of Lithium Americas' Latin American Operations from July 2022 until October 2023, when he assumed his current role with Lithium Argentina. Mr. Chiappori holds a mechanical engineering degree from Universidad Nacional de la Plata, and a postgraduate degree in management development from the IAE Business School.
B. Compensation
Director Compensation
As a result of the Separation Transaction, the Company's Board was reconstituted in October 2023 to be comprised of John Kanellitsas, George Ireland, Diego Lopez Casanello, Robert Doyle, Franco Mignacco and Calum Morrison. On March 19, 2024, Sam Pigott and Monica Moretto were appointed to the Board.
The Company's director compensation program been redesigned to be competitive with the market in which we compete for qualified directors. The program is reviewed with the assistance of an independent compensation consultant from time to time to allow the Company to keep attracting and retaining qualified directors to serve on our Board.
The fee schedule for independent directors was updated subsequent to the Separation Transaction, on recommendation of Lane Caputo Compensation Inc. (Lane Caputo"), an independent compensation advisor to the Company, based on a benchmarking exercise to the peer group outlined below:
| Compensation Peer Group | ||
| Aris Mining Corp. | Fortuna Silver Mines Inc. | Lithium Americas Corp. |
| Aya Gold & Silver Inc. | Hudbay Minerals Inc. | MAG Silver Corp. |
| Capstone Mining Corp. | IGO Limited | MP Materials Corp. |
| Ero Copper Corp. | Ioneer Ltd. | Piedmont Lithium Inc. |
| First Majestic Silver Corp. | Liontown Resources Ltd. | Standard Lithium Ltd. |
Note that this peer group is the same peer group used to benchmark the Company's executive compensation practices (see "Compensation Benchmarking"and "Compensation Peer Group" on pages 84 for details on the compensation peer group development process).
Compensation paid to our independent directors is comprised of an annual cash retainer for serving on the Board and committees, payable in arrears in four quarterly installments, and an equity retainer in the form of annual deferred share unit ("DSU") grants in accordance with the Company's current Incentive Plan. Upon appointment to the Board, a pro-rated initial equity award will be made based on the amount of time until the next annual equity award.
77
| Services by Independent Directors |
Cash Retainer | Equity Retainer |
| Annual Base Fees (payable in arrears in four quarterly installments) | ||
| Lead Director | US$70,000 per year | US$150,000 in the form of an annual DSU grant under the Incentive Plan |
| Independent Director Fee (for all independent directors other than the Lead Director) | US$50,000 per year | US$150,000 in the form of an annual DSU grant under the Incentive Plan |
| Additional Fees for Serving on Committees (payable in arrears in four quarterly installments) | ||
| Annual Fee for acting as Chair of the Audit and Risk Committee | US$20,000 per year | - |
| Annual Fee for acting as Chair of the Governance, Nomination, Compensation and Leadership Committee | US$15,000 per year | - |
| Annual Fee for serving as a Chair of any other committee | US$10,000 per year | - |
| Special Committee Meeting Fees | To be set by the Board concurrent with establishing the special committee, and dependent upon the expected workload | |
Director Compensation Table
The table below summarizes the compensation earned by all directors other than directors who are also Named Executives for the year ended December 31, 2024.
In 2024, we paid a total of US$1,052,912 in director compensation to independent directors. This includes fees paid to current directors but excludes compensation paid to Mr. Pigott, Mr. Kanellitsas and Mr. Mignacco who were not compensated for their services as directors.
| Director Name | Fees Earned (US$) (1) |
Share- Based Awards (US$) (2) |
Option- Based Awards (US$) |
Non-Equity Incentive Plan Compensation (US$) |
Pension Value (US$) |
All Other Compensation (US$) |
Total (US$) |
| George Ireland | $70,000 | $150,000 | - | - | - | - | $220,000 |
| Diego Lopez Casanello | $60,000 | $150,000 | - | - | - | - | $210,000 |
| Robert Doyle | $70,000 | $150,000 | - | - | - | - | $220,000 |
| Monica Moretto (3) | $37,912 | $150,000 | - | - | - | - | $187,912 |
| Calum Morrison | $65,000 | $150,000 | - | - | -- | - | $215,000 |
| Franco Mignacco (4) | $287,500 | $465,623 | - | - | - | 250,000 | $1,003,123 |
78
Notes:
(1) Cash portion of fees paid to each director.
(2) DSU portion of fees paid to each director. Amounts presented are based on the estimated grant date fair value of the DSUs being US$3.85 per DSU awarded in Q2 2024.
(3) Ms. Moretto joined the Board in March 2024
(4) Mr. Mignacco's role as President of Exar ended on December 6, 2024, however, he continues to serve as a director of the Company and as Chair of the Shareholder Committee of Exar. In 2024, as compensation for serving as President of Exar, Mr. Mignacco received fees of $287,500. In connection with his retirement as President of Exar, Mr. Mignacco received a retirement payment of an aggregate of $500,000, comprised of a cash payment of $250,000 and the issuance of $250,000 of restricted share units ("RSUs"). Mr. Mignacco was not paid any fees to serve as a director of the Company in 2024, however, in 2025 Mr. Mignacco will be paid director fees.
The following table provides a breakdown of the fees earned by non-employee directors in the table above:
| Director Name | Board Retainer (US$) |
Committee Retainer (US$) |
Total (US$) | |
| George Ireland | Cash DSUs Options |
$50,000 $150,000 - |
$20,000 - - |
$70,000 $150,000 - |
| Diego Lopez Casanello | Cash DSUs Options |
$50,000 $150,000 - |
$10,000 - - |
$60,000 $150,000 - |
| Robert Doyle | Cash DSUs Options |
$50,000 $150,000 - |
$20,000 - - |
$70,000 $150,000 - |
| Monica Moretto (1) | Cash DSUs Options |
$37,912 $150,000 - |
- - - |
$37,912 $150,000 - |
| Calum Morrison | Cash DSUs Options |
$50,000 $150,000 - |
$15,000 - - |
$65,000 $150,000 - |
| Franco Mignacco (2) | Cash RSUs Options |
$537,500 $465,623 - |
- - - |
$537,500 $465,623 - |
Notes:
(1) Ms. Moretto joined the Board in March 2024.
(2) Mr. Mignacco's role as President of Exar ended on December 6, 2024, however, continues to serve as a director of the Company and as Chair of the Shareholder Committee of Exar. In 2024, as compensation for serving as President of Exar, Mr. Mignacco received fees of $287,500. In connection with his retirement as President of Exar, Mr. Mignacco received a retirement payment of an aggregate of $500,000, comprised of a cash payment of $250,000 and the issuance of $250,000 of RSUs. Mr. Mignacco was not paid any fees to serve as a director of the Company in 2024, however, in 2025 Mr. Mignacco will be paid director fees.
Outstanding Share-Based Awards and Option-Based Awards
79
Set out below is the value of all outstanding equity incentive awards under our incentive plans as of December 31, 2024 held by directors other than directors who are also disclosed as Named Executives.
| Option-based Awards | Share-based Awards, DSUs and RSUs | ||||||
| Name | Number of securities underlying unexercised Options (#) |
Options exercise price (US$) |
Options expiration date |
Value of unexercised in-the-money Options (US$) (1) |
Number of shares or units of shares that have not vested (#) |
Market or payout value of share- based awards that have not vested (US$) (2) |
Market or payout value of vested share- based awards not paid out or distributed (US$) |
| George Ireland | 150,000 | $5.56 | 3-Dec-30 | - | 251,861 | $659,876 | - |
| Diego Lopez Casanello | 150,000 | $5.56 | 3-Dec-30 | - | 113,961 | $298,578 | - |
| Robert Doyle | 150,000 | $5.4 | 3-Dec-30 | - | 113,961 | $298,578 | - |
| Monica Moretto (3) | - | - | - | - | 46,683 | $122,309 | - |
| Calum Morrison | 150,000 | $5.4 | 3-Dec-30 | - | 113,961 | $298,578 | - |
| Franco Mignacco (4) | 150,000 | 5.4 | 3-Dec-30 | - | 233,077 | 610,662 | - |
| 60,000 | 3.85 | 20-Jun-29 | - | - | - | - | |
Notes:
(1) The value of unexercised "in-the-money options" is calculated on the basis of the difference between the closing price of the Shares on the NYSE on December 31, 2024 of US$2.62 and the exercise price of the Options.
(2) The market value of unexercised share-based awards is calculated on the basis of the closing price of the Shares on the NYSE on December 31, 2024 of US$2.62. DSUs cannot be redeemed until after the director ceases to hold a position with the Company.
(3) Ms. Moretto joined the Board in March 2024.
(4) Franco Mignacco retired from his role as President of Exar on December 6, 2024, however, continues to serve as a director of the Company and as Chair of the Shareholder Committee of Exar.
Anti-hedging requirements are set out in our Securities Trading Policy and apply to all directors.
Incentive Plan Awards-Value Vested or Earned During the Year
The following table sets out the value vested or earned under incentive plans during the year ended December 31, 2024, for all directors other than directors who are also disclosed as Named Executives:
| Name | Option-based awards value vested during the year (US$) |
Share-based awards value vested during the year (US$) (1) |
Non-equity incentive plan compensation value earned during the year (US$) |
| George Ireland | 0 | 0 | 0 |
| Diego Lopez Casanello | 0 | 0 | 0 |
| Robert Doyle | 0 | 0 | 0 |
| Monica Moretto (2) | 0 | 0 | 0 |
| Calum Morrison | 0 | 0 | 0 |
| Franco Mignacco (3) | $ 23,896 |
80
Notes:
(1) Value vested during the year" means the aggregate dollar value of the Shares that are issued on the vesting of DSUs and RSUs. This amount is calculated using the closing market price of the Shares on the dates on which the DSUs and RSUs vested during the year ended December 31, 2024. DSUs cannot be redeemed until after the director ceases to hold a position with the Company.
(2) Ms. Moretto joined the Board in March 2024.
(3) Franco Mignacco retired from President of Exar position on December 6, 2024 and continued being a director of the company.
Indebtedness of Directors and Executive Officers
None of the current or former directors, executive officers, employees of the Company or its subsidiaries or their respective associates or affiliates, are or have been indebted to the Company or its subsidiaries since the beginning of the last completed financial year of the Company.
Executive Compensation
As a result of the Separation Transaction, our executive management was reconstituted in October 2023 to be comprised, among others, of John Kanellitsas, Executive Chair, President and Interim CEO, and Alex Shulga, Vice President and CFO. On March 18, 2024, Sam Pigott joined the Company as President and CEO. This section includes historical information with respect to executive compensation prior to the Separation Transaction as well as information regarding our practices post-Separation Transaction.
The Governance, Nomination, Compensation and Leadership Committee, on behalf of the Board, is responsible for overseeing the Company's executive compensation program.
In 2023, the Board adopted an Incentive Compensation Recovery Policy, which provides for the recovery of erroneously awarded incentive compensation from covered executives in the event that the Company is required to prepare an accounting restatement due to material non-compliance of the Company with any financial reporting requirements under United States securities laws and NYSE requirements. A copy of the Incentive Compensation Recovery Policy can be found on the Company's website at www.lithium-argentina.com.
Executive Compensation Philosophy
The Company's goal is to offer a compensation program that is competitive within the median range of a select group of industry peers for executive compensation comparison purposes, with the overall focus of our program being to offer competitive base compensation to executives and pay for strong performance through an annual performance management program, with a particular emphasis on compensating executives through equity securities to better align executives' financial interests with the interests of shareholders. The goals of our executive compensation program are:
- To attract, motivate and retain high performing executives through market competitive base salaries and employee benefits, which are offered throughout the organization;
- To pay for performance of our executives through our performance management program, which includes performance reviews and awards based on a combination of individual performance and the attainment of corporate and individual goals and objective each year, thereby furthering the interests of the Company, and adding an at-risk component to executive compensation;
81
- To recognize the contribution of our executives to our profitability and long-term growth through the award of short-term and long-term equity incentives based on executive and corporate performance; and
- To align the financial interests of executives with the interests of our shareholders and the Company's overall performance through the award of equity incentives that expose executives to the risks and rewards of ownership of our Company's equity securities.
As an operational stage lithium mining and processing company that recently commenced production of battery grade lithium products, we are dependent on individuals with specialized skills and knowledge related to mining exploration, development and operations, capital projects management, chemical processing for lithium products, corporate finance, legal, human resources, and other areas of business or management expertise. We operate in regions where competition for talent is increasingly strong, the number of opportunities for job seekers is growing and where it is increasingly important for companies to have competitive compensation programs and practices in place to retain and attract talent.
For the year ended December 31, 2024, our compensation program included the following components: base salary, short-term incentive ("STI") annual performance award generally payable 100% in short-term vesting RSUs, long-term incentive ("LTI") performance award payable 100% in three year vesting RSUs , and employee benefits such as retirement savings plan contributions, extended health, dental, life and disability insurance, and a health and wellness benefit to encourage a healthy lifestyle for our executives and staff generally.
2024 was another transformational year for the Company with the achievement of commercial production at Cauchari-Olaroz, the Pastos Grandes Transaction, the successful advancement of the Company following the Separation Transaction and the strategic continuation of the Company to Switzerland, which are accomplishments for which our executives deployed significant time and efforts. Management and the Governance, Nomination, Compensation and Leadership Committee worked with Lane Caputo, an independent compensation advisor to the Company, to evaluate and refine a new executive compensation program for 2024 and beyond in line with the new attributes specific to the Company post-Separation Transaction.
Compensation Governance
Compensation matters are overseen by the Governance, Nomination, Compensation and Leadership Committee. All members of the committee are current or former executive officers/directors of public or private companies, providing them with an understanding of executive compensation policies and practices, along with practical experience as to the workings of such programs and policies. The committee also has the ability to engage external advisors to support committee members in fulfilling the mandate of the committee.
Compensation Advisor and Peer Group Benchmarking Review
To offer market competitive levels of compensation, we previously engaged Willis Towers Watson ("WTW") in 2017 to provide independent compensation advisory services to the Governance, Nomination, Compensation and Leadership Committee and management on our compensation program. The benchmark compensation review completed by WTW, management and the Governance, Nomination, Compensation and Leadership Committee involved the development of a compensation peer group comprised of public lithium mining companies, other diversified mining companies, and lithium and other specialty chemical producers in Canada, the United States and Australia who publicly disclose their compensation practices. After developing the compensation peer group, a comparison of target total direct compensation of our executives with that of the peer group was assessed, together with other industry compensation reports. From there increases to executive compensation were determined, taking effect in 2023.
82
Following the Separation Transaction, the Company engaged Lane Caputo to assist with developing a new fee schedule for independent directors based on a benchmarking exercise to a revised peer group.Lane Caputo also assisted in developing a new executive compensation program for 2024 in line with the new attributes specific to the Company post-Separation Transaction as described below.
There is no requirement for the Governance, Nomination, Compensation and Leadership Committee to pre-approve other services the independent compensation advisor or any of its affiliates provides to the Company at the request of management.
Fees we paid to our independent compensation advisors, Lane Caputo for the 2024 fiscal year and WTW for the 2023 fiscal year are set out below.
| Compensation Advisory Fees | For the years ended December 31, | |
| 2024 (US$) | 2023 (US$) | |
| Executive compensation related-fees | $55,606 | $20,353 |
| All other fees | $3,381 | $20,666 |
| Total fees | $58,987 | $41,019 |
Performance Evaluation and Compensation Process
The Company follows an internal compensation planning process. Parties participating in the process include management, the Governance, Nomination, Compensation and Leadership Committee and an independent compensation advisor as engaged from time to time. Executive compensation decisions and recommendations by management are made by our CEO and Executive Chair (the "Management Compensation Committee"). The Management Compensation Committee evaluates annual performance reviews and make recommendations to the Governance, Nomination, Compensation and Leadership Committee on performance awards for executives other than the CEO and Executive Chair. The Governance, Nomination, Compensation and Leadership Committee then reviews the recommendations in light of the Company's compensation and retention strategy to ensure proposed awards are aligned with the overall design of the compensation program and the Company's business needs, and seeks input from the independent compensation consultant as needed. Annual performance evaluations for the CEO and Executive Chair are assessed by the Governance, Nomination, Compensation and Leadership Committee, which as a committee determines performance awards for these executives. Once the Governance, Nomination, Compensation and Leadership Committee and the Management Compensation Committee have agreed on final performance awards and any changes to executive compensation, these are submitted by the Governance, Nomination, Compensation and Leadership Committee with a committee recommendation for Board consideration. Board approval is required for items such as equity compensation grants, including STI and LTI equity awards, and salary changes for the CEO, Executive Chair and other senior officers of the Company.
The Company historically engaged an independent compensation consultant to conduct a bi-annual review of executive compensation, benchmarked to compensation of a selected peer group. This process is overseen by the Governance, Nomination, Compensation and Leadership Committee, which receives recommendations from the consultant and determines if any changes are needed to our executive compensation program and levels of compensation. In non-review years, the Management Compensation Committee will consider cost-of-living adjustments to base salary for executives along with other staff and provide a recommendation for consideration by the Governance, Nomination, Compensation and Leadership Committee based on changes to indices measuring inflationary conditions in the regions where our executives and staff work.
83
Compensation Benchmarking
Benchmarking of executive compensation compares actual and target compensation against a peer group to benchmark for the position, organizational role and scope of responsibility. The peer group for 2024 was recommended by Lane Caputo and selected based on the criteria set out below .
| Criteria for Selection as Compensation Peers in 2024 | |
| Industry | Companies operating in industries that will overlap with the Company's business targeting battery-grade lithium products, being the diversified metals and mining industry (including lithium) |
| Geographic Location | Publicly traded companies headquartered in North America were selected as many of the Company's executives are based there and the Company is listed on the NYSE and TSX, along with Australia where many global, public lithium companies are headquartered |
| Size | Comparable size to the Company based on market capitalization, enterprise value and projected revenues, with the Company falling near the median point compared to peers |
Compensation Peer Group
The criteria set out above were applied to develop the following compensation peer group of 15 companies, recommended by Lane Caputo the Governance, Nomination, Compensation and Leadership Committee, and approved by the Board.
| Compensation Peer Group | ||
| Aris Mining Corp. | Fortuna Silver Mines Inc. | Lithium Americas Corp. |
| Aya Gold & Silver Inc. | Hudbay Minerals Inc. | MAG Silver Corp. |
| Capstone Mining Corp. | IGO Limited | MP Materials Corp. |
| Ero Copper Corp. | Ioneer Ltd. | Piedmont Lithium Inc. |
| First Majestic Silver Corp. | Liontown Resources Ltd. | Standard Lithium Ltd. |
Named Executive Officers
The named executive officers ("Named Executives") set out below are the Company's CEO, CFO, Executive Chair and the two other highest paid executive officers for the 2024 fiscal year.
| Named Executive | Officer's Title |
| John Kanellitsas | Executive Chair |
| Sam Pigott | Executive Director, President and Chief Executive Officer |
| Alex Shulga | Vice President and Chief Financial Officer |
| Mariano Chiappori | Vice President and Chief Operating Officer |
| Alec Meikle | Executive Vice President, Corporate Development |
84
Elements of Executive Compensation
The Company generally utilizes a combination of both fixed and variable compensation to motivate executives to achieve overall corporate goals. The Board, acting on the recommendation of the Governance, Nomination, Compensation and Leadership Committee, has implemented a compensation structure intended to align the interests of the executive officers with those of the Shareholders. The elements of the Company's historical executive compensation program are summarized in the table below.
| Compensation Elements |
Features | Objectives |
| Base Salary | Evaluated annually, alternating with a bi-annual benchmarking executive compensation review, and in non-benchmarking years a bi-annual cost-of-living adjustment. | Fixed compensation, recognizing individual experience, performance and responsibilities. Targeting salary to the median range of compensation peers promotes retention of talented individuals as executive officers, and facilitates recruitment of new talent in a competitive job market landscape. |
| STI Awards | RSUs with one-year vesting conditions. STI award = Base Salary x STI Target % x (Corporate Performance based on % weight by position + Individual Performance based on % weight by position). |
Rewards performance by executives for achieving annual individual goals and corporate strategic goals. Designed to motivate executives, recognize annual contributions by individuals, and align executive performance with corporate strategic priorities. |
| LTI Awards | RSUs with three-year vesting conditions. LTI = Base Salary x LTI retention factor. |
Promotes longer-term retention and aligns long-term interests of our executives with those of shareholders. At risk award that links long-term equity plan payouts to relative total share price performance over a three-year period Rewards executives for industry out-performance. |
| Retirement Savings Plan Contributions | Annual contribution matching by the Company to a retirement savings plan, up to 3% of base salary, subject to a contribution ceiling established annually (2024 - US$23,000 for ages below 50; US$30,500 for ages 50 and over). | Market competitive benefit. Encourages retirement savings by our executives. |
| Health, Wellness and Other Benefits | Health, dental, life, critical illness and disability insurance. Health and wellness spending account. |
Market competitive benefits. Encourages and supports health and wellness for our executives. |
The Governance, Nomination, Compensation and Leadership Committee reviews each element of
compensation for market competitiveness, and it may weigh a particular element more heavily based on
the respective executive's role and responsibilities within the Company. The committee's focus is on remaining competitive in the market with respect to the Company's total compensation program, in addition to certain components of executive compensation such as base salary and our performance-based compensation program.
85
Base Salary
Base salaries are set with the goal of being competitive with corporations of a comparable size and stage of development, thereby enabling the Company to compete for and retain executive officers critical to the Company's long-term success. The Governance, Nomination, Compensation and Leadership Committee and the Board approve the salary ranges for executives based on the peer group compensation benchmarking review generally occurring bi-annually. Salary determinations for executives by the committee and management are made with consideration of the Company's financial resources and the following criteria, among others:
- The particular responsibilities related to the position;
- Salaries paid by comparable businesses and factoring in market conditions for talent;
- The experience level of the executive; and
- The executive's overall performance or expected performance (in the case of a newly hired executive).
An assessment of these criteria is made by the Governance, Nomination, Compensation and Leadership Committee for the CEO and Executive Chair. For other Named Executives excluding the CEO and Executive Chair, the assessment is made by management, and a recommendation is made to the committee for feedback and recommendation to the Board. Final recommendations are then made to the Board to approve base salary adjustments.
Short-Term Incentive Compensation
The Company awards annual STI compensation to executives based on the achievement of corporate and individual goals for the year. STI awards have the objective of motivating executives to achieve performance objectives that are aligned with the overall strategic objectives of the Company during the period.
A target range for an STI award as a percentage of salary is generally set for each executive position. Actual bonuses awarded are subject to a multiplier depending on actual performance for the year. STI compensation is discretionary and generally consists of a grant of RSUs. RSUs are awarded under the Incentive Plan.
Management determines recommendations for STI awards based on the outcome of annual performance reviews for each executive other than the CEO and Executive Chair. New grants take into consideration corporate and individual performance for the annual period and generally do not factor in prior grants made to an individual except if we are nearing the maximum number of Shares issuable under the Incentive Plan. Recommendations are submitted by management to the Governance, Nomination, Compensation and Leadership Committee for consideration and approval. The Governance, Nomination, Compensation and Leadership Committee determines STI awards for the CEO and Executive Chair, while all other awards are recommended by management with the Governance, Nomination, Compensation and Leadership Committee providing feedback as needed on the recommended amount of such awards. All grants for equity STI awards are approved by the Board.
During the year ended December 31, 2024, the Company utilized a corporate performance scorecard with objectives and various range weights based on position level as well as performance achieving individual goals for the year. Corporate goals and objectives were then cascaded down throughout the organization, after being approved by the Governance, Nomination, Compensation and Leadership Committee. These goals and objectives are generally reflected in five broad categories as set out in the table below. Each category was assigned a particular weighting, with performance weighted on a scale of 1 to 5.
86
| Category | Weighting | Rating | Payout |
| Safety & ESG | 10% | 3 | 100% |
| Operations at Cauchari-Olaroz | 35% | 5 | 200% |
| Finance | 25% | 5 | 200% |
| Growth Initiatives | 10% | 3 | 100% |
| Corporate Functions | 20% | 4 | 150% |
| Total Payout | 100% | 170% | |
| Management Recommendation | 150% |
Management recommended, and the Governance, Nomination, Compensation and Leadership Committee accepted, a payout of 150% for overall corporate performance.
The individual performance and weighting of individual performance in respect of each named executive is set out in the table below.
| Named Executive Officer | Individual Weighting |
Individual Rating | Payout |
| John Kanellitsas, Executive Chair |
0% | 4 | 150% |
| Sam Pigott, President and Chief Executive Officer |
0% | 4 | 150% |
| Alec Meikle, Executive Vice President, Corporate Development | 40% | 5 | 200% |
| Alex Shulga, Vice President and Chief Financial Officer |
35% | 3.25 | 130% |
| Mariano Chiappori , Vice President and Chief Operating Officer |
40% | 3.25 | 130% |
For 2024, the minimum, the STI target and maximum payout opportunity for each named executive is set out below, as a percentage of base salary. The STI award may be revised above or below the target set for any of our senior management, including named executives, in the Board's discretion on recommendation from the Governance, Nomination, Compensation and Leadership Committee within the minimum and maximum ranges provided in the table.
87
| Named Executive Officer | Minimum Payout | % of Base Salary Target |
Maximum Payout |
Actual Payout |
| John Kanellitsas, Executive Chair |
0% | 100% | 200% | 75% |
| Sam Pigott, President and Chief Executive Officer* |
0% | 100% | 200% | 117% |
| Alec Meikle, Executive Vice President, Corporate Development* |
0% | 75% | 150% | 62% |
| Alex Shulga, Vice President and Chief Financial Officer |
0% | 75% | 150% |
110% |
| Mariano Chiappori , Vice President and Chief Operating Officer |
0% | 75% | 150% | 100% |
* Sam Pigott's STI was pro rated to reflect his employment with the Company starting on March 18, 2024 and Alec Meikle's STI was pro rated to reflect his employment with the Company starting on July 31, 2024.
Long-Term Incentive Compensation
LTI compensation is another key component of the Company's executive compensation program. LTI compensation is awarded to motivate performance by executives and promote retention with a strong focus on long-term alignment of executives' interests with those of shareholders. Executives are also provided with an opportunity to share in the rewards of the Company's performance, together with the associated risks of ownership of the Company's securities.
For the year ended December 31, 2024, the Company awarded RSUs to executives as LTI awards under the Incentive Plan. The RSUs have a three-year vesting period. The Company has the discretion to award Options under the Incentive Plan, however, did not grant any Options as part of LTI.
LTI awards for the CEO and Executive Chair are determined by the Governance, Nomination, Compensation and Leadership Committee, and for other executives are determined by the CEO and reviewed by the Management Compensation Committee prior to their recommendation to the Governance, Nomination, Compensation and Leadership Committee, with all awards being determined based on a combination of individual performance and consideration of long-term retention. The Governance, Nomination, Compensation and Leadership Committee then makes a recommendation for Board approval of all LTI awards to be granted as equity compensation.
The LTI awarded to each named executive for 2024 is set out below, as a percentage of base salary. Similar to STI awards, a LTI award may be revised for any of our senior management, including named executives, in the Board's discretion on recommendation from the Governance, Nomination, Compensation and Leadership Committee.
88
| Named Executive Officer | Minimum Payout | Maximum Payout |
Actual 2024 Award |
| John Kanellitsas, Executive Chair |
0% | 200% | 100% |
| Sam Pigott, President and Chief Executive Officer |
0% | 200% | 163% |
| Alec Meikle, Executive Vice President, Corporate Development |
0% | 200% | 153% |
| Alex Shulga, Vice President and Chief Financial Officer |
0% | 200% |
175% |
| Mariano Chiappori , Vice President and Chief Operating Officer |
0% | 200% | 147% |
Benefits
We provide a benefits program, including health, dental, life, critical illness and disability insurance,
employee and family assistance program, and a health and wellness spending account to encourage a healthy lifestyle for our employees, including Named Executives.
Management Risks
The Governance, Nomination, Compensation and Leadership Committee and the Board periodically assess the implications of the risks associated with the Company's compensation policies and practices. The committee maintains sufficient discretion and flexibility in implementing compensation decisions such that unintended consequences in remuneration can be minimized, while still being responsive to market influences in a competitive environment. Through the Governance, Nomination, Compensation and Leadership Committee Charter, the Governance, Nomination, Compensation and Leadership Committee has sole authority to retain consultants to assist it in the evaluation of compensation of senior management and directors. The Company has policies in place to mitigate compensation policies and practices that could encourage Named Executives to take inappropriate and excessive risk. All material contracts and agreements require Board approval. The Board also approves annual and capital budgets.
The Company has a Securities Trading Policy, which applies to employees, officers, directors and consultants ("Covered Persons") of the Company, its subsidiaries and joint venture interests, and also extends to any trading by trusts and holding companies controlled by Covered Persons. The Company also expects Covered Persons will ensure compliance by family and other members of their household.
The Securities Trading Policy stipulates that the Company and its Covered Persons are subject to restrictions against trading in securities of the Company while in possession of material information that has not been publicly disclosed. The Securities Trading Policy also prohibits hedging and derivatives trading, engaging in short sales and trading on margin or pledging the Company's securities. The Securities Trading Policy is posted on our website.
89
Performance Graph
The graph and table on the following page compares the cumulative shareholder return on a C$100 investment in Shares to a similar investment in companies comprising the S&P/TSX Composite Total Return Index, including dividend reinvestment, for the period from January 1, 2019 to December 31, 2024:
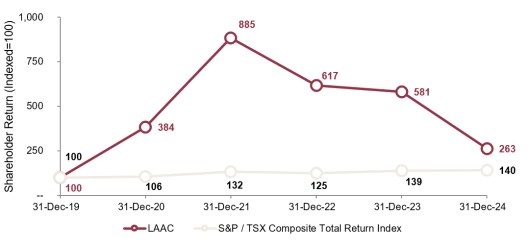
Notes:
(1) The cumulative return of the Company's Shares is based on the closing prices of the Shares on the TSX on December 31, 2019, 2020, 2021, 2022 and 2023 or, if there was no trading on such date, the closing price on the last trading day prior to such date. It has been assumed that upon completion of the Separation Transaction, Lithium Americas Corp. common shares received were sold on October 4, 2023, and that the proceeds were reinvested in the Shares.
(2) The S&P/TSX Composite Total Return Index is a total return index (C$), the calculation of which includes dividends and distributions reinvested.
As shown in the graph above, during the fiscal year ended December 31, 2024, the Company's Share price declined relative to the S&P/TSX Composite Total Return Index for the 2024 calendar year, however, has increased relative to the S&P/TSX Composite Total Return Index over the 5-year timeframe. The Company believes that the share price performance has been impacted primarily by declining lithium commodity prices and macroeconomic factors affecting electric vehicle sales, such as high interest rates and high inflation. Over the same period, the price of lithium declined by approximately 40%.
The trend in overall compensation paid to the Company's executive officers over this period has not directly tracked the performance of the market price of the Shares or the S&P/TSX Composite Total Return Index, however, as the majority of executive compensation is the form of equity-based compensation, executive compensation is substantially aligned with market performance. The unique circumstances of the Company in 2023 required a major reconfiguration of our management team and significant efforts of our management which was reflected in our compensation profile, with the development and commencement of production at the Cauchari-Olaroz, the successful acquisition of Arena Minerals, the completion of the Separation Transaction and the financing with GM for the development of the Thacker Pass project. Given the Company's stage of development, the Company's Share price can be volatile and is currently not a significant factor in cash compensation considerations. The value of LTI compensation in the form of preferred share units ("PSUs") and RSUs is influenced by our Share price performance.
90
Summary Compensation Table
The table below sets out all compensation for Named Executives for our 2024, 2023 and 2022 fiscal years, including direct and indirect compensation. Named Executives who are also directors of our Company are not compensated for their services as directors. Incentive securities issued by the Company in the Separation Transaction in replacement of old incentive securities of the Company are not factored into the calculation of the amounts disclosed in the tables below.
| Named Executive and Principal Position |
Year (1) | Salary (US$) | Equity-Based Compensation (US$) |
Non-Equity Incentive Plan Compensation (US$) |
Pension Value (US$) |
All Other Compensation( (US$) |
Total Compensation (US$) |
|
| Share-Based Awards (US$)(2)(3) |
Option- Based Awards (US$)(4) |
Annual Incentive Plans(3) |
||||||
| John Kanellitsas, Executive Chair |
2024 | 420,000 | 734,999 | - | - | - | - | 1,154,999 |
| 2023 (11) | 420,000 | 2,103,500 | 1,316,300 | 56,536 | - | - | 3,896,336 | |
| 2022 | 400,000 | 1,023,172 | - | 193,125 | - | - | 1,616,297 | |
| Sam Pigott, President and Chief Executive Officer (6) |
2024 | 316,667 | 2,236,495 (7) | 1,309,000 (4)(7) | - | - | - | 3,862,162 |
| Alex Shulga, Vice President and Chief Financial Officer |
2024 | 315,000 | 896,497 | - | - | - | - | 1,211,497 |
| 2023 (11) | 305,446 | 724,650 | 686,750 | 50,000 | - | - | 1,766,846 | |
| 2022 | 200,000 | 253,375 | - | 73,375 | - | - | 526,750 | |
| Mariano Chiappori, Vice President and Chief Operating Officer | 2024 | 373,750 | 873,746 | - | 50,000 | - | - | 1,297,496 |
| 2023 | 373,750 | 386,884 | 398,000 | 50,000 | - | - | 1,208,634 | |
| 2022 | 186,875 | 393,906 | - | 32,819 | - | - | 613,600 | |
| Alec Meikle, Executive Vice President, Corporate Development (9) |
2024 | 147,878 | 774,997 | - | - | - | 3,710,000(5)(6)(8)(10) | 4,632,875 |
| 2023 | - | - | - | - | - | 511,065(10) | 511,065 | |
| 2022 | 398,348 | 171,266 | - | 228,532 | - | - | 798,146 | |
Notes:
(1) Financial years ended December 31, 2024, December 31, 2023 and December 31, 2022.
(2) Share-based awards consist of RSUs granted under the Incentive Plan. The amount of equity-settled payment arrangements is based on the estimated fair value at the grant date. For RSUs, the fair value is based on the five-day VWAP of US$2.78 for 2023 RSUs (US$5.40 for 2023 RSUs and US$25.27 for 2022 RSUs) calculated as of the day prior to the grant date.
(3) Non-Equity Incentive Plan Compensation represents the cash performance bonuses awarded in each year disclosed in the table.
(4) The fair value of Options granted was estimated on the date of grant using the Black Scholes Option Pricing Model. These Options are exercisable at a prices of US$5.18 until April 2, 2031. The key assumptions used under the Black Scholes Option Pricing Model; that were used for the Option awards in the table above were: risk-free rate 4.27%; expected life 7 years; annualized volatility 73.66%; expected dividend rate nil. The Company chose to use the Black Scholes Option Pricing Model as the basis for calculating fair value of the Options granted as this methodology is commonly accepted by issuers. The values presented are consistent with the accounting values used in the Company's audited financial statements.
(5) The fair value of Options granted was estimated on the date of grant using the Black Scholes Option Pricing Model. These Options are exercisable at a prices of US$3.85 until June 20, 2031. The key assumptions used under the Black Scholes Option Pricing Model; that were used for the Option awards in the table above were: risk-free rate 4.27%; expected life 7 years; annualized volatility 73.66%; expected dividend rate nil. The Company chose to use the Black Scholes Option Pricing Model as the basis for calculating fair value of the Options granted as this methodology is commonly accepted by issuers. The values presented are consistent with the accounting values used in the Company's audited financial statements.
(6) For RSUs, the fair value is based on the five-day VWAP of US$3.85 calculated as of the day prior to the grant date.
91
(7) Appointed Chief Executive Officer effective from March 19, 2024
(8) Equity-based compensation consist of RSUs and Stock Options one time sign-on bonus granted under employment contracts.
(9) Appointed Executive Vice President, Corporate Development on July 31, 2024.
(10) Includes contractor fees before appointed as Executive Vice President, Corporate Development.
(11) 2023 compensations are adjusted to include equity-based compensation awarded in June 2024 for 2023 performance.
Fair Value of Stock Option Grants, RSUs, PSUs and DSUs
Under the Plan, which was implemented in March 2016, the Company may grant RSUs, PSUs, DSUs and Options to directors, officers, employees and service providers. The cost of equity-settled payment arrangements is recorded based on the estimated fair value at the grant date and charged to
earnings over the vesting period.
Following a 2025 review of the Company's Board compensation and LTI compensation for executives by Lane Caputo, the Board determined that equity incentives for executive officers should be in the form of RSUs and DSUs to directors, with no further Option awards. The fair value of Options granted by the Company is treated as compensation costs in accordance with International Financial Reporting Standards 2, Share-based Payment.
Each tranche of an equity award is considered to be a separate award, with its own vesting period and
grant date fair value.
Incentive Plan Awards
Outstanding Share-Based Awards and Option-Based Awards
Details about all awards outstanding under incentive plans of the Company as of December 31, 2024, including awards granted during 2024 to each named executive, are set out below.
| Option-based Awards (1) | Share-based Awards (1) | ||||||
| Named Executive | Number of securities underlying unexercised Options (#) |
Option exercise price (US$) |
Option expiration date |
Value of unexercised in-the-money Options (2) |
Number of shares or units of shares that have not vested (#) |
Market or payout value of share- based awards that have not vested (US$) (3) |
Market or payout value of share-based awards not paid out or distributed (US$) (3) |
| John Kanellitsas, Executive Chair | 250,000 | 5.56 | 3-Dec-30 | 0 | 1,169,449 | 3,063,956 | 0 |
| 90,000 | 3.57 | 20-Jun-29 | 0 | 0 | 0 | 0 | |
| Sam Pigott, President and Chief Executive Officer (4) | 250,000 | 5.18 | 2-Apr-31 | 0 | 224,000 | 586,880 | 172,920 |
| 90,000 | 3.85 | 20-Jun-29 | 0 | 0 | 0 | 0 | |
| Oleksandr Shulga, Vice President and Chief Financial Officer | 100,000 | 5.4 | 3-Dec-30 | 0 | 166,468 | 436,146 | 0 |
| 75,000 | 3.85 | 20-Jun-29 | 0 | 0 | 0 | 0 | |
| Mariano Chiappori, Vice President and Chief Operating Officer | 100,000 | 5.4 | 3-Dec-30 | 0 | 144,579 | 378,797 | 0 |
| 60,000 | 3.85 | 20-Jun-29 | 0 | 0 | 0 | 0 | |
| Alec Meikle, Executive Vice President, Corporate Development (5) | 250,000 | 3.85 | 20-Jun-31 | 0 | 574,155 | 1,504,286 | 111,798 |
| 0 | 0 | 0 | 0 | ||||
92
Notes:
(1) The Company's audited consolidated financial statements for the year ended December 31, 2024 use US$ for reporting Options and share-based awards and the table above is consistent with the presentation in note 12 thereto.
(2) The value of unexercised "in-the-money options" is calculated on the basis of the difference between the closing price of the Shares on the NYSE on December 31, 2024 of US$2.62 and the exercise price of the Options.
(3) The market value of unexercised share-based awards is calculated on the basis of the closing price of the Shares on the NYSE on December 31, 2024 of US$2.62. These amounts reflect the maximum amount of Shares which may become issuable in accordance with the terms of such RSUs and PSUs.
(4) Appointed Chief Executive Officer effective from March 19, 2024
(5) Appointed Executive Vice President, Corporate Development on July 31, 2024.
Value of Awards Vested or Earned in 2024
The following table sets out the value on payout or vesting of incentive awards for the year ended December 31, 2024 for each named executive:
| Named Executive | Option-based awards value vested during the year (US$) (1) |
Share-based awards value vested during the year (US$) (2) |
Non-equity incentive plan compensation value earned during the year (US$) |
| John Kanellitsas, Executive Chair |
0 | 114,491 | 0 |
| Sam Pigott, President and Chief Executive Officer (3) |
0 | 211,200 | 0 |
| Alex Shulga, Vice President and Chief Financial Officer |
0 | 43,332 | 0 |
| Mariano Chiappori, Vice President and Chief Operating Officer | 0 | 0 | 0 |
| Alec Meikle, Executive Vice President, Corporate Development (4) | 0 | 169,927 | 0 |
93
Notes:
(1) The "value vested during the year" with respect to the Options is calculated using the accounting fair values determined for financial reporting purposes.
(2) "Value vested during the year" means the aggregate dollar value of the Shares that are issued on the vesting of RSUs and PSUs. This amount is calculated using the closing market price of the Shares on the dates on which the RSUs and PSUs vested during the year ended December 31, 2024.
(3) Appointed Chief Executive Officer effective from March 19, 2024.
(4) Appointed Executive Vice President, Corporate Development on July 31, 2024.
Other Compensation and Pension Benefits
The Company did not have any other pension, retirement or deferred compensation plans, including defined benefit or defined contribution plans.
Employment Agreements
The following descriptions of employment agreements with the Company's Named Executives are effective as of December 31, 2024. On January 23, 2025, in connection with the Company's continuation to Switzerland, the Company entered into new employment agreements (the "2025 Employment Agreements" and each a "2025 Employment Agreement") with John Kanellitsas, Executive Chair, Sam Pigott, President & Chief Executive Officer, Alec Meikle, Executive Vice President, Corporate Development, and Alex Shulga, Vice President and Chief Financial Officer. The 2025 Employment Agreements reflect certain changes required by Swiss law that, among other things, removed payments on termination and on termination after a "Change of Control".
John Kanellitsas, Executive Chair
As at December 31, 2024, Mr. Kanellitsas was paid a base annual salary of US$420,000, and was eligible to receive short-term incentive compensation at a target rate of 75% of base salary (the "Kanellitsas STI Bonus") and long-term incentive compensation at a target rate of 75% of base salary.
On termination of employment without "Cause", because of "Disability" or for "Good Reason", each as defined in Mr. Kanellitsas' employment agreement, Mr. Kanellitsas will receive the following severance package: (a) 18 months (the "Kanellitsas Severance Period") of base salary; (b) 1.5 times Kanellitsas STI Bonus he received for the year prior to the year in which his employment terminates; (c) accelerated vesting of any equity Awards scheduled to vest during the Kanellitsas Severance Period; and (d) continuation of benefits coverage during the Kanellitsas Severance Period or reimbursement for replacement coverage (the "Kanellitsas Severance Package").
If at any time there is a "Change of Control" during the employment agreement (as defined in the employment agreement), and within twelve (12) months of such "Change of Control", Mr. Kanellitsas' employment is terminated by the Company or Mr. Kanellitsas resigns for "Good Reason" then Mr. Kanellitsas shall be entitled to the Kanellitsas Severance Package, except the Kanellitsas Severance Period shall be 24 months.
Mr. Kanellitsas' 2025 Employment Agreement removed Mr. Kanellitsas' entitlement to the Kanellitsas Severance Package, both on termination of employment without "Cause", because of "Disability" or for "Good Reason" and if there is a "Change of Control" and Mr. Kanellitsas' employment is terminated by the Company or Mr. Kanellitsas resigns for "Good Reason".
Sam Pigott, President and Chief Executive Officer
As at December 31, 2024, Mr. Pigott was paid a base annual salary of US$400,000, and was eligible to receive short-term incentive compensation (the "Pigott STI Bonus") and long-term incentive compensation.
On termination of employment without "Cause", because of "Disability" or for "Good Reason", each as
94
defined in Mr. Pigott's employment agreement, Mr. Pigott will receive the following severance package: (a) 12 months (the "Pigott Severance Period") of base salary; (b) the Pigott STI Bonus he would have earned through the Pigott Severance Period based on the Pigott STI Bonus for the year prior to the year in which his employment terminates; and (c) continuation of benefits coverage during the Pigott Severance Period or reimbursement for replacement coverage (the "Pigott Severance Package"). Notwithstanding the foregoing, the Severance Period shall increase by two months on each anniversary of the effective date of the employment agreement, up to a maximum Severance Period of eighteen (18) months.
If at any time there is a "Change of Control" during the employment agreement (as defined in the employment agreement), and within twelve (12) months of such "Change of Control", Mr. Pigott's employment is terminated by the Company or Mr. Pigott resigns for "Good Reason" then Mr. Pigott shall be entitled to the Pigott Severance Package, except the Pigott Severance Period shall be 24 months.
Mr. Pigott's 2025 Employment Agreement increased his annual base salary from US$400,000 to US$450,000 and removed Mr. Pigott's entitlement to the Pigott Severance Package, both on termination of employment without "Cause", because of "Disability" or for "Good Reason" and if there is a "Change of Control" and Mr. Pigott's employment is terminated by the Company or Mr. Pigott resigns for "Good Reason".
Alec Meikle, Executive Vice President, Corporate Development
As at December 31, 2024, Mr. Meikle was paid a base annual salary of US$360,000, and was eligible to receive short-term incentive compensation (the "Meikle STI Bonus") and long-term incentive compensation.
On termination of employment without "Cause", because of "Disability" or for "Good Reason", each as defined in Mr. Meikle's employment agreement, Mr. Meikle will receive the following severance package: (a) 24 months (the "Meikle Severance Period") of base salary; (b) the Meikle STI Bonus he would have earned through the Meikle Severance Period based on the Meikle STI Bonus for the year prior to the year in which his employment terminates; and (c) continuation of benefits coverage during the Meikle Severance Period or reimbursement for replacement coverage (the "Meikle Severance Package").
If at any time there is a "Change of Control" during the employment agreement (as defined in the employment agreement), and within twelve (12) months of such "Change of Control", Mr. Meikle's employment is terminated by the Company or Mr. Meikle resigns for "Good Reason" then Mr. Meikle shall be entitled to the Meikle Severance Package.
Mr. Meikle's 2025 Employment Agreement removed Mr. Meikle's entitlement to the Meikle Severance Package, both on termination of employment without "Cause", because of "Disability" or for "Good Reason" and if there is a "Change of Control" and Mr. Meikle's employment is terminated by the Company or Mr. Meikle resigns for "Good Reason".
Alex Shulga, Vice President and Chief Financial Officer
As at December 31, 2024, Mr. Shulga was paid a base annual salary of US$315,000, and was eligible to receive short-term incentive compensation (the "Shulga STI Bonus") and long-term incentive compensation.
On termination of employment without "Cause", because of "Disability" or for "Good Reason", each as defined in Mr. Shulga's employment agreement, Mr. Shulga will receive the following severance package: (a) 12 months (the "Shulga Severance Period") of base salary; (b) the Shulga STI Bonus he would have earned through the Shulga Severance Period based on the Shulga STI Bonus for the year prior to the year in which his employment terminates; and (c) continuation of benefits coverage during the Shulga Severance Period or reimbursement for replacement coverage (the "Shulga Severance Package").
If at any time there is a "Change of Control" during the employment agreement (as defined in the employment agreement), and within twelve (12) months of such "Change of Control", Mr. Shulga's employment is terminated by the Company or Mr. Shulga resigns for "Good Reason" then Mr. Shulga shall be entitled to the Shulga Severance Package, except the Shulga Severance Period shall be 24 months.
95
Mr. Shulga's 2025 Employment Agreement increased his annual base salary from US$315,000 to US$350,000 and removed Mr. Shulga's entitlement to the Shulga Severance Package, both on termination of employment without "Cause", because of "Disability" or for "Good Reason" and if there is a "Change of Control" and Mr. Shulga's employment is terminated by the Company or Mr. Shulga resigns for "Good Reason".
Mariano Chiappori, Vice President and Chief Operating Officer
As at December 31, 2024, Mr. Chiappori was paid a base annual salary of US$373,750, and was eligible to receive short-term incentive compensation (the "Chiappori STI Bonus") and long-term incentive compensation.
On termination of employment without "Cause", because of "Disability" or for "Good Reason", each as defined in Mr. Chiappori's employment agreement, Mr. Chiappori will receive the following severance package: (a) 12 months (the "Chiappori Severance Period") of base salary; (b) the Chiappori STI Bonus he would have earned through the Chiappori Severance Period based on the Chiappori STI Bonus for the year prior to the year in which his employment terminates; and (c) continuation of benefits coverage during the Chiappori Severance Period or reimbursement for replacement coverage (the "Chiappori Severance Package").
If at any time there is a "Change of Control" during the employment agreement (as defined in the employment agreement), and within twelve (12) months of such "Change of Control", Mr. Chiappori's employment is terminated by the Company or Mr. Chiappori resigns for "Good Reason" then Mr. Chiappori shall be entitled to the Chiappori Severance Package, except the Chiappori Severance Period shall be 18 months.
Termination and Change of Control Benefits
The following table discloses, as of December 31, 2024, the estimated incremental payments and benefits that might be paid under the various plans and arrangements to current Named Executives in the event of termination without cause and termination following a change of control (assuming an effective date of December 31, 2024, for each termination scenario).
| Named Executive Officer | Element of Compensation (3) |
Termination Without Cause (2) US$ |
Change of Control (1)(2) US$ |
| John Kanellitsas, Executive Chair(4) |
Salary Bonus Equity Other |
630,000 472,499 2,317,256 - |
840,000 629,998 3,063,956 - |
| Sam Pigott, President and Chief Executive Officer(4) |
Salary Bonus Equity Other |
400,000 469,998 - - |
800,000 939,996 759,800 - |
| Alex Shulga, Vice President and Chief Financial Officer(4) |
Salary Bonus Equity Other |
315,000 346,499 - - |
630,000 692,998 436,146 - |
| Mariano Chiappori, Vice President and Chief Operating Officer | Salary Bonus Equity Other |
560,625 373,748 - - |
560,625 373,748 378,797 - |
| Alec Meikle, Executive Vice President, Corporate Development(4) | Salary Bonus Equity Other |
720,000 224,999 1,441,000 - |
720,000 224,999 1,616,084 - |
96
Notes:
(1) The entitlement of the named executives to payment upon a change of control is not necessarily in substitution for, and may be in addition to, amounts payable to such named executives upon termination by the Company.
(2) Amounts above include, among other things, amounts payable in lieu of bonuses that would have been earned during the applicable severance period.
(3) For the equity component, the amount represents the realizable value as of December 31, 2024 of Options, RSUs and PSUs which are subject to accelerated vesting. The value of unexercised "in-the-money options" is calculated on the basis of the difference between the closing price of the Shares on the NYSE on December 31, 2024 of US$2.62 and the exercise price of the Options. The value of accelerated RSUs and PSUs is calculated on the basis of the closing price of the Shares on the NYSE on December 31, 2024 of US$2.62.
(4) As of January 23, 2025, the Salary and Bonus figures for Mr. Kanellitsas, Mr. Pigott, Mr. Meikle and Mr. Shulga would be reduced to 0.
Management Contracts
No management functions of the Company or its subsidiaries are to any substantial degree performed by a person or company other than the directors and officers of the Company or its subsidiaries.
Annual Burn Rate
The annual burn rate of the Incentive Plan for the last three financial years is set out below. This figure is calculated by dividing (i) the number of Awards granted under the Incentive Plan during the applicable financial year, by (ii) the weighted average number of Shares outstanding for the applicable financial year. "Awards" for the purposes of this calculation means all RSUs, PSUs, DSUs and Options.
This calculation does not reflect the new replacement incentive securities issued in exchange for old incentive securities as part of the Separation Transaction.
| Financial Year ended December 31 |
Number of Awards awarded under the Incentive Plan (a) |
Weighted average number of Shares outstanding during the applicable financial year (b) |
Annual burn rate ((a)/(b)) (c) |
| 2024 | 3,209,025 | 161,338,014 | 1.99% |
| 2023 (Post-Separation Transaction) | 2,943,500 | 155,331,000 | 1.9% |
| 2023 (Pre-Separation Transaction) | 598,408 | 153,129,000 | 0.39% |
| 2022 | 236,195 | 133,709,000 | 0.18% |
97
Securities Authorized For Issuance Under Equity Incentive Plans
Under the conditional capital for equity incentive plans under the Company's Articles of Association, the Company may issue up to 16,193,223 Shares. The current Incentive Plan is our only equity incentive plan and governs all equity incentives awarded by the Company, including RSUs, PSUs, DSUs and Options. The aggregate number of Shares that may be subject to issuance, together with any other securities-based compensation arrangements of the Company under the Incentive Plan, must not exceed 8% of the issued and outstanding Shares from time to time. Based on the number of outstanding Shares issued as of December 31, 2024, 12,954,538 Shares may be reserved for issuance under the Incentive Plan.
The following information is as at the Company's financial year ended December 31, 2024:
| Plan Category | Number of securities to be issued upon exercise of outstanding Options, RSUs, DSUs PSUs and rights (a) |
Weighted- average exercise price of outstanding Options US$ (b) |
Number of securities remaining available for future issuance under equity compensation plans (excluding securities reflected in column (a)) (c) |
| Equity compensation plans approved by the securityholders | 6,869,496 | 4.86 | 6,085,042 |
| Equity compensation plans not approved by the securityholders | 0 | 0 | 0 |
| Total | 6,869,496 | 4.86 | 6,085,042 |
Securities Authorized For Issuance Under Equity Compensation Plans
Overview
Below is a summary of the material terms of the Second Amended and Restated Equity Incentive Plan (the "Incentive Plan") as last amended and approved by the Board on January 23, 2025.
The Second Amended and Restated Equity Incentive Plan is our only equity incentive plan and governs all equity incentives awarded by LAR, including Options, DSUs, and Restricted Share Rights (time based or in the form of PSUs). We are permitted to issue an aggregate of 8% of the Shares based on the current number of Shares outstanding.
Summary of the Second Amended and Restated Equity Incentive Plan
| SECOND AMENDED AND RESTATED EQUITY INCENTIVE PLAN SUMMARY | |
| Plan Type and Shares Available for Award Grants |
Subject to the conditional capital of the Company for equity incentive plans under the Company's Articles of Association, our plan is an 8% "rolling" equity compensation plan, with maximum number of equity awards disclosed in the next table, pursuant to TSX and NYSE requirements. Any increase to the percentage number of awards must be cleared with TSX and NYSE and would generally require shareholder approval. For greater certainty, any increase in the issued and outstanding Shares will result in an increase in the available number of Shares issuable under the Second Amended and Restated Equity Incentive Plan, and the exercise or settlement of awards under the Second Amended and Restated Equity Incentive Plan will make new grants available under the Second Amended and Restated Equity Incentive Plan. |
98
| Eligible Participants | Directors, executive officers, employees and consultants of the Company and our subsidiaries are eligible for awards under the Second Amended and Restated Equity Incentive Plan. |
| Award Types | Options, DSUs, RSUs or PSUs may be awarded under the Second Amended and Restated Equity Incentive Plan to all eligible participants. |
| Approval of Award Grants | Under the Second Amended and Restated Equity Incentive Plan, award grants (number, vesting conditions and periods, exercise price, etc.) are generally approved by the Board, on the recommendation of the Governance, Nomination, Compensation and Leadership Committee. The CEO also has delegated authority from the Board to approve the grant of a fixed, nominal number of Restricted Share Rights, without Board approval of individual grants. This is generally used for grants to new hires. |
| Vesting Periods | Vesting periods are determined by the Board, on the recommendation of the Governance, Nomination, Compensation and Leadership Committee. Restricted Share Rights is determined by the Board at the time of grant and shall be specified in the Restricted Share Grant Letter. The Second Amended and Restated Equity Incentive Plan provides that, unless otherwise determined from time to time by the Board, on the recommendation of the Governance, Nomination, Compensation and Leadership Committee, Options shall vest and may be exercised (in each case to the nearest full Share) during the period which an Option is outstanding (the "Option Period") as follows: (a) at any time during the first six (6) months of the Option Period, the optionee may purchase up to 25% of the total number of Shares reserved for issuance pursuant to his or her Option; and (b) at any time during each additional six (6) month period of the Option Period the optionee may purchase an additional 25% of the total number of Shares reserved for issuance pursuant to his or her Option plus any Shares not purchased in accordance with the preceding subsection (a) and this subsection (b) until, after the 18th month of the Option Period, 100% of the Option will be exercisable. |
| Options - Term, Grant Date, Exercise Price and Expiry Date Extension for Blackout Periods | The Second Amended and Restated Equity Incentive Plan provides that Options generally have a term of five years for exercise upon the payment of an exercise price that is set at the time of grant. At the end of the exercise period, Options expire. The grant date is generally set as (i) the date the Governance, Nomination, Compensation and Leadership Committee recommended the Option award to the Board for approval; (ii) the grant date set by the Board; or (iii) for awards approved during a blackout period with issuance to follow post-blackout period end, the date of issuance post-blackout period end. The exercise price for Options granted under the Second Amended and Restated Equity Incentive Plan cannot be less than the closing price of the Shares on NYSE on the day immediately prior to the grant date. Options that expire during a blackout period or within 10 days of one ending have their exercise period extended until 10 business days after the end of the blackout period. |
99
| Cashless Surrender of Options | Subject to payment of the applicable share par value, the Second Amended and Restated Equity Incentive Plan provides for cashless surrender of Options by allowing the holder to forego their Options in exchange for receiving a set number of Shares determined by calculating the "in the money" value of the Options (i.e. the fair market value of the Shares on the business day prior to the date of exercise, less the Option exercise price), times the number of outstanding Options, divided by such fair market value of the Shares. | |
| Restricted Share Rights Terms | Vested Restricted Share Rights are settled in Shares issued by the Company, subject to payment of the applicable share par value. Holders who are Canadian residents or generally non-U.S. residents (as permitted by the Board) may defer settlement for any length of time, while holders who are U.S. residents generally must effect settlement during the tax year in which the Restricted Share Rights vest for tax purposes. | |
| Performance Share Units Terms | PSUs are generally awarded as Restricted Share Rights under the Second Amended and Restated Equity Incentive Plan with performance vesting conditions. PSUs vests three years after grant and are subject to vesting conditions tied to the Share price performance relative to the share price performance of a PSUs peer group of public companies. Vested PSUs are settled by the Company issuing an equivalent number of underlying Shares, subject to payment of the applicable par value. Holders who are Canadian residents or generally non-U.S. residents may defer settlement for any length of time, while holders who are U.S. residents generally must effect settlement during the tax year in which the PSUs vest for tax purposes. |
|
| Deferred Share Units Terms | DSUs are generally granted to independent directors on the Board (directors who are not also employees of the Company) only, as part of our Board compensation program. The number of DSUs granted is determined by the five-day VWAP of the Shares immediately prior to the date of Board approval of the grant. DSUs vest and are settled in Shares on a one-for-one basis on the 20th business day after an independent Board director ceases to hold the position. |
|
| Change of Control Vesting Acceleration | In the event of a Change of Control (as defined in the Second Amended and Restated Equity Incentive Plan) pursuant to the dissolution and liquidation of the Company, all Options outstanding will immediately vest and become exercisable on the date of such Change of Control, and all RSUs and PSUs outstanding will immediately vest and be settled by the issuance of Shares. If a Triggering Event (as defined in the Second Amended and Restated Equity Incentive Plan) occurs within the 12 months period immediately following other categories of a Change of Control (excluding the dissolution and liquidation of the Company), all outstanding Options will immediately vest and become exercisable on the date of such Triggering Event, and all outstanding RSUs or PSUs will vest immediately and be settled by the issuance of Shares. PSUs will be settled in pro rata to the performance measurement periods completed prior to the Change of Control and on a one for one basis for future performance measurement periods, if any. DSUs are not covered by a change of control provision under the Second Amended and Restated Equity Incentive Plan as they vest upon departure of a board director who is the holder. Board director departures may or may not occur as part of a change of control event, depending on the circumstances of the event. |
|
100
| Dividends | If our Board declares dividends, holders of vested RSUs, PSUs and DSUs not settled in Shares as of the applicable dividend record date may, at the discretion of the Board, be entitled to receive dividends in the form of additional securities of the same type held. The number of securities will be determined based on the five-day VWAP of the Shares on the NYSE. |
| Insider and Non-Employee Director Award Limits | Shares issued or issuable to insiders under the Second Amended and Restated Equity Incentive Plan are subject to the following upper limits, expressed as a percentage of issued and outstanding Shares: a 10% cap for all insiders as a group, at any given time; a 10% cap for all insiders as a group within any one-year period; a 5% cap for any one insider and the insider's associates in any one-year period; and a 5% cap for any individual, at any given time. The aggregate number of Options that may be granted under the Second Amended and Restated Equity Incentive Plan to any one non-employee director within any one-year period will not exceed a maximum value of US$100,000 worth of securities, and together with any Restricted Share Rights, PSUs and DSUs granted under the Second Amended and Restated Equity Incentive Plan and any securities granted under all other securities based compensation arrangements, such aggregate value will not exceed US$150,000 in any one-year period, subject to caveats set out in the Amended and Restated Incentive Plan. |
| Awards Transfers and Exercises | Transfers of awards under the Second Amended and Restated Equity Incentive Plan are generally not permitted, except if a holder dies. Generally only holders can exercise awards under the Second Amended and Restated Equity Incentive Plan. |
| Effect of Retirement, Termination, Other Events on Unvested Awards | Generally, subject to applicable employment agreements, any unvested awards under the Second Amended and Restated Equity Incentive Plan are forfeited if the holder retires or is terminated prior to the vesting date of the award. The Board has the discretion to accelerate vesting in such cases or allow the awards to continue for their full term. Vesting of Restricted Share Rights and PSUs is automatically accelerated if there is a total disability or death of a holder. If a participant ceases to be employed by the Company or a Designated Affiliate for cause, no Option held by such participant will, unless otherwise determined by the Board be exercisable following the date on which such Participant ceases to be so engaged. If a participant ceases to be employed by the Company, or act as a director of, the Company for any reason other than cause then, unless otherwise determined by the Board any Option held by such Participant at the effective date thereof shall become exercisable for a period of up to 12 months thereafter or prior to the expiration of the Option period in respect thereof, whichever is sooner. |
101
| Plan Amendments | The Board may amend, suspend or terminate the Second Amended and Restated Equity Incentive Plan without approval of Shareholders, provided the changes comply with applicable stock exchange requirements; do not negatively impact any awards outstanding under the Second Amended and Restated Equity Incentive Plan; and the period to exercise outstanding Options generally cannot be extended beyond ten (10) years. Without limitation to the foregoing, the types of Second Amended and Restated Equity Incentive Plan changes that could be made by the Board without Shareholder approval generally include: clerical changes or grammar corrections, changes to eligible participants, or changes to requirements about vesting, term of any grant, termination, exercise price and cashless exercise. Shareholder approval is required if the rolling number of awards available for grant under the Second Amended and Restated Equity Incentive Plan will be increased; changes will be made to insider award limits, or increase participation limits on non-employee directors under the Second Amended and Restated Equity Incentive Plan; changes to reduce the exercise price or permit the cancellation and re issuance of outstanding Options; changes to extend the expiry date of Options beyond their original expiry; changes to permit any amendment to permit Options to be transferred other than for normal estate settlement purposes; and changes to reduce the range of amendments requiring shareholder approval, all as described in the Second Amended and Restated Equity Incentive Plan. |
Second Amended and Restated Equity Incentive Plan Grants and Limits
| Maximum aggregate number of Shares that may be granted under the Second Amended and Restated Equity Incentive Plan, together with any other securities-based compensation arrangements of the Company | 12,954,538 (represents 8% of issued and outstanding Shares as of December 31, 2024) |
| Options as of December 31, 2024 |
2,715,000 |
| Restricted Share Rights as of December 31, 2024, including the maximum number of Shares issuable pursuant to outstanding PSUs | 3,514,069 |
| DSUs as of December 31, 2024 |
640,427 |
| Shares issuable pursuant to outstanding Awards under the Equity Incentive Plan | 6,869,496 (represents approximately 4.24% of issued and outstanding Shares as of December 31, 2024) |
C. Board Practices
About the Board
The Board consists of eight directors whose terms expire annually. John Kanellitsas, George Ireland and Franco Mignacco have served as directors since 2015 and Diego Lopez Casanello, Robert Doyle and Calum Morrison have served as directors since 2023. On March 19, 2024, Sam Pigott and Monica Moretto were appointed to the Board. Each director nominee elected will hold office until their successor is elected at the next annual meeting of Shareholders, or any postponement(s) or adjournment(s) thereof, or until their successor is otherwise elected or appointed. There are no directors' service contracts with the Company or any of its subsidiaries providing for benefits upon termination of employment.
102
Role and Mandate
The Board has overall responsibility for corporate governance matters by virtue of its responsibility for:
- developing and approving corporate policies and guidelines;
- assisting in the definition of corporate objectives and assessing corporate strategies and key plans;
- overseeing material risks of the Company and its business;
- overseeing the integrity of our internal financial controls and management information systems;
- evaluating the Company's performance and the performance of the Board, its committees and individual directors; and
- appointing executive officers and, together with the relevant committee, reviewing their performance.
The Board has adopted a Corporate Governance Framework where the Board has outlined its responsibilities in a board mandate. The board mandate and structural parameters of the Board is available in Lithium Argentina's Corporate Governance Framework on our website (www.lithium-argentina.com).
Independence
The Board currently has eight (8) members of whom five (5) qualify as independent directors, being a majority, under the Corporate Governance Disclosure Rules. This includes our Lead Independent Director, George Ireland. Except for our Sustainable Development Committee, our committees are all comprised entirely of independent directors, including the Chairs of each committee. The independent directors are: George Ireland, Diego Lopez Casanello, Robert Doyle, Calum Morrison and Monica Moretto.
The non-independent directors of the Company are Sam Pigott, who is the President and CEO of the Company; John Kanellitsas, who is the Executive Chair; and Franco Mignacco, who was the President of Exar, which is a significant equity investee of the Company, and is now the Chair of the Shareholder Committee of Exar.
Generally independence of a director means that the individual is not an employee or member of management of the company or any subsidiary, receives no compensation from the company or a subsidiary except compensation for serving as a director on the Board, and generally the individual has no conflicts of interest or other ties to management, the company or a subsidiary that would lead to a determination that the individual is unable to exercise judgement independent of management. These same considerations extend to immediate family members of the individual.
Directors on our Board with an interest in a material transaction or agreement are required to declare their interest and abstain from voting on the transaction or agreement at issue. The Board also forms special committees as needed, comprised of only independent directors, to evaluate proposed related party transactions and ensure that independent judgement is used to evaluate the transaction, free of any potential or actual conflict of interest, or for other purposes as needed and determined by the Board in its sole discretion.
Our Shares are dual-listed in Canada and the U.S. NYSE requirements and U.S. securities laws set out different requirements for determining director independence than TSX requirements and securities laws in Canada. As a "foreign private issuer" under U.S. securities laws, the Company is permitted to follow Swiss requirements (as our home country) instead of certain NYSE corporate governance standards, including director independence but this does not apply to audit committee independence requirements under U.S. securities laws. The three (3) members of our Audit and Risk Committee satisfy the independence requirements of Rule 10A-3 under the Exchange Act.
103
Role of the Chair and the Independent Lead Director
The Board Chair leads the Board and is responsible for managing the affairs of the Board to ensure that it functions effectively and efficiently. The Company has developed a written description for the role of the Chair. The responsibilities of this role include:
- Provide leadership to enable Board to act in carrying out its duties and responsibilities as described in the Board charter and as otherwise may be appropriate;
- Work with the CEO and other officers to monitor progress on the business plan, annual budgets, policy implementation and succession planning;
- Providing advice and mentorship to the CEO;
- Provide advice, counsel mentorship to the CEO and fellow members of the Board;
- Chairing Board meetings and liaising with the Corporate Secretary in respect of meeting logistics, and to ensure all required business and items requiring approval are brought before the Board;
- Facilitating in-camera sessions at Board meetings without the presence of management;
- Ensuring the proper flow of information between management and the Board;
- Chair the annual, and any special meeting, of the Shareholders; and
- Exercise the authority of the CEO in the unlikely event that the CEO is absent and is unable to act and action on the part of the CEO when required to protect the interests of the Company.
The Board has also appointed an Independent Lead Director to assist the Board Chair and provide leadership so that the Board can function independently. The Independent Lead Director is responsible for coordinating the activities of the other independent directors and perform such other duties and responsibilities as the Board may determine.
Strategic Planning
The Board and management generally conduct an annual strategic planning session to discuss updates to the Company's corporate strategy. The strategic planning session typically occurs prior to the budget approval process for the following year to facilitate the review of the Board of proposed budgets, taking into consideration the overall corporate strategy and direction of the Company. Financial forecasts for the Company are also presented to the Board together with a fulsome review of the Company's risk assessment matrix under its enterprise risk management system.
The Board exercises its oversight of management's performance on execution of the Company's strategy by receiving:
- Presentations from management at least quarterly on items including the status of the Company's projects and development operations including construction and development activities, budget performance to date, safety and health, community relations, the environment and sustainability, litigation involving the Company's material projects, investor relations matters, and human resources; and
- Informal updates from management on material developments or items of interest to directors.
Committees of the Board
The Board has three (3) standing committees, each with a written charter setting out the duties and responsibilities for the committee and its members, areas of committee oversight and the process for reporting to the Board. Directors are appointed annually to the committees after the annual meeting of Shareholders. The current members of each committee and their independence status are set out below.
104
| Committee | Members | Independence |
| Audit and Risk Committee | Robert Doyle (Chair) George Ireland Calum Morrison |
Independent Independent Independent |
| Governance, Nomination, Compensation and Leadership Committee | Calum Morrison (Chair) Robert Doyle George Ireland |
Independent Independent Independent |
| Sustainable Development Committee | Diego Lopez Casanello (Chair) John Kanellitsas Franco Mignacco Monica Moretto |
Independent Not Independent Not Independent Independent |
Audit and Risk Committee
The Audit and Risk Committee assists the Board in its oversight functions as they relate to the integrity of the financial statements and financial reporting, accounting processes, internal controls, and matters concerning independent External Auditors, including direct communication with External Auditors.
The committee's primary areas of responsibility include:
- Overseeing the integrity of the Company's financial statements and reviewing the Company's financial disclosure and reporting;
- Overseeing the integrity and performance of the Company's internal audit processes, including the internal audit function;
- Monitoring the qualifications, independence and performance of the Company's External Auditors;
- Reviewing the integrity and effectiveness of the Company's systems of internal controls for reporting on the Company's financial condition;
- Monitoring Management's compliance with legal and regulatory requirements as it relates to financial and reporting matters; and
- Overseeing certain risk management systems and practices adopted by the Company.
All members of the Audit and Risk Committee are financially literate, and two members are designated as financial experts, being Robert Doyle and Calum Morrison. "Financially literate" means they have the ability to read and understand a company's financial statements of a similar level of extent and complexity as can be expected of the financial reporting by the Company.
Based on their business and educational experiences, each Audit and Risk Committee member has a reasonable understanding of the accounting principles used by the Company; an ability to assess the general application of such principles in connection with the accounting for estimates, accruals and reserves; experience preparing, auditing, analyzing or evaluating financial statements that present a breadth and level of complexity of issues that can reasonably be expected to be raised by the Company's financial statements, or experience actively supervising one or more individuals engaged in such activities; and an understanding of internal controls and procedures for financial reporting. All members of the Audit and Risk Committee have had several years of experience in senior executive roles or as board members of significant business enterprises in which they assumed substantial financial and operational responsibility.
105
The Audit and Risk Committee's charter is available at the Company's website: www.lithium-argentina.com.
Sustainable Development Committee
The Sustainable Development Committee assists the Board with oversight of the following matters:
- The review and reporting to the Board on corporate policies, procedures and practices with respect to managing the risks and opportunities associated with:
- Health and safety;
- Environmental matters including water, waste, biodiversity, reclamation, closure, carbon emissions, air quality management and responsible production;
- Social engagement and social responsibilities including but not limited to interactions with local communities, governments, Indigenous communities, academic institutions, and industry, policy and advocacy groups; and
- Sustainable development and business practices as they relate to environmental, safety, social responsibility and related matters in the conduct of the Company's activities;
- The review and monitoring of Company's sustainability reporting, as well as the Company's alignment and audits against sustainability.
The proper care of the environment and the health and safety of our workforce is integral to our organization and the communities in which it operates. Accordingly, Lithium Argentina and its subsidiaries conduct operations with a focus on sustainability, and protecting and minimizing impacts to our local communities, the environment and wildlife to the extent possible. Our commitment extends to, among other things:
- Complying with the standards set by the applicable environmental laws and regulations of the countries and regions in which we operate, and additional environmental standards and practices that are voluntarily adopted by the Company;
- Exploring, designing, constructing, operating and planning for closures of mining and processing operations by utilizing effective and proven practices that minimize adverse environmental impacts;
- Educating employees regarding environmental matters, promoting employee participation in identifying opportunities to minimize environmental impacts, and asking that our employees behave in a manner which recognizes the Company's social responsibility;
- Conducting regular reviews and reporting findings to management and the Board in respect of environmental, sustainability, health, safety and community relations matters; and
- Striving to continually improve our environmental performance by designing and developing our operations to minimize environmental impacts through initiatives like carbon footprint reduction and tailings waste management, and other mitigation measures.
106
The Sustainable Development Committee charter is available at the Company's website: www.lithium-argentina.com.
Governance, Nomination, Compensation and Leadership Committee
The Governance, Nomination, Compensation and Leadership Committee has a written charter setting out its responsibilities. Generally, the committee assists the Board with oversight of the following matters:
- Identifying individuals qualified to become Board and Board committee members and recommending that the Board select director nominees for appointment or election to the Board;
- Developing and recommending corporate governance guidelines and practices for the Company to the Board to consider;
- Reviewing executive management development and succession planning for the Company; and
- The Board's responsibilities relating to compensation and benefits of the executive management and directors of the Company; and
- Developing and overseeing the Company management's compensation policies and programs.
The committee reviews and makes recommendations to the Board with respect to committee and Board composition, along with the overall compensation strategy, the equity incentive plan, salaries and benefits, and succession planning of our executive officers that may address retirement, termination of employment or special circumstances. Committee oversight also extends to setting annual corporate goals and objectives for the Company, which in turn form the basis for performance evaluations for our senior management. The committee also determines performance-based awards for the CEO and Executive Chair based on their annual performance reviews.
All members of this committee have the skills and experience necessary to oversee compensation matters based on their prior management roles with public and private companies.
The Governance, Nomination, Compensation and Leadership Committee charter is available at the Company's website: www.lithium-argentina.com.
D. Employees
As at December 31, 2024, the Company had 71 employees, of which 38 employees are assigned to operations and 19 corporate employees were based in Argentina, 11 corporate employees were based in Canada, and 3 corporate employees were based in the US. The Company has administrative offices in Vancouver, Canada and Buenos Aires and Salta, Argentina, and its corporate headquarters is located in Switzerland.
The following table sets forth the number of employees we had at the end of each fiscal period:
| Year | Full Time | Part Time | Total |
| December 31, 2022 | 63 | - | 63 |
| December 31, 2023 | 144 | 1 | 145 |
| December 31, 2024 | 70 | 1 | 71 |
107
None of our employees are members in a labor union.
E. Share Ownership
As of March 21, 2025, our directors and Named Executives, as a group, beneficially owned a total of 7,793,643 Shares, representing beneficial ownership of 4.81% of the Shares.
The table below sets forth the number of Shares beneficially owned by our directors and Named Executives as of March 21, 2025. The persons listed below are deemed to be the beneficial owners of Shares underlying options DSUs, PSUs and RSUs that are exercisable within 60 days from the above date, including "out-of-the money" options. The percentages shown below are based on 161,931,734 outstanding Shares as of March 21, 2025, plus 3,260,826 Shares underlying options, DSUs, PSUs and RSUs that are exercisable within 60 days for the indicated beneficial owner for an aggregate total of 7,793,643.
Shareholdings of Directors and Executive Officers
| Name of Beneficial Owner |
Shares Held |
Exercisable Options |
DSUs | PSUs | RSUs | Number of Shares Beneficially Owned |
Percent of Outstanding Shares |
| John Kanellitsas | 2,116,260 | 0 | 0 | 27,870 | 1,141,579 | 3,285,709 | 2.01% |
| Sam Pigott | 69,269 | 0 | 0 | 0 | 290,000 | 359,269 | 0.22% |
| George Ireland | 3,256,186 | 0 | 251,861 | 0 | 0 | 3,508,047 | 2.16% |
| Diego Lopez Casanello | 100,000 | 0 | 113,961 | 0 | 0 | 213,961 | 0.13% |
| Robert Doyle | 14,500 | 0 | 113,961 | 0 | 0 | 128,461 | 0.08% |
| Franco Mignacco | 2,140,599 | 0 | 0 | 13,328 | 219,749 | 2,373,676 | 1.46% |
| Monica Moretto | 4,265 | 0 | 46,683 | 0 | 0 | 50,948 | 0.03% |
| Calum Morrison | 15,000 | 0 | 113,961 | 0 | 0 | 128,961 | 0.08% |
| Alec Meikle | 21,970 | 0 | 0 | 41,826 | 575,000 | 638,796 | 0.39% |
| Alex Shulga | 54,464 | 0 | 0 | 9,802 | 156,666 | 220,932 | 0.14% |
| Mariano Chiappori | 1,130 | 0 | 0 | 0 | 144,579 | 145,709 | 0.09% |
| Total | 7,793,643 | 0 | 640,427 | 92,826 | 2,527,573 | 11,054,469 | 6.69% |
108
Refer to section titled, Compensation, for the details of the options held by our directors and Named Executives as at December 31, 2024.
The description of any arrangements involving the employees in the Capital of the Company, including any arrangement that involves the issue or grant of options or shares or securities of the Company are disclosed above in "Item 6. - Directors, Senior Management and Employees."
F. Disclosure of a Registrant's Action to Recover Erroneously Awarded Compensation
PART III
ITEM 17. FINANCIAL STATEMENTS
See Item 18.
ITEM 18. FINANCIAL STATEMENTS
The financial information required by this item, including the audited consolidated financial statements for the years ended December 31, 2024, 2023 and 2022, together with the report of PricewaterhouseCoopers LLP, Chartered Professional Accountants, was included in the 2024 Form 20-F.
The audited financial statements of Minera Exar for the year ended December 31, 2024 are included herein.
109
Minera Exar S.A.
Annual Financial Statements
For the year ended December 31, 2024
(Expressed in thousands of US Dollars)

Report of Independent Auditors
To the Board of directors of Minera Exar S.A.
Opinion
We have audited the accompanying financial statements of Minera Exar S.A. (the "Company"), which comprise the statements of financial position as of December 31, 2024 and December 31, 2023, and the related statements of comprehensive (loss)/income, statements of changes in equity and cash flows for each of the three years in the period ended December 31, 2024, including the related notes (collectively referred to as the " financial statements").
In our opinion, the accompanying financial statements present fairly, in all material respects, the financial position of the Company as of December 31, 2024 and December 31, 2023, and the results of its operations and its cash flows for each of the three years in the period ended December 31, 2024 in accordance with IFRS Accounting Standards as issued by the International Accounting Standards Board (IASB).
Basis for Opinion
We conducted our audit in accordance with auditing standards generally accepted in the United States of America (US GAAS). Our responsibilities under those standards are further described in the Auditors' Responsibilities for the Audit of the Financial Statements section of our report. We are required to be independent of the Company and to meet our other ethical responsibilities, in accordance with the relevant ethical requirements relating to our audit. We believe that the audit evidence we have obtained is sufficient and appropriate to provide a basis for our audit opinion.
Responsibilities of Management for the Financial Statements
Management is responsible for the preparation and fair presentation of the financial statements in accordance with IFRS Accounting Standards as issued by the International Accounting Standards Board (IASB), and for the design, implementation, and maintenance of internal control relevant to the preparation and fair presentation of financial statements that are free from material misstatement, whether due to fraud or error.
In preparing the financial statements, management is responsible for assessing the Company's ability to continue as a going concern for at least, but not limited to, twelve months from the end of the reporting period, disclosing, as applicable, matters related to going concern and using the going concern basis of accounting unless management either intends to liquidate the Company or to cease operations, or has no realistic alternative but to do so.
Price Waterhouse & Co. S.R.L., Bouchard 557, 8th floor, C1106ABG - Autonomous City of Buenos Aires, Argentina T: +(54.11) 4850.0000, www.pwc.com/ar
Auditors' Responsibilities for the Audit of the Financial Statements
Our objectives are to obtain reasonable assurance about whether the financial statements as a whole are free from material misstatement, whether due to fraud or error, and to issue an auditors' report that includes our opinion. Reasonable assurance is a high level of assurance but is not absolute assurance and therefore is not a guarantee that an audit conducted in accordance with US GAAS will always detect a material misstatement when it exists. The risk of not detecting a material misstatement resulting from fraud is higher than for one resulting from error, as fraud may involve collusion, forgery, intentional omissions, misrepresentations, or the override of internal control. Misstatements are considered material if there is a substantial likelihood that, individually or in the aggregate, they would influence the judgment made by a reasonable user based on the financial statements.
In performing an audit in accordance with US GAAS, we:
● Exercise professional judgment and maintain professional skepticism throughout the audit.
● Identify and assess the risks of material misstatement of the financial statements, whether due to fraud or error, and design and perform audit procedures responsive to those risks. Such procedures include examining, on a test basis, evidence regarding the amounts and disclosures in the financial statements.
● Obtain an understanding of internal control relevant to the audit in order to design audit procedures that are appropriate in the circumstances, but not for the purpose of expressing an opinion on the effectiveness of the Company's internal control. Accordingly, no such opinion is expressed.
● Evaluate the appropriateness of accounting policies used and the reasonableness of significant accounting estimates made by management, as well as evaluate the overall presentation of the financial statements.
● Conclude whether, in our judgment, there are conditions or events, considered in the aggregate, that raise substantial doubt about the Company's ability to continue as a going concern for a reasonable period of time.
We are required to communicate with those charged with governance regarding, among other matters, the planned scope and timing of the audit, significant audit findings, and certain internal control-related matters that we identified during the audit.
/s/ PRICE WATERHOUSE & CO. S.R.L.
-----------------------------------------------------------
/s/ Raúl Leonardo Viglione
Buenos Aires, Argentina
June 26, 2025.
2
MINERA EXAR S.A.
STATEMENTS OF FINANCIAL POSITION
(Expressed in thousands of US dollars)
| As at December 31, | |||||||
| Note | 2024 | 2023 | |||||
| Current assets | |||||||
| Cash and cash equivalents | 6 | 11,190 | 49 | ||||
| Accounts receivable | 18 | 40,459 | - | ||||
| Other receivables and prepaids | 7 | 19,188 | 14,920 | ||||
| Inventory | 8 | 241,587 | 220,507 | ||||
| 312,424 | 235,476 | ||||||
| Non-Current assets | |||||||
| Other receivables and prepaids | 7 | 18,182 | 3,600 | ||||
| Mineral properties | 9 | 202,832 | 187,120 | ||||
| Properties, plant and equipment | 10 | 1,254,809 | 1,131,723 | ||||
| 1,475,823 | 1,322,443 | ||||||
| TOTAL ASSETS | 1,788,247 | 1,557,919 | |||||
| Current liabilities | |||||||
| Accounts payable and accrued liabilities | 11 | 65,953 | 67,356 | ||||
| Taxes payable | 12 | 6,236 | 954 | ||||
| Loans and borrowings | 13 | 799,150 | 643,018 | ||||
| Customer advances | 18a | - | 9,879 | ||||
| 871,339 | 721,207 | ||||||
| Non-Current liabilities | |||||||
| Other liabilities | 11 | 4,602 | 4,904 | ||||
| Loans and borrowings | 13 | 620,066 | 580,439 | ||||
| Decommissioning provision | 5d | 1,369 | 496 | ||||
| Deferred income taxes liability | 22 | 98,302 | 25,469 | ||||
| 724,339 | 611,308 | ||||||
| TOTAL LIABILITIES | 1,595,678 | 1,332,515 | |||||
| EQUITY | |||||||
| Share capital | 14 | 37,514 | 37,514 | ||||
| Contributed surplus | 206,333 | 206,333 | |||||
| Deficit | (51,278 | ) | (18,443 | ) | |||
| TOTAL EQUITY | 192,569 | 225,404 | |||||
| TOTAL EQUITY AND LIABILITIES | 1,788,247 | 1,557,919 | |||||
1
MINERA EXAR S.A.
STATEMENTS OF COMPREHENSIVE (LOSS)/INCOME
(Expressed in thousands of US dollars and thousands of shares, except for per share amounts)
| Years Ended December 31, | ||||||||||
| Note | 2024 | 2023 | 2022 | |||||||
| Revenue | 197,685 | 34,521 | - | |||||||
| Cost of sales | 15 | (177,980 | ) | (27,799 | ) | - | ||||
| Gross profit | 19,705 | 6,722 | - | |||||||
| Selling expenses | 16a | (9,628 | ) | (1,773 | ) | - | ||||
| General and administrative expenses | 16b | (14,628 | ) | (3,928 | ) | - | ||||
| Other income/(expenses) | 16c | 2,496 | (1,390 | ) | - | |||||
| Loss from operations | (2,055 | ) | (369 | ) | - | |||||
| Finance income | 201 | - | - | |||||||
| Finance costs | 16d | (36,459 | ) | - | - | |||||
| Foreign exchange gain | 85,889 | - | - | |||||||
| Derivative gain/(loss) | (3,713 | ) | 254,498 | (207,148 | ) | |||||
| Other losses | (3,865 | ) | - | - | ||||||
| Income/(loss) before income taxes | 39,998 | 254,129 | (207,148 | ) | ||||||
| Tax (expenses)/recovery | 22 | (72,833 | ) | (124,586 | ) | 75,280 | ||||
| Net (loss)/income | (32,835 | ) | 129,543 | (131,868 | ) | |||||
| Net (loss)/income | (32,835 | ) | 129,543 | (131,868 | ) | |||||
| (Loss)/income per share, basic and diluted | (0.05 | ) | 0.18 | (0.18 | ) | |||||
| Weighted average number of common shares outstanding - basic and diluted | 719,474 | 719,474 | 719,474 | |||||||
2
MINERA EXAR S.A.
STATEMENTS OF CHANGES IN EQUITY
(Expressed in thousands of US dollars, shares in thousands)
| Share capital | |||||||||||||||
| Number of shares (Note 17) |
Amount | Contributed surplus |
Deficit | Total equity | |||||||||||
| Balance, December 31, 2021 | 719,474 | 37,514 | 206,333 | (16,118 | ) | 227,729 | |||||||||
| Net loss | - | - | - | (131,868 | ) | (131,868 | ) | ||||||||
| Balance, December 31, 2022 | 719,474 | 37,514 | 206,333 | (147,986 | ) | 95,861 | |||||||||
| Net income | - | - | - | 129,543 | 129,543 | ||||||||||
| Balance, December 31, 2023 | 719,474 | 37,514 | 206,333 | (18,443 | ) | 225,404 | |||||||||
| Net loss | - | - | - | (32,835 | ) | (32,835 | ) | ||||||||
| Balance, December 31, 2024 | 719,474 | 37,514 | 206,333 | (51,278 | ) | 192,569 | |||||||||
3
MINERA EXAR S.A.
STATEMENTS OF CASHFLOWS
(Expressed in thousands of US dollars)
| Years ended December 31, | |||||||||
| 2024 | 2023 | 2022 | |||||||
| OPERATING ACTIVITIES | |||||||||
| Net (loss)/income | (32,835 | ) | 129,543 | (131,868 | ) | ||||
| Items not affecting cash and other items: | |||||||||
| Tax expenses/(recovery) | 72,833 | 124,586 | (75,280 | ) | |||||
| Inventory write-down/(reversal) | (4,127 | ) | 5,140 | - | |||||
| Foreign exchange (gain)/loss | (78,085 | ) | (276,040 | ) | 196,887 | ||||
| Depreciation | 20,196 | 1,776 | - | ||||||
| Financing costs | 35,154 | - | - | ||||||
| Changes in non-cash working capital items: | |||||||||
| Increase in accounts receivable | (40,459 | ) | - | - | |||||
| Increase in other receivable, prepaids and deposits | (18,850 | ) | 1,929 | (10,861 | ) | ||||
| Changes in inventories | (38,779 | ) | (125,858 | ) | (20,046 | ) | |||
| Changes in accounts payable and accrued liabilities | 15,033 | 7,064 | 21,542 | ||||||
| Changes in customer advances | (9,879 | ) | 9,879 | - | |||||
| Net cash used in operating activities | (79,798 | ) | (121,981 | ) | (19,626 | ) | |||
| INVESTING ACTIVITIES | |||||||||
| Additions to property, plant & equipment | 24,510 | (163,793 | ) | (135,882 | ) | ||||
| Payment of interest capitalized to property, plant & equipment | - | (23,639 | ) | (12,791 | ) | ||||
| Additions to mineral properties | (16,425 | ) | (37,904 | ) | (48,653 | ) | |||
| Net cash provided/(used) in investing activities | 8,085 | (225,336 | ) | (197,326 | ) | ||||
| FINANCING ACTIVITIES | |||||||||
| Proceeds from loans | 471,878 | 344,291 | 219,790 | ||||||
| Repayment of loans | (389,036 | ) | - | (700 | ) | ||||
| Net cash provided by financing activities | 82,842 | 344,291 | 219,090 | ||||||
| Effect of foreign exchange on cash | 12 | - | - | ||||||
| Change in cash and cash equivalents | 11,141 | (3,026 | ) | 2,138 | |||||
| Cash and cash equivalents - beginning of the period | 49 | 3,075 | 937 | ||||||
| Cash and cash equivalents - end of the period | 11,190 | 49 | 3,075 | ||||||
See Note 21 - Supplemental Cash Flow Information.
4
MINERA EXAR S.A.
NOTES TO THE FINANCIAL STATEMENTS
FOR THE YEAR ENDED DECEMBER 31, 2024
(Expressed in thousands of US dollars, except for per share amounts, shares in thousands)
1. NATURE OF OPERATIONS
Minera Exar Sociedad Anónima (hereinafter "Minera Exar S.A.", "Exar", or the "Company") is a corporation that was legally incorporated and registered in the Province of Mendoza, Argentina, in 2006, and subsequently registered in the Province of Jujuy, Argentina, in 2017 under Folio 374, Entry 367, Book I S.A.
The Company's principal activities are the exploration of mineral properties, the extraction and processing of minerals, and the marketing of its products. The Company holds the rights to the Cauchari-Olaroz Project, a lithium project located in Jujuy, Argentina.
The Company commenced production at the Cauchari-Olaroz Project in June 2023 and achieved commercial production on October 1, 2024.
As at December 31, 2024, the Company is controlled by Ganfeng Lithium Co. Ltd. ("Ganfeng"), which holds 46.7% of the Company's shares. Lithium Americas (Argentina) Corp. (subsequently renamed as Lithium Argentina AG) ("Lithium Argentina" or "LAR") holds 43.0%, Jujuy Energía y Minería Sociedad del Estado ("JEMSE"), a mining investment company owned by the provincial government of Jujuy holds 8.5%, and 2265866 Ontario Inc. ("Ontario Inc.") holds the remaining 1.8%.
For financing purposes, Exar receives loans from Exar Capital B.V. ("Exar Capital", or "ECBV"), a Netherlands-based company owned 51% by Ganfeng and 49% by LAR. Exar Capital, in turn, receives funding from both Ganfeng and LAR. In addition, Proyecto Pastos Grandes S.A. ("PGCo", "PPG", or "Pastos Grandes"), an Argentina-based company owned 85.1% by LAR and 14.9% by Ganfeng, provided a $65,000 loan. These loans have been used to finance the construction of the Cauchari-Olaroz Project, refinance existing debt, and support working capital needs (Note 18).
2. BASIS OF PREPARATION AND PRESENTATION
These financial statements have been prepared pursuant to Rule 3-09 of SEC Regulation S-X and in alignment with the accounting policies of Lithium Argentina, for inclusion in LAR's Form 20-F, as the Company is an equity investee of LAR.
In addition, these financial statements have been prepared in accordance with IFRS Accounting Standards as issued by the International Accounting Standards Board (IASB) (IFRS Accounting Standards) and were approved by the Board of Directors at its meeting held on June 26, 2025.
All amounts are presented in thousands of United States dollars ("US$" or "US dollars"), unless otherwise indicated. The accounting policies set forth in Note 3 have been applied consistently to all periods presented in these financial statements, unless stated otherwise.
The preparation of the financial statements, in accordance with IFRS, requires the Company's management to make certain estimates that may affect the recorded amounts of assets and liabilities, the disclosure of contingent assets and liabilities, and the income and expense figures for the reported periods. Actual results may differ from these estimates. The areas involving a higher degree of judgement or complexity, or areas where assumptions and estimates are significant to the financial statements are disclosed in Note 3.
Liquidity risk represents the risk that the Company will be unable to meet its obligations associated with its financial liabilities as they fall due. The Company manages liquidity risk by preparing an annual budget for approval by the Board of Directors and preparing cash flow and liquidity forecasts on a regular basis. The Company's objective when managing liquidity risk is to ensure that it has sufficient liquidity available to meet its liabilities when due. The Company uses cash to settle its financial obligations.
5
MINERA EXAR S.A.
NOTES TO THE FINANCIAL STATEMENTS
FOR THE YEAR ENDED DECEMBER 31, 2024
(Expressed in thousands of US dollars, except for per share amounts, shares in thousands)
2. BASIS OF PREPARATION AND PRESENTATION (continued)
The ability to do this relies on the Company generating operating cash flows, the deferral of related party loans for twelve months from July 1, 2025, which was provided by Exar Capital B.V. subsequent to year end on June 20, 2025 (Note 18), subsequent receipt of $120,000 in loan facilities in Q2 2025 (Note 26). Based on the Company's forecasted cash flows, current working capital, access to undrawn credit facilities, and the subsequent deferral of related party loans and receipt of the loan facility, the Company estimates that it will have sufficient liquidity to meet its obligations and operating requirements for at least the twelve months and accordingly these financial statements have been prepared on a going concern basis.
3. SUMMARY OF MATERIAL ACCOUNTING POLICIES
a) Foreign currency translation
i) Functional and Presentation Currency
The functional and presentation currency of the Company is US dollars. Items included in the financial statements of the Company are measured using the currency of the primary economic environment in which the entity operates (the functional currency).
ii) Transactions and Balances
Transactions denominated in currencies other than the functional currency are recorded at the exchange rates prevailing at the dates of the transactions.
Monetary assets and liabilities denominated in foreign currencies are translated into US dollars using the closing exchange rate at the reporting date. Exchange differences arising on the settlement or translation of monetary items are recognized in profit or loss from the commencement of the commercial production phase.
Non-monetary items that are measured at historical cost in a foreign currency are translated using the exchange rate at the date of the original transaction. Non-monetary items measured at fair value in a foreign currency are translated using the exchange rate at the date when the fair value was determined.
b) Financial instruments
Financial assets and liabilities are recognized when the Company becomes a party to the contractual provisions of the instrument.
On initial recognition, financial assets are classified and measured either at amortized cost or at fair value through profit or loss ("FVTPL"), depending on both the contractual cash flow characteristics of the financial asset and the business model within which it is held.
Amortized cost
Financial assets are measured at amortized cost if they are held for the collection of contractual cash flows, where those cash flows solely represent payments of principal and interest, and if the Company's intent is to hold these financial assets to collect those cash flows. Financial liabilities are measured at amortized cost unless they are required to be measured at FVTPL or are measured at FVTPL at the Company's election.
6
| MINERA EXAR S.A. NOTES TO THE FINANCIAL STATEMENTS FOR THE YEAR ENDED DECEMBER 31, 2024 (Expressed in thousands of US dollars, except for per share amounts, shares in thousands) |
3. SUMMARY OF MATERIAL ACCOUNTING POLICIES (continued)
b) Financial instruments (continued)
Financial assets are derecognized when the rights to receive cash flows from the assets expire, or when the Company transfers substantially all the risks and rewards of ownership.
Fair Value Through Profit or Loss (FVTPL)
Financial assets that do not meet the criteria for classification at amortized cost are measured at FVTPL. Financial assets measured at FVTPL are remeasured at fair value at each reporting date, with gains or losses recognized in profit or loss.
Derivative instruments
Derivative instruments, including embedded derivatives in executory contracts or financial liability contracts, are classified as FVTPL and are recorded on the balance sheet at fair value, with unrealized gains and losses recognized in profit or loss. Fair values are determined using inputs that reflect current market conditions as of the balance sheet date or the settlement date of the derivative. Embedded derivatives in non-derivative contracts are recognized separately unless they are closely related to the host contract.
c) Cash and cash equivalents
Cash and cash equivalents include cash on hand, cash held with banks, and other short-term, highly liquid investments with original maturities of 90 days or less, all of which are subject to insignificant risks of changes in value.
d) Accounts receivable and other receivables
Trade receivables and other receivables are initially recognized at fair value and subsequently at amortized cost using the effective interest rate method, less any allowance for lifetime expected credit losses.
e) Property, plant and equipment
i) Construction-in-progress
Costs directly attributable to the acquisition, construction or production of a qualifying asset that takes a substantial period of time to get ready for its intended use, including borrowing costs are capitalized as part of construction-in-progress until the asset is substantially ready for its intended use. Construction-in-progress is not depreciated.
Once an asset is available for use, construction-in-progress costs are reclassified to the appropriate category of property, plant and equipment.
ii) Plant and equipment
On initial recognition, property, plant, and equipment are valued at cost. Cost includes the purchase price and directly attributable acquisition or construction costs necessary to bring the asset to its intended location and condition for it to be capable of operating in the manner intended by the Company, including appropriate borrowing costs and foreign exchange losses or gains on borrowings, and any related cash used to construct qualifying assets, as defined under IFRS.
7
| MINERA EXAR S.A. NOTES TO THE FINANCIAL STATEMENTS FOR THE YEAR ENDED DECEMBER 31, 2024 (Expressed in thousands of US dollars, except for per share amounts, shares in thousands) |
3. SUMMARY OF MATERIAL ACCOUNTING POLICIES (continued)
ii) Plant and equipment (continued)
Capitalization of costs ceases when the asset is substantially ready for its intended use. The Company exercises judgment in determining when the asset is considered ready for use in accordance with management's intended purpose. Subsequently, property, plant, and equipment are measured at cost less accumulated depreciation and any accumulated impairment losses.
As of October 1, 2024, Minera Exar determined that commercial production had been achieved for the Cauchari Olaroz project after reaching elevated production levels for a sustained period. As a result, the Cauchari Olaroz project's assets were considered substantially ready for their intended use, and depreciation of these assets commenced on October 1, 2024.
iii) Subsequent costs
Expenditure on major maintenance or repairs includes the cost of replacement parts of assets and overhaul costs. Where an asset or part of an asset is replaced and it is probable that further future economic benefit will flow to the Company, the expenditure is capitalized and the carrying value of the replaced asset or part of an asset is derecognized. Similarly, overhaul costs associated with major maintenance are capitalized when it is probable that future economic benefit will flow to the Company and any remaining costs of previous overhauls relating to the same asset are derecognized. All other expenditures are expensed as incurred.
iv) Depreciation of Property, Plant, and Equipment and Mineral properties
Mineral properties costs are depreciated over a mine's estimated life using the units-of-production method. Under this method, capitalized costs are multiplied by the number of tonnes mined and divided by the estimated recoverable tonnes contained in proven and probable reserves. Management reviews the estimated total recoverable tonnes contained in reserves and resources annually, and when events and circumstances indicate that such a review should be made.
Once in production, depreciation commenced on the assets comprising the Lithium Carbonate Plant, the Cauchari-Olaroz General Infrastructure and the related Project Development costs. This depreciation cost is recorded as a component of production costs over the useful life of the project. Until the start of the commercial production phase, depreciation of wells and other assets in use was capitalized as part of Mineral Properties.
8
| MINERA EXAR S.A. NOTES TO THE FINANCIAL STATEMENTS FOR THE YEAR ENDED DECEMBER 31, 2024 (Expressed in thousands of US dollars, except for per share amounts, shares in thousands) |
3. SUMMARY OF MATERIAL ACCOUNTING POLICIES (continued)
iv) Depreciation of Property, Plant, and Equipment and Mineral properties (continued)
Property, plant and equipment that are currently in use are depreciated using the straight-line method over their estimated useful lives as follows:
| Equipment and machinery | Useful lives (years) |
| Field, plant and laboratory equipment | 3 - 15 years |
| Pools, wells and equipment | Maximum 40 |
| Containers / modules and other similar | 3 - 10 years |
| Transport &office equipment | Useful lives (years) |
| Furniture, fixtures, and electronic equipment | 3 - 10 years |
| Light vehicles | 3 |
| Plant | Useful lives (years) |
| Lithium Carbonate Plant | 10 - 30 years |
| Field operations equipment | Maximum 40 |
| Industrial infrastructure | 20 - 30 years |
| General infrastructure | 15 - 25 years |
Depreciation of assets corresponding to the Lithium Carbonate Plant and the General Infrastructure of Cauchari Olaroz is calculated using the straight-line method. The useful life assigned to each individual asset is determined considering factors such as operating conditions and its expected performance during its utilization cycle.
The residual values of the assets and their estimated useful lives are reviewed at the end of each fiscal year and the carrying amount is adjusted so that they do not exceed their recoverable value as mentioned in note 3f. The recoverable amount is the higher of an asset's fair value less cost of disposal and its value in use.
Also included in property, plant, and equipment are the costs of obligations for rehabilitation of disturbed areas, measured at their present value.
v) Borrowing costs
Borrowing costs directly attributable to the acquisition, construction, or production of assets that require a substantial period of time to prepare for their intended use or sale are capitalized as part of the cost of those assets. Capitalization of borrowing costs begins when borrowings are made, and activities commence to prepare the asset for its intended use. Capitalization ends when substantially all activities necessary to prepare the qualifying asset for its intended use are complete.
Interest on loans and borrowings from related parties or third parties, accrued during the development and construction stages of the project were considered costs directly attributable to the asset under development and were capitalized as part of the cost of the asset. Capitalization of interest ended when the project reached commercial production, and subsequent borrowing costs were recognized as an expense in the period in which they were incurred.
9
| MINERA EXAR S.A. NOTES TO THE FINANCIAL STATEMENTS FOR THE YEAR ENDED DECEMBER 31, 2024 (Expressed in thousands of US dollars, except for per share amounts, shares in thousands) |
3. SUMMARY OF MATERIAL ACCOUNTING POLICIES (continued)
vi) Pre-Production Sales
During the commissioning and pre-production phase of the Cauchari-Olaroz Project, the Company generated revenue from the sale of lithium carbonate prior to the commencement of commercial production on October 1, 2024. Revenue from these sales was recognized in profit or loss in accordance with the requirements of IFRS 15, when control of the product transferred to the customer and the performance obligations were satisfied.
The related production costs, including applicable depreciation and operating expenses incurred prior to the asset being available for use, were capitalized as part of the production inventory and recognized in the income statement through cost of sales based on the tons sold. These sales and associated costs were not offset against the capitalized construction-in-progress costs, as they did not meet the criteria under IAS 16 for capitalization. Specifically, they were not considered costs directly attributable to bringing the asset to the location and condition necessary for it to be capable of operating in the manner intended by management.
f) Impairment of long-term non-financial assets
Property, plant, and equipment are assessed for impairment indicators at each reporting date, or when an impairment indicator arises outside of a reporting date. For impairment assessment purposes, assets are grouped at the lowest levels where separately identifiable cash flows exist (cash-generating unit).
The Company has a single project, and therefore only one cash-generating unit. When facts indicate that the value of the CGU may not be recoverable, a recoverability analysis is performed. This is measured as the higher of its value in use and its fair value less costs to sell. Value in use is based on the estimated cash flow, discounted to its present value using a pre-tax discount rate that reflects the current market assessment of the time value of money and the risks specific to the asset or CGU.
From management's analysis, based on the aforementioned, no indicators of impairment have been identified in long-term assets.
Where the factors that lead to an impairment loss subsequently reverse, the carrying amount of the asset (or cash-generating unit) is increased to the revised estimate of its recoverable amount, but not above the carrying amount that would have been determined had no impairment loss been recognized in prior years. A reversal of an impairment loss is recognized immediately in profit or loss.
g) Mineral properties and exploration
Accounting treatment of exploration and evaluation expenditures
Exploration expenditures, excluding acquisition costs and claim maintenance costs, are expensed until the technical feasibility and commercial viability are established. These factors are assessed based on the following:
- The extent to which mineral reserves or mineral resources, as identified through a feasibility study or similar document; and
- The status of mining leases, environmental and mining permits.
10
| MINERA EXAR S.A. NOTES TO THE FINANCIAL STATEMENTS FOR THE YEAR ENDED DECEMBER 31, 2024 (Expressed in thousands of US dollars, except for per share amounts, shares in thousands) |
3. SUMMARY OF MATERIAL ACCOUNTING POLICIES (continued)
g) Mineral properties and exploration (continued)
Costs related to the acquisition and maintenance of mineral property claims, including option payments and annual fees to keep the property in good standing are capitalized and deferred on a property-by-property basis.
This also applies to exploration expenditures incurred within the geologic formation of an existing brownfield mining project, until the project is sold, abandoned, impaired, or placed into production. After recognition, the Company applies the cost model for exploration and evaluation assets.
All charges mentioned in this note, along with those incurred in subsequent stages of the project, are depreciated from the start of the production phase and over its term, as described in Note 3e.
Impairment of Exploration and Evaluation Assets
The Company applies IFRS 6 when assessing whether exploration and evaluation assets ("E&E assets") are impaired. Under IFRS 6, E&E assets are assessed for impairment when facts and circumstances suggest that the carrying amount may exceed its recoverable amount.
Management uses judgment in identifying indicators of impairment, which may include, but are not limited to:
• The period for which the Company has the right to explore in the specific area has expired or will expire in the near future, and renewal is not expected;
• Substantive expenditure on further exploration for and evaluation of mineral resources in a specific area is neither budgeted nor planned;
• Exploration and evaluation activities have not led to the discovery of commercially viable quantities of mineral resources and the Company has decided to discontinue such activities in the specific area; and
• Sufficient data exists to indicate that the carrying amount of the E&E asset is unlikely to be recovered in full from successful development or sale.
Where an indicator of impairment is identified, the asset is tested for impairment in accordance with IAS 36 - Impairment of Assets.
h) Inventory
Inventories are valued at the lower of cost or net realizable value. Costs of finished goods and work in progress include direct material costs and, where applicable, labour costs, indirect costs of transforming raw materials into finished goods, and overhead costs incurred in bringing the inventories to their current location and condition. Inventories are made up of the following categories:
- Materials: These include the inputs required for processing and production at the lithium carbonate plant. The main inputs include reagents, fuels and lubricants, packaging materials, spare parts, and personal protective equipment. These are valued at acquisition cost calculated using the weighted average price method.
- Work in progress: at acquisition cost calculated using the weighted average price method.
- Finished goods: at production cost calculated using the weighted average price method.
11
| MINERA EXAR S.A. NOTES TO THE FINANCIAL STATEMENTS FOR THE YEAR ENDED DECEMBER 31, 2024 (Expressed in thousands of US dollars, except for per share amounts, shares in thousands) |
3. SUMMARY OF MATERIAL ACCOUNTING POLICIES (continued)
h) Inventory (continued)
- Brine inventory costs consist primarily of: (i) pumping costs, which include the energy used to extract the brine and transport it to evaporation ponds; (ii) treatment costs, which include the chemicals and materials used to remove impurities from the brine and increase the lithium concentration; (iii) evaporation costs, which include the energy and materials used to evaporate water from the brine and concentrate the lithium; (iv) storage costs, which include the costs of maintaining the brine in evaporation ponds prior to processing; and (v) environmental management costs, which include the costs associated with environmental protection during brine extraction and processing.
The costs of conversion of inventories include costs directly related to the units of production, such as direct labour. They also include a systematic allocation of fixed and variable production overheads that are incurred in converting brine to lithium carbonate. Fixed production overheads are those indirect costs of production that remain relatively constant regardless of the volume of production, such as depreciation and maintenance of processing plant and ponds, processing equipment and wells, and the cost of plant management and administration. Variable overheads are those indirect costs of production that vary directly, or nearly directly, with the volume of production, such as indirect materials and labour.
Brine production costs are transferred to brine inventory-in-process at an average cost per ton based on the brine flow transferred to the processing plant. Brine unused in the production process and recovered from the plant is returned to evaporation ponds for future reprocessing.
Certain estimates, including expected brine recovery and work-in-process volumes, are calculated by engineers using available industry information. These estimates are periodically reviewed by the Company based on technical analysis and historical performance; changes in estimates are adjusted prospectively.
The carrying amount of inventory is reviewed annually to assess whether there are indicators that the carrying amount is higher than its recoverable amount. Any excess over the carrying amount is recognized as an expense during the period and/or fiscal year.
Net realizable value is the estimated selling price in the normal course of operations, less estimated completion costs and estimated costs necessary to complete the sale. If the carrying value exceeds the net realizable amount, a write-down is recognized. The write-down may be reversed in a subsequent period if the circumstances which caused the write-down no longer exist, to the extent that the related inventory has not been sold.
i) Accounts payable, other liabilities and customer advances
Accounts payable and other liabilities represent payment obligations for goods and services purchased from suppliers and other items in the ordinary course of business.
They are initially recognized at fair value and subsequently measured at amortized cost using the effective interest method. They are presented within current liabilities if payment is due within a period of less than or equal to one year.
Customer advances are valued at the original amount collected from customers. It follows the accounting treatment of deferred revenue.
12
MINERA EXAR S.A.
NOTES TO THE FINANCIAL STATEMENTS
FOR THE YEAR ENDED DECEMBER 31, 2024
(Expressed in thousands of US dollars, except for per share amounts, shares in thousands)
3. SUMMARY OF MATERIAL ACCOUNTING POLICIES (continued)
j) Provisions
Provisions are recognized when the Company has a present legal or constructive obligation as a result of a past event and it is probable that an outflow of economic benefits will be required to settle the obligation, and a reliable estimate of the amount of the obligation can be made.
Provisions are determined at the present value of the expected future cash flows required to meet the obligation, taking into account the best information available at the date of preparation of the financial statements, and are re-estimated at each closing date to the extent this discount is significant. The discount rate used to determine the present value is a pre-tax rate that reflects current market assessment of the time value of money and the risks specific to the liability.
The Company's provisions for reclamation and closure costs represent management's best estimate of the present value of the future cash outflows required to settle the liabilities, which reflects estimates of future costs, inflation, and movements in foreign exchange rates, and assumptions of risks associated with the future cash outflows and the applicable interest rates for discounting the future cash outflows that reflect current market assessments of the time value of money and the risks specific to the liability. Changes in the above estimates and assumptions can result in changes to the provisions recognized by the Company.
k) Loans and borrowings
Loans and borrowings are recognized initially at fair value, net of transaction costs incurred. Loans and borrowings are subsequently measured at amortized cost, calculated using the effective interest method.
Any difference between the proceeds (net of transaction costs) and the redemption value is recognized in profit or loss over the period of the borrowings using the effective interest method.
When loan facility establishment fees and other borrowing costs are paid, they are recognized as transaction costs if it's probable that some or all of the facility or borrowings will be drawn down. In such cases, these fees are deferred until drawdown occurs. At that point, the transaction costs are included in the carrying value of the drawn amount and amortized using the effective interest method.
If there's no evidence that some or all of the facility and borrowings will likely be drawn down, the fee is capitalized as a prepayment for liquidity services. This capitalized amount is then amortized over the period the related loan facility is available to the Company.
l) Share Capital
The share capital has been expressed at its historical nominal value, maintaining its balance in Argentine pesos for legal purposes.
m) Revenue recognition
In accordance with IFRS 15 Revenue from Contracts with Customers, the Company has classified the main contracts with customers as detailed below:
Revenue from the sale of lithium carbonate
Revenue from contracts with customers for the sale of lithium carbonate is recognized in accordance with IFRS 15 - Revenue from Contracts with Customers, when all of the following criteria are met:
13
MINERA EXAR S.A.
NOTES TO THE FINANCIAL STATEMENTS
FOR THE YEAR ENDED DECEMBER 31, 2024
(Expressed in thousands of US dollars, except for per share amounts, shares in thousands)
3. SUMMARY OF MATERIAL ACCOUNTING POLICIES (continued)
m) Revenue recognition (continued)
• Identification of the contract with a customer: A contract is an agreement between two or more parties that creates enforceable rights and obligations.
• Identification of the performance obligations: Performance obligations represent promises within the contract to transfer goods or services to the customer.
• Determination of the transaction price: The transaction price is the amount of consideration to which the Company expects to be entitled in exchange for transferring the promised goods.
• Allocation of the transaction price: The transaction price is allocated to each performance obligation identified in the contract based on the relative standalone selling prices of the goods or services.
• Recognition of revenue: Revenue is recognized when (or as) the Company satisfies a performance obligation by transferring control of a good to the customer.
Under IFRS 15 revenue from contracts with customers is recognized when control transfers to the customer. Control over lithium carbonate is transferred to the customer when the product is considered to be physically delivered to the customer under the terms of the customer contract. This is typically when the lithium carbonate has been placed on board a vessel for shipment or delivered to a location specified by the customer. Revenue is calculated at the fair value of the consideration received or receivable, taking into account the estimated amount of any discounts, thereby determining the net amounts.
Revenue is recognized based on the accrual method and comes primarily from the sale of lithium carbonate in accordance with the terms agreed upon in the contracts.
4. CHANGES IN ACCOUNTING STANDARDS
a) New accounting standards, amendments and interpretations issued by the IASB that are effective as of December 31, 2024 and have been adopted by the Company
The Company has implemented the following rules and/or amendments for the first time as of January 1, 2024:
Classification of liabilities as current or non-current and non-current liabilities with commitments - Amendments to IAS 1:
In October 2022, the IASB issued amendments to IAS 1, Presentation of Financial Statements titled non-current liabilities with covenants. These amendments sought to improve the information that an entity provides when its right to defer settlement of a liability is subject to compliance with covenants within 12 months after the reporting period.
These amendments to IAS 1 override but incorporate the previous amendments, Classification of liabilities as current or non-current, issued in January 2020, which clarified that liabilities are classified as either current or non-current, depending on the rights that exist at the end of the reporting period. Liabilities should be classified as non-current if a company has a substantive right to defer settlement for at least 12 months at the end of the reporting period. The Company adopted these amendments effective January 1, 2024. The adoption had no material impact on the Company's financial statements.
There are other IFRS Accounting Standards or IFRIC Interpretations effective for the years beginning on or after January 1, 2024, that have a material impact on the Company's financial statements.
14
MINERA EXAR S.A.
NOTES TO THE FINANCIAL STATEMENTS
FOR THE YEAR ENDED DECEMBER 31, 2024
(Expressed in thousands of US dollars, except for per share amounts, shares in thousands)
4. CHANGES IN ACCOUNTING STANDARDS (continued)
b) New published standards, amendments, and interpretations that have not yet entered into force and have not been adopted early:
Amendments to IAS 21 - Lack of exchangeability
In August 2023, the IASB amended IAS 21 to add requirements to assist entities in determining whether a currency is convertible into another currency and the spot exchange rate to use when it is not. Prior to these amendments, IAS 21 established the exchange rate to use when the lack of exchangeability is temporary, but not what to do when the lack of exchangeability is not temporary.
These new requirements will apply to annual reporting periods beginning on or after January 1, 2025. Early application is permitted.
The Company estimates that their application will not have an impact on the Company's operating results or financial position.
Amendments to the Classification and Measurement of Financial Instruments - Amendments to IFRS 9 and IFRS 7.
In May 2024, the IASB issued amendments to IFRS 9 and IFRS 7, Amendments to the Classification and Measurement of Financials Instruments. These amendments updated classification and measurement requirements in IFRS 9 Financial Instruments and related disclosure requirements in IFRS 7 Financial Instruments: Disclosures.
The IASB clarified the recognition and derecognition date of certain financial assets and liabilities, and amended the requirements related to settling financial liabilities using an electronic payment system. It also clarified how to assess the contractual cash flow characteristics of financial assets in determining whether they meet the solely payments of principal and interest criterion, including financial assets that have environmental, social and corporate governance (ESG)-linked features and other similar contingent features. These amendments require additional disclosures for financial instruments with contingent features that do not relate directly to basic lending risks and costs and amended disclosures relating to equity instruments designated at fair value through other comprehensive income.
The amendments are effective for annual periods beginning on or after January 1, 2026. Early adoption is permitted, with an option to early adopt the amendments for contingent features only. The Company is currently assessing the impact of these amendments on its financial statements and has not yet applied.
The Company estimates that their application will not have an impact on the Company's operating results or financial position.
IFRS 18 Presentation and Disclosure in Financial Statements:
In April 2024, the IASB issued IFRS 18, Presentation and Disclosure in Financial Statements which will replace IAS 1, Presentation of Financial Statements. IFRS 18 introduces new requirements on presentation within the statement of profit or loss, including specified totals and subtotals.
It also requires disclosure of management-defined performance measures and includes new requirements for aggregation and disaggregation of financial information based on the identified 'roles' of the primary financial statements and the notes.
15
MINERA EXAR S.A.
NOTES TO THE FINANCIAL STATEMENTS
FOR THE YEAR ENDED DECEMBER 31, 2024
(Expressed in thousands of US dollars, except for per share amounts, shares in thousands)
4. CHANGES IN ACCOUNTING STANDARDS (continued)
b) New published standards, amendments, and interpretations that have not yet entered into force and have not been adopted early (continued)
In addition, there are consequential amendments to other accounting standards; some requirements previously included in IAS 1 have been moved to IAS 8 and limited amendments have been made to IAS 7 and IAS 34. IFRS 18 is effective for the reporting period beginning on or after January 1, 2027, with early application permitted. Retrospective application is required in both annual and interim financial statements. The Company is currently assessing the impact of this standard on its financial statements and has not yet applied it.
5. ESTIMATION UNCERTAINTY AND ACCOUNTING POLICY JUDGMENTS
The preparation of financial statements in conformity with IFRS requires the Company's management to make judgements, estimates and assumptions that affect the application of accounting policies and the reported amount of assets and liabilities and contingent assets and liabilities, as well as the income and expenses recorded for the year. Actual results may differ from these estimates.
The Company has identified certain key accounting estimates on which its financial condition and results of operations depend. These accounting estimates typically involve analysis or are based on subjective judgments or decisions that require management to make estimates and assumptions that affect the amounts reported in the financial statements. The Company's estimates are generally based on historical information and other assumptions considered reasonable under the circumstances.
Significant areas requiring the use of Management assumptions, estimates and judgements include determination of commercial production, impairment assessment of assets, recognition of contingent liabilities, estimation of decommissioning and environmental remediation provisions, and mineral reserve and resource estimation. Actual results may differ from these estimates.
Furthermore, estimates typically require adjustment based on changing circumstances and the receipt of more recent or accurate information on which the estimates were made. Outlined below are some of the areas which require Management to make significant judgements, estimates and assumptions.
a) Determination of commercial production for the Cauchari Olaroz project
Judgment is a requirement in determining whether a project's assets are available for use (referred to as "commercial production"). In making this determination, management considers specific facts and circumstances, including, but not limited to, whether the product produced by the plant is saleable, the completion of a reasonable commissioning period, and the achievement of consistent operating results at a predetermined level of design capacity for a reasonable period of time.
The Company determined that commercial production was achieved at the Cauchari-Olaroz project as of October 1, 2024. As a result, the project's assets were considered ready for their intended use, and depreciation of these assets commenced on October 1, 2024.
b) Assessment of impairment indicators
The assessment of the recoverability of recorded non-financial long-lived assets subject to IAS 36, including property, plant and equipment and mineral development assets, requires significant judgment. The Company performs an impairment indicator assessment annually and if there is an impairment indicator, the recoverable value of these assets will be assessed.
16
MINERA EXAR S.A.
NOTES TO THE FINANCIAL STATEMENTS
FOR THE YEAR ENDED DECEMBER 31, 2024
(Expressed in thousands of US dollars, except for per share amounts, shares in thousands)
5. ESTIMATION UNCERTAINTY AND ACCOUNTING POLICY JUDGMENTS (continued)
b) Assessment of impairment indicators (continued)
Judgment is applied when evaluating whether internal or external factors suggest that an asset may be impaired. These indicators may include changes in market conditions, operational performance, commodity prices, or project economics.
If impairment indicators are identified, the Company estimates the recoverable amount of the asset, which is the higher of fair value less costs of disposal (FVLCD) and value in use (VIU). The determination of the recoverable amount involves significant estimation, including assumptions related to:
• Future lithium prices and sales volumes,
• Operating costs and capital expenditures,
• Discount rates reflecting current market assessments of the time value of money and risks specific to the asset,
• Inflation and foreign exchange rates, and
• Expected life of mine or project plans.
These estimates are inherently uncertain and may change materially over time as market conditions, technology, or other external factors evolve.
c) Contingent liabilities
Contingent liabilities can relate to certain claims, lawsuits, and other legal proceedings arising in the ordinary course of business, including claims from suppliers and employees. Company management periodically reviews and exercises significant judgement in assessing whether the outflow of economic benefits has become probable, and the amount can be reasonably estimated, thereby requires the Company to record the present obligations.
d) Decommissioning provision
When title conditions or other rights to use the property, including rights to conduct mining activities, require reclamation activities during the course of use of the property, the costs of such reclamation are expensed as incurred or capitalized depending on the stage of the mining process. In the case of the Company, these expenses have been capitalized, with a corresponding change to the carrying amounts of the related mineral properties under property, plant, and equipment.
If, due to current or past activities, there is an obligation to perform remediation work in the future, a provision for reclamation and restoration is recognized, which includes the mine closure phase. These provisions include costs associated with reclamation, plant closure, waste site closure, and control activities, among others. These costs have been primarily estimated based on current costs, current legal requirements, and current technology. Changes in estimates are treated prospectively. The liability associated with this obligation is valued at its discounted value at a rate of 10.54%.
During the current fiscal year, the Company revised its estimate of the environmental remediation obligation based on the best estimate of the discounted future remediation costs in accordance with the latest remediation plan. This revision resulted in a net increase of $872 in the related liability, with a corresponding adjustment to the carrying amount of property, plant and equipment.
The liability for this item as of December 31, 2024, was $1,369 (December 31, 2023 - $496).
17
MINERA EXAR S.A.
NOTES TO THE FINANCIAL STATEMENTS
FOR THE YEAR ENDED DECEMBER 31, 2024
(Expressed in thousands of US dollars, except for per share amounts, shares in thousands)
5. ESTIMATION UNCERTAINTY AND ACCOUNTING POLICY JUDGMENTS (continued)
e) Mineral reserve and resource estimation
Estimates of proven and probable mineral reserves and resources are used in the calculation of depreciation and depletion of mineral properties and certain plant and equipment, when applicable, of the recoverable amounts of CGUs, and for forecasting the timing of reclamation and closure cost expenditures.
Mineral reserves and resources have been estimated in accordance with the requirements of S-K 1300 and NI 43-101 and were last updated effective as of December 31, 2024. They are based on information from drilling, geological studies, metallurgical testing, and other relevant technical and economic factors.
Significant estimation is involved in determining the reserve and resources including:
• Future mineral price: Based on market analysis and sales contracts.
• Capital and operating costs: Including projections of mining, processing, and transportation costs.
• Metallurgical recovery factors: Determined from laboratory testing and operating data.
• Geological and hydrogeological conditions: Evaluated through technical studies and exploration drilling.
• Environmental regulations and permits: These may affect the feasibility of extracting and exploiting the resource.
Since these estimates are based on technical data and judgments, they may be subject to future changes due to market price fluctuations, technological advances, changes in regulatory standards, or revisions to operating parameters. Any adjustment to reserve estimates may have a material impact on the financial statements, affecting asset depreciation, the recognition of environmental obligations, and the viability of mining projects.
Management periodically reviews these estimates and, if significant changes are identified, adjusts the carrying amounts of mining assets and associated liabilities in accordance with the requirements of applicable IFRS.
6. CASH AND CASH EQUIVALENTS
| As at December 31, | ||||||
| 2024 | 2023 | |||||
| Cash | 3,642 | 49 | ||||
| Cash equivalents | 7,548 | - | ||||
| Total cash and cash equivalents | 11,190 | 49 | ||||
As at December 31, 2024, $2,614 of cash and cash equivalents was held in US dollars (December 31, 2023 - $36), and $8,576 held in Argentine Pesos (December 31, 2023 - $13). As of December 31, 2024, and 2023, the company had no restricted cash and cash equivalents.
18
MINERA EXAR S.A.
NOTES TO THE FINANCIAL STATEMENTS
FOR THE YEAR ENDED DECEMBER 31, 2024
(Expressed in thousands of US dollars, except for per share amounts, shares in thousands)
7. OTHER RECEIVABLES AND PREPAIDS
Current
| As at December 31, | |||||||
| Note | 2024 | 2023 | |||||
| Advances to suppliers and other advances | 14,871 | 11,399 | |||||
| Due from related parties | 18a | 232 | 1,225 | ||||
| Other receivables | 4,085 | 2,296 | |||||
| Total other current receivables | 19,188 | 14,920 | |||||
Non-current
| As at December 31, | |||||||
| 2024 | 2023 | ||||||
| VAT and other taxes recoverable | 11,610 | 17 | |||||
| Due from related parties | 18a | 3,274 | 2,558 | ||||
| Other receivable | 3,298 | 1,025 | |||||
| Total other non-current receivables | 18,182 | 3,600 | |||||
8. INVENTORY
| As at December 31, | ||||||
| 2024 | 2023 | |||||
| Ponds and plant in-circuit inventories | 133,960 | 142,347 | ||||
| Finished goods | 20,557 | 18,438 | ||||
| Consumables | 22,599 | 33,223 | ||||
| Supplies | 64,471 | 26,499 | ||||
| Total inventory | 241,587 | 220,507 | ||||
As of December 31, 2024, the Company recognized a write-down of $1,013 (2023 - $5,140) to reduce carrying value of finished goods to its net realizable value. During the year 2024, the Company reversed the $5,140 write-down recognized in 2023, following a recovery in net realizable value. A subsequent decline in value led to a new write-down of $1,013 as of year-end. The net impact on the statement of comprehensive loss for the year ended December 31, 2024, was a gain of $4,127 related to inventory valuation changes. This write-down was primarily due to a decline in the expected selling price, as the product did not meet battery-grade quality specifications.
9. MINERAL PROPERTIES
| Exploration assets | Mineral Properties costs | Total | |||||||
| Cost | |||||||||
| As at December 31, 2022 | 34,315 | 109,954 | 144,269 | ||||||
| Additions | 9,762 | 33,089 | 42,851 | ||||||
| As at December 31, 2023 | 44,077 | 143,043 | 187,120 | ||||||
| Additions | 6,390 | 10,035 | 16,425 | ||||||
| As at December 31, 2024 | 50,467 | 153,078 | 203,545 |
19
| MINERA EXAR S.A. NOTES TO THE FINANCIAL STATEMENTS FOR THE YEAR ENDED DECEMBER 31, 2024 (Expressed in thousands of US dollars, except for per share amounts, shares in thousands) |
9. MINERAL PROPERTIES (continued)
| Exploration assets | Mineral Properties costs |
Total | |||||||
| Accumulated depreciation | |||||||||
| As at December 31, 2022 | - | - | - | ||||||
| As at December 31, 2023 | - | - | - | ||||||
| Depreciation for the period | - | 713 | 713 | ||||||
| As at December 31, 2024 | - | 713 | 713 | ||||||
| Exploration assets | Mineral Properties costs |
Total | |||||||
| Net book value | |||||||||
| As at December 31, 2024 | 50,467 | 152,365 | 202,832 | ||||||
| As at December 31, 2023 | 44,077 | 143,043 | 187,120 |
Exploration assets are accounted for in accordance with IFRS 6 and include expenditures related to exploration activities in wells located in surrounding areas, as well as exploration expenditures incurred within the geologic formation of an existing project. Mineral properties costs are accounted for under IAS 16 and include capitalized expenditures that are directly attributable to the development and construction of mineral assets after the technical feasibility and commercial viability of extracting the mineral resource have been established. These include direct construction costs, and other directly attributable expenditures necessary to prepare the asset for its intended use. Capitalization of development costs ceases once the asset is substantially ready for its intended use, at which point depreciation begins.
10. PROPERTY, PLANT AND EQUIPMENT
| Plant | Equipment & machinery |
Construction in progress |
Transport & office equipment |
Total | |||||||||||
| Cost | |||||||||||||||
| As at December 31, 2022 | - | 37,814 | 877,496 | 1,399 | 916,709 | ||||||||||
| Additions | - | 7,949 | 300,841 | 560 | 309,350 | ||||||||||
| Transfers to inventory | - | - | (61,080 | ) | - | (61,080 | ) | ||||||||
| Transfers | 875,710 | - | (875,710 | ) | - | - | |||||||||
| As at December 31, 2023 | 875,710 | 45,763 | 241,547 | 1,959 | 1,164,979 | ||||||||||
| Additions | 42,057 | 4,664 | 114,962 | 425 | 162,108 | ||||||||||
| Transfers to inventory | - | (13,735 | ) | - | - | (13,735 | ) | ||||||||
| Disposals | - | - | - | (37 | ) | (37 | ) | ||||||||
| Transfers | 313,851 | (14,173 | ) | (299,678 | ) | - | - | ||||||||
| As at December 31, 2024 | 1,231,618 | 22,519 | 56,831 | 2,347 | 1,313,315 |
20
| MINERA EXAR S.A. NOTES TO THE FINANCIAL STATEMENTS FOR THE YEAR ENDED DECEMBER 31, 2024 (Expressed in thousands of US dollars, except for per share amounts, shares in thousands) |
10. PROPERTY, PLANT AND EQUIPMENT (continued)
| Plant | Equipment & machinery |
Construction in progress |
Transport & office equipment |
Total | |||||||||||
| Accumulated depreciation | |||||||||||||||
| As at December 31, 2022 | - | 6,964 | - | 898 | 7,862 | ||||||||||
| Depreciation for the period | 22,376 | 2,660 | - | 358 | 25,394 | ||||||||||
| Disposals | - | - | - | - | 0 | ||||||||||
| As at December 31, 2023 | 22,376 | 9,624 | - | 1,256 | 33,256 | ||||||||||
| Depreciation for the period | 21,037 | 3,674 | - | 576 | 25,287 | ||||||||||
| Disposals | - | - | - | (37 | ) | (37 | ) | ||||||||
| As at December 31, 2024 | 43,413 | 13,298 | - | 1,795 | 58,506 |
| Plant | Equipment & machinery |
Construction in progress |
Transport & office equipment |
Total | |||||||||||
| Net book value | |||||||||||||||
| As at December 31, 2024 | 1,188,205 | 9,221 | 56,831 | 552 | 1,254,809 | ||||||||||
| As at December 31, 2023 | 853,334 | 36,139 | 241,547 | 703 | 1,131,723 |
During the year ended December 31, 2024, capitalized borrowing costs were $86,136 (2023 - $183,055) which includes accrued interest, foreign exchange loss/gain and the blue-chip swap gain related to the loans payable to Exar Capital B.V. and PGCo. The capitalization of borrowing costs relating to Cauchari-Olaroz ceased effective October 1, 2024, upon Cauchari-Olaroz reaching commercial production.
During the year ended December 31, 2024, the Company reclassified total costs of $299,678 (December 31, 2023 - $875,710) from construction-in-progress to plant and equipment, respectively, which included costs reclassified on completion of commissioning of certain equipment and upon Cauchari-Olaroz reaching commercial production on October 1, 2024. Depreciation and depletion of mineral properties at Cauchari-Olaroz commenced after reaching commercial production.
11. ACCOUNTS PAYABLE AND ACCRUED LIABILITIES
| Current | As at December 31, | |||||
| 2024 | 2023 | |||||
| Due to related parties (Note 18a) | 41,158 | 25,897 | ||||
| Trade payables | 16,825 | 36,498 | ||||
| Other provisions and accrued liabilities | 7,970 | 4,961 | ||||
| Total accounts payable and accrued liabilities | 65,953 | 67,356 | ||||
| Non-current | As at December 31, | |||||
| 2024 | 2023 | |||||
| Due to related parties (Note 18a) | 4,137 | 4,309 | ||||
| Other payables | 465 | 595 | ||||
| Total accounts payable and accrued liabilities | 4,602 | 4,904 | ||||
21
| MINERA EXAR S.A. NOTES TO THE FINANCIAL STATEMENTS FOR THE YEAR ENDED DECEMBER 31, 2024 (Expressed in thousands of US dollars, except for per share amounts, shares in thousands) |
12. TAXES PAYABLE
| As at December 31, | ||||||
| 2024 | 2023 | |||||
| Tax withholdings payable | 5,207 | 506 | ||||
| Other taxes payable | 1,029 | 448 | ||||
| Total taxes payable | 6,236 | 954 | ||||
13. LOANS
| Current | As at December 31, | |||||
| 2024 | 2023 | |||||
| Related party loans (Note 18) | 637,685 | 328,569 | ||||
| Negotiable bonds (Note 23) | 325 | - | ||||
| Bank loans | 161,140 | 314,449 | ||||
| Total current debt | 799,150 | 643,018 | ||||
| Non-Current | ||||||
| Related party loans (Note 18) | 570,527 | 544,526 | ||||
| Negotiable bonds (Note 23) | 49,539 | - | ||||
| Bank loans | - | 35,913 | ||||
| Total non-current debt | 620,066 | 580,439 | ||||
CHANGES IN LOANS
| As at December 31, | ||||||
| 2024 | 2023 | |||||
| Beginning balance | 1,223,457 | 1,029,719 | ||||
| Proceeds from new loans | 471,878 | 344,291 | ||||
| Accrued interests | 118,502 | 83,386 | ||||
| Principal payments | (361,167 | ) | - | |||
| Interest settled/paid | (27,869 | ) | (23,639 | ) | ||
| Currency translation effects | (5,585 | ) | (210,300 | ) | ||
| Ending balance | 1,419,216 | 1,223,457 | ||||
14. SHARE CAPITAL
The share capital is $37,514 and is represented by 719,474 ordinary, registered, non-transferable shares, with a par value of 1 Argentine pesos ("ARS$") and with the right to one vote per share.
22
| MINERA EXAR S.A. NOTES TO THE FINANCIAL STATEMENTS FOR THE YEAR ENDED DECEMBER 31, 2024 (Expressed in thousands of US dollars, except for per share amounts, shares in thousands) |
14. SHARE CAPITAL (continued)
| CAPITAL COMPOSITION | ||||
| SHARES | Subscribed, integrated and registered |
|||
| Amount | Type | Number of votes per share |
Nominal value ARS$ |
|
| 322,576 | Class A | 1 vote | 1 | 719,474 |
| 61,155 | Class B | 1 vote | 1 | |
| 335,743 | Class C | 1 vote | 1 | |
Class A shares are held by Lithium Argentina and Ontario Inc., Class B shares are held by JEMSE, and Class C shares are held by Ganfeng.
15. COST OF SALES
| Years Ended December 31, | |||||||||
| 2024 | 2023 | 2022 | |||||||
| Operating costs | $ | 79,013 | $ | 93,830 | $ | - | |||
| Reagents and other consumables | 67,020 | 35,590 | - | ||||||
| Salaries and benefits | 31,454 | 21,166 | - | ||||||
| Professional services and other costs | 11,245 | 17,239 | - | ||||||
| Depreciation | 22,968 | 20,447 | - | ||||||
| Taxes and insurance cost | 1,377 | 313 | - | ||||||
| Change in inventories before inventory write-down | (30,970 | ) | (165,926 | ) | - | ||||
| Inventory write-down/(reversal of write-down) | (4,127 | ) | 5,140 | - | |||||
| Total cost of sales | $ | 177,980 | $ | 27,799 | $ | - | |||
16. OTHER ITEMS
a) SELLING EXPENSES
| Years ended December 31, | |||||||||
| 2024 | 2023 | 2022 | |||||||
| Export duties | 6,953 | 1,320 | - | ||||||
| Mining royalties | 2,675 | 453 | - | ||||||
| Total selling expenses | 9,628 | 1,773 | - | ||||||
23
| MINERA EXAR S.A. NOTES TO THE FINANCIAL STATEMENTS FOR THE YEAR ENDED DECEMBER 31, 2024 (Expressed in thousands of US dollars, except for per share amounts, shares in thousands) |
16. OTHER ITEMS (continued)
b) GENERAL AND ADMINISTRATION EXPENSES
| Years ended December 31, | |||||||||
| 2024 | 2023 | 2022 | |||||||
| Professional fees | 5,014 | 499 | - | ||||||
| Salaries and benefits | 2,860 | 2,059 | - | ||||||
| Office and administration | 5,216 | 216 | - | ||||||
| Other | 1,538 | 1,154 | - | ||||||
| Total general and administration expenses | 14,628 | 3,928 | - | ||||||
c) OTHER OPERATING INCOME AND EXPENSE
| Years ended December 31, | |||||||||
| 2024 | 2023 | 2022 | |||||||
| Plant idle costs | - | (1,516 | ) | - | |||||
| Export refund | 2,496 | 126 | - | ||||||
| Total other operating (loss)/income | 2,496 | (1,390 | ) | - | |||||
d) FINANCE COSTS
| Years ended December 31, | |||||||||
| 2024 | 2023 | 2022 | |||||||
| Related party interest - ECBV | (31,991 | ) | - | - | |||||
| Related party interest - PPG | (1,518 | ) | - | - | |||||
| Third party loan interest | (1,645 | ) | - | - | |||||
| Negotiable bonds interest | (548 | ) | - | - | |||||
| Other finance cost | (757 | ) | - | - | |||||
| Finance costs | (36,459 | ) | - | - | |||||
17. SEGMENTED INFORMATION
Operating segments are reported in a manner consistent with the internal reporting to the executive leadership team who act as the operating decision-makers. The Company operates in a single operating segment and in a single geographic area. The Company has a single project called Cauchari-Olaroz, which is in the commercial production phase as of October 1, 2024. All revenues come from the extraction of minerals from this project, which is located in the province of Jujuy, its only geographic segment, and its assets are located there.
24
MINERA EXAR S.A.
NOTES TO THE FINANCIAL STATEMENTS
FOR THE YEAR ENDED DECEMBER 31, 2024
(Expressed in thousands of US dollars, except for per share amounts, shares in thousands)
18. RELATED PARTIES
a) Related party balances
| As of December 31, 2024 | |||||||||||||||
| Related party | Accounts receivable |
Other receivables |
Accounts payable and other liabilities |
Customer advances |
Loans | ||||||||||
| Ganfeng | 19,079 | 1,659 | (5 | ) | - | - | |||||||||
| Ontario Inc. | - | 62 | (4 | ) | - | - | |||||||||
| Exar Capital* | - | - | (33,292 | ) | - | (1,131,824 | ) | ||||||||
| Lithium Argentina | 21,152 | 1,553 | (427 | ) | - | - | |||||||||
| Pastos Grandes | - | - | - | - | (76,388 | ) | |||||||||
| Litio Minera Argentina S.A. | 228 | - | - | - | - | ||||||||||
| Servicios Mineros Cauchari S.A. | - | 232 | (4,680 | ) | - | - | |||||||||
| Grupo Minero Los Boros | - | - | (6,887 | ) | - | - | |||||||||
| As at December 31, 2024 | 40,459 | 3,506 | (45,295 | ) | - | (1,208,212 | ) | ||||||||
| As of December 31, 2023 | |||||||||||||||
| Related party | Accounts receivable | Other receivables |
Accounts payable and other liabilities |
Customer advances | Loans | ||||||||||
| Ganfeng | - | 1,293 | (97 | ) | (3,206 | ) | - | ||||||||
| Ontario Inc. | - | 48 | (4 | ) | - | - | |||||||||
| Exar Capital* | - | - | (22,235 | ) | - | (873,095 | ) | ||||||||
| Lithium Argentina | - | 1,216 | (427 | ) | (6,673 | ) | - | ||||||||
| Servicios Mineros Cauchari S.A. | - | 1,226 | (1,186 | ) | - | - | |||||||||
| Grupo Minero Los Boros | - | - | (6,257 | ) | - | - | |||||||||
| As at December 31, 2023 | - | 3,783 | (30,206 | ) | (9,879 | ) | (873,095 | ) | |||||||
(*) As at December 31, 2024, Minera Exar has payables to Exar Capital amounting to $33,292 (2023 - $22,235), primarily related to procurement support. Exar Capital facilitates the purchase of certain materials and supplies on behalf of Minera Exar. These transactions are settled by Minera Exar upon delivery of the goods and receipt of supplier documentation.
25
| MINERA EXAR S.A. NOTES TO THE FINANCIAL STATEMENTS FOR THE YEAR ENDED DECEMBER 31, 2024 (Expressed in thousands of US dollars, except for per share amounts, shares in thousands) |
18. RELATED PARTIES (continued)
b) Related party transactions
| Year ended December 31, 2024 | ||||||||||||||||||
| Related party | Loans obtained |
Collection | Interest settled |
Interest accrued |
Sales /purchase |
Others | ||||||||||||
| Ganfeng | - | (80,604 | ) | - | - | 102,890 | 458 | |||||||||||
| Ontario Inc. | - | - | - | - | - | 14 | ||||||||||||
| Exar Capital | (187,384 | ) | - | 23,697 | (113,364 | ) | (33,293 | ) | 40,557 | |||||||||
| Lithium Argentina | - | (66,970 | ) | - | - | 94,795 | 337 | |||||||||||
| Pastos Grandes | (65,000 | ) | - | - | (2,355 | ) | - | (9,034 | ) | |||||||||
| Litio Minera Argentina S.A. | - | - | - | - | - | 228 | ||||||||||||
| Servicios Mineros Cauchari S.A. | - | - | - | - | (22,313 | ) | 17,826 | |||||||||||
| Total | (252,384 | ) | (147,574 | ) | 23,697 | (115,719 | ) | 142,079 | 50,386 | |||||||||
| Year ended December 31, 2023 | ||||||||||||||||||
| Related party | Loans obtained |
Collection | Interest payment |
Interest accrued |
Sales /purchase |
Others | ||||||||||||
| Ganfeng | - | (19,438 | ) | - | - | 19,438 | (3,221 | ) | ||||||||||
| Ontario Inc. | - | - | - | - | - | 3 | ||||||||||||
| Exar Capital | (74,010 | ) | - | 23,639 | (83,357 | ) | (22,235 | ) | 225,270 | |||||||||
| Lithium Argentina | - | (15,083 | ) | - | - | 15,083 | (6,604 | ) | ||||||||||
| Servicios Mineros Cauchari S.A. | - | - | - | - | (16,062 | ) | 16,101 | |||||||||||
| Total | (74,010 | ) | (34,521 | ) | 23,639 | (83,357 | ) | (3,776 | ) | 231,549 | ||||||||
| Year ended December 31, 2022 | |||||||||||||||||||||
| Related party | Payments on behalf of |
Loans obtained |
Payments (compensations) to suppliers |
Interest payment |
Purchases | Advance payments |
Interest accrued |
||||||||||||||
| Ganfeng | 312 | - | - | - | - | - | - | ||||||||||||||
| Ontario Inc. | 12 | - | - | - | - | - | - | ||||||||||||||
| Exar Capital | 1 | (149,090 | ) | 562 | 12,791 | (24,757 | ) | - | (58,614 | ) | |||||||||||
| Lithium Argentina | 287 | - | - | - | - | - | - | ||||||||||||||
| Servicios Mineros Cauchari S.A. | - | - | 2,377 | - | (8,649 | ) | 12,635 | - | |||||||||||||
| Total | 612 | (149,090 | ) | 2,939 | 12,791 | (33,406 | ) | 12,635 | (58,614 | ) | |||||||||||
26
| MINERA EXAR S.A. NOTES TO THE FINANCIAL STATEMENTS FOR THE YEAR ENDED DECEMBER 31, 2024 (Expressed in thousands of US dollars, except for per share amounts, shares in thousands) |
18. RELATED PARTIES (continued)
c) Related parties loan agreements
Exar Capital B.V.
In order to secure the necessary financing for the construction and development of the lithium mine and its corresponding processing plant in Argentina, the Company has entered into a series of loan agreements with Exar Capital B.V.
During 2023 and 2024, the Company received total disbursements from Exar Capital B.V. amounting to $74,010 and $187,384, respectively. As of December 31, 2024, capital disbursements made by Exar Capital B.V. amounted to $761,784 (December 31, 2023 - $574,400).
Pastos Grandes S.A. projects: (14.9% owned by Ganfeng Lithium's and 85.1% owned by Lithium Argentina)
On July 19, 2024, the Company entered into a loan agreement with Proyecto Pastos Grandes S.A. (PGCo) for a total amount of $65,000, maturing within five years of each disbursement received. During the current fiscal year, it received a disbursement of $15,200 in July 2024 and $49,800 in August 2024.
The loans are denominated in USD but repayable in pesos at the exchange rate at the date of repayment. Both the interest and principal mature five years from the date of each disbursement.
d) Other agreements with related parties
Additionally, the Company has entered into the following transactions with controlled companies related to its president, who is also a director of Lithium Argentina:
- Los Boros Option Agreement, entered into with Grupo Minero Los Boros on March 28, 2016, for the transfer of ownership of certain mining properties comprising a portion of the Cauchari-Olaroz project to the Company (see Note 20).
- Construction services contract for the Cauchari-Olaroz project with Magna Construcciones S.R.L., amounting to $534 during the year ended December 31, 2024 (December 31, 2023 - $2,998).
- Salt harvesting service contract with Servicios Mineros Cauchari S.A. (in which Magna holds a 49% stake), the purpose of which is to extract the salts deposited in the pools according to a harvesting program that meets operational requirements and transport them to storage points (stockpiles). As of December 31, 2024, the transaction amount is $22,313 (December 31, 2023 - $16,062.
- Subsequent to year end on June 20, 2025, the Company received irrevocable commitments from Ganfeng and Lithium Argentina, the ultimate shareholders of Exar Capital B.V. and the lender of Exar Capital B.V., that they would not seek the repayment of the amounts advanced or loaned to the Company for the twelve months from July 1, 2025.
e) Key management personnel compensation
The total remuneration accrued to Directors and Officers during the fiscal years ended December 31, 2024, and 2023 amounts to $83 and $88, respectively.
27
| MINERA EXAR S.A. NOTES TO THE FINANCIAL STATEMENTS FOR THE YEAR ENDED DECEMBER 31, 2024 (Expressed in thousands of US dollars, except for per share amounts, shares in thousands) |
19. EMBEDDED DERIVATIVE ON RELATED PARTY LOANS
As of December 31, 2024, Minera Exar has loans payable to Exar Capital B.V. and PGCo. (collectively, the "Related Party Loans") denominated in U.S. dollars. Under the terms of the loan agreements, Minera Exar is required to settle these loans in US$ by providing Argentine Pesos at the implied market exchange rate prevailing in Argentina, commonly referred to as the Blue-Chip Swap ("BCS") rate. The BCS rate differs from the official exchange rate published by the Argentine Central Bank.
This settlement mechanism exposes Minera Exar to foreign exchange variability and results in an embedded derivative within the loan contracts. The Related party loans represent financial liability that include a host loan accounted for at amortized cost and an embedded derivative, which is separated from the host and measured at fair value through profit or loss. The changes in the fair value of the embedded derivative are recognized in the statement of comprehensive loss under "Derivative (loss) gain."
Valuation Assumptions
The fair value of the embedded derivative is estimated based on the difference between the loan repayment value implied at the BCS rate and the value at the official exchange rate. The key assumptions used in the fair value calculation as of December 31, 2024, and 2023 are as follows:
| As at December 31, | |||||||||
| 2024 | 2023 | 2022 | |||||||
| Official exchange rate (ARS$/US$) | 1032.0 | 808.5 | 177.2 | ||||||
| BCS exchange rate (ARS$/US$) | 1170.4 | 999.1 | 336.1 | ||||||
Breakdown of Related Party Loans and Derivative Liabilities
| Years ended December 31, | ||||||
| 2024 | 2023 | |||||
| Current liabilities | ||||||
| Loans from Exar Capital (host loan) | (584,474 | ) | (265,881 | ) | ||
| Derivative liability on loans from Exar Capital | (53,211 | ) | (62,688 | ) | ||
| Total current related party loans (Note 18) | (637,685 | ) | (328,569 | ) | ||
| Non-current liabilities | ||||||
| Loans from Exar Capital (host loan) | (455,820 | ) | (501,066 | ) | ||
| Derivative liability on loans from Exar Capital | (38,319 | ) | (43,460 | ) | ||
| (494,139 | ) | (544,526 | ) | |||
| Loans from PGCo (host loan) | (67,354 | ) | - | |||
| Derivative liability on loans from PGCo | (9,034 | ) | - | |||
| (76,388 | ) | - | ||||
| Total non-current related party loans (Note 18) | (570,527 | ) | (544,526 | ) | ||
28
| MINERA EXAR S.A. NOTES TO THE FINANCIAL STATEMENTS FOR THE YEAR ENDED DECEMBER 31, 2024 (Expressed in thousands of US dollars, except for per share amounts, shares in thousands) |
20. PURCHASE OPTION AGREEMENT FOR MINING PROPERTIES OF THE LOS BOROS MINING GROUP
On September 11, 2018, Minera Exar exercised a purchase option agreement with Grupo Minero Los Boros ("Los Boros") for the transfer of certain mining properties to the Company that were part of the Cauchari-Olaroz project.
Under the terms of the Option Agreement, Minera Exar paid $300 in royalties upon signing the agreement (a lump sum payment) and, upon exercising the purchase option, agrees to pay $12,000 in sixty quarterly instalments of $200.
The first instalment is due upon the occurrence of one of the following two conditions, whichever occurs first: (i) 3 years from the date of exercise of the purchase option, i.e., September 11, 2021; or (ii) the commencement of commercial production with a minimum production of 20,000 tons of lithium carbonate equivalent.
As security for the transfer of the mining property title, Grupo Minero Los Boros granted Minera Exar a mortgage on these mining properties for $12,000.
Additionally, under the purchase option agreement, Minera Exar must pay a royalty of 3% of net profits to Grupo Minero Los Boros for 40 years, payable in Argentine pesos, annually within 10 business days after the end of each year.
Minera Exar may cancel the first 20 years of the aforementioned royalty in exchange for a single payment of $7,000. It will have equal rights to the royalty corresponding to the next 20 years by making a payment of the same amount of $7,000.
During fiscal year 2022, the company made two instalment payments: on March 10th for $200 and on July 1st for $200. As of December 31, 2024, payments for the third/fourth quarter of 2022, the fourth quarter of 2023, and the fourth quarter of 2024 are pending, as requested by Los Boros.
The liability balance has been valued at its discounted value at a rate of 13.19% and as of December 31, 2024, amounts to $6,900 (2023 - $6,300), presented as current account payable by $2,800 and non-current by $4,100.
21. SUPPLEMENTAL CASH FLOW INFORMATION
| Years Ended December 31, | |||||||||
| 2024 | 2023 | 2022 | |||||||
| Accrued/ unpaid interest | 118,502 | 83,386 | 58,654 | ||||||
| Capitalized currency translation loss/(gain) | 76,202 | (188,770 | ) | 326,721 | |||||
29
| MINERA EXAR S.A. NOTES TO THE FINANCIAL STATEMENTS FOR THE YEAR ENDED DECEMBER 31, 2024 (Expressed in thousands of US dollars, except for per share amounts, shares in thousands) |
22. DEFERRED INCOME TAX
The composition of income tax and deferred tax is as follows.
| As at December 31, | |||||||||
| 2024 | 2023 | 2022 | |||||||
| Deferred tax assets | |||||||||
| Accounts receivableand other receivables | 8,865 | 8,489 | 21,720 | ||||||
| Interests and currency translation effects | 110,086 | 71,513 | 38,364 | ||||||
| Inflation effects | - | 81,322 | - | ||||||
| Property, plant and equipment | - | - | 25,702 | ||||||
| Mineral Properties | 28,548 | - | 13,244 | ||||||
| Deferred tax results and losses | - | - | 2,646 | ||||||
| 147,499 | 161,324 | 101,676 | |||||||
| Deferred tax liabilities | |||||||||
| Property, plant and equipment | (214,942 | ) | (123,270 | ) | - | ||||
| Mineral Properties | - | (15,111 | ) | - | |||||
| Inventories | (30,732 | ) | (48,050 | ) | - | ||||
| Inflation effects | - | - | (2,559 | ) | |||||
| Deferred tax results and losses | (127 | ) | (362 | ) | - | ||||
| (245,801 | ) | (186,793 | ) | (2,559 | ) | ||||
| Total | (98,302 | ) | (25,469 | ) | 99,117 | ||||
Below is a reconciliation between the income tax charged to results and the amount that would result from applying the current tax rate to accounting profit:
| Years Ended December 31, | |||||||||
| 2024 | 2023 | 2022 | |||||||
| Income/(loss) before income taxes | 39,998 | 254,129 | (207,148 | ) | |||||
| Applicable tax rate | 35% | 35% | 35% | ||||||
| Expected income tax (expense)/recovery for the year at the tax rate | (13,999 | ) | (88,945 | ) | 72,502 | ||||
| Increase/(decrease) in income tax provision resulting from: | |||||||||
| Tax inflation adjustment, impact of rate changes and others* | (58,834 | ) | (35,641 | ) | 2,778 | ||||
| Total income tax charge for the fiscal year | (72,833 | ) | (124,586 | ) | 75,280 | ||||
| Current income taxes | - | - | - | ||||||
| Deferred income taxes | (72,833 | ) | (124,586 | ) | 75,280 | ||||
| Total income taxes | (72,833 | ) | (124,586 | ) | 75,280 | ||||
(*) Includes adjustment for tax inflation, conversion differences, and other permanent differences.
23. GLOBAL PROGRAM FOR THE ISSUANCE OF NEGOTIABLE BONDS
On February 21, 2024, at an Extraordinary General Meeting, the Shareholders of Minera Exar S.A. agreed to create a Global Program for the issuance of non-convertible Negotiable Bonds for a maximum amount of $500,000 or its equivalent in other currencies and/or units of value ("the Program"). On February 22, 2024, the Board of Directors approved the terms and conditions of the Program.
On August 14, 2024, the National Securities Commission authorized Minera Exar S.A. to create the program.
30
| MINERA EXAR S.A. NOTES TO THE FINANCIAL STATEMENTS FOR THE YEAR ENDED DECEMBER 31, 2024 (Expressed in thousands of US dollars, except for per share amounts, shares in thousands) |
23. GLOBAL PROGRAM FOR THE ISSUANCE OF NEGOTIABLE BONDS (continued)
On October 31, 2024, the Company published subscription notices for the tender that took place on November 7, 2024, for the following classes of negotiable bonds:
• Class I: paid and payable in US dollars in Argentina, at a fixed annual nominal interest rate, maturing 36 months from the Issue and Settlement Date.
• Class II: denominated in US dollars, to be subscribed and paid in pesos and payable in pesos at the applicable exchange rate, at a fixed annual nominal interest rate, maturing 24 (twenty-four) months from the Issue and Settlement Date.
The subscription proceeds for Class I amounted to $50,000 (the "Maximum Issue Amount"), exceeding its initial target of US$20,000. while for Class II Negotiable Bonds it has been decided to declare the placement and issue void, having been awarded the entire Maximum Issue Amount to Class I Negotiable Bonds. These are unsecured bonds carrying a contractual interest rate of 8% with semi-annual interest payments. The bonds' principal will mature in two tranches: the first tranche of $25,000 is due to 30 months, on May 11, 2027, while the second tranche of $25,000 will mature in 36 months, on November 11, 2027.
The fair value of the Company's existing Notes as of December 31, 2024, is $ 1.133 each. This value is derived from the market price of the Company's Notes at year-end.
The main commitments are detailed below:
Within the framework of the issuance of Minera Exar S.A.'s Class I Negotiable Bonds, the Company has assumed certain commitments to ensure proper financial and operational management, namely:
-
Preservation of real estate assets;
-
Payment of taxes and financial obligations;
-
Insurance coverage;
-
Financial statements and accounting records prepared in accordance with IFRS and applicable Argentine regulations, ensuring their transparency and reliability;
-
Disclosure of financial information in compliance with capital market regulations.
24. FAIR VALUE MEASUREMENT
Fair value is the price that would be received to sell an asset or paid to transfer a liability in an orderly transaction between market participants at the measurement date.
The fair value hierarchy categorizes inputs to valuation techniques used in measuring fair value into the following three levels:
- Level 1 - Unadjusted quoted prices in active markets for identical assets or liabilities;
- Level 2 - Inputs other than quoted prices that are observable for assets or liabilities, either directly or indirectly; and
31
| MINERA EXAR S.A. NOTES TO THE FINANCIAL STATEMENTS FOR THE YEAR ENDED DECEMBER 31, 2024 (Expressed in thousands of US dollars, except for per share amounts, shares in thousands) |
24. FAIR VALUE MEASUREMENT (continued)
- Level 3 - Inputs for assets and liabilities that are not based on observable market data.
The fair value hierarchy requires the use of observable market inputs whenever such inputs are available. A financial instrument is classified at the lowest level of the hierarchy for which a significant input has been used in measuring fair value.
The embedded derivative on related party loans (Note 19) are classified at level 2 of the fair value hierarchy and are measured at fair value on the statement of financial position on a recurring basis. Cash and cash equivalents, accounts receivables/payables, other receivables/payables, and the debt host of the related party loans are measured at amortized cost on the statement of financial position. As at December 31, 2024, the fair value of financial instruments measured at amortized cost approximates their carrying value.
The Company manages risks to minimize potential losses. The primary objective of the Company's risk management process is to ensure that the risks are properly identified and monitored, and that the capital base maintained by the Company is adequate in relation to those risks.
| December 31, 2024 | Financial assets and liabilities measured at amortized cost |
Financial assets measured at fair value through profit and loss |
Embedded derivative associated with related party loans |
Total | |||||||||||||||||
| (Level 1) | (Level 2) | ||||||||||||||||||||
| Current | Non-current | Current | Non-current | Current | Non-current | ||||||||||||||||
| Cash and cash equivalents (1)(3) | 3,642 | - | 7,548 | - | - | - | 11,190 | ||||||||||||||
| Accounts receivable and other receivables (1) |
44,776 | 3,298 | - | - | - | - | 48,074 | ||||||||||||||
| Total financial assets | 48,418 | 3,298 | 7,548 | - | 59,264 | ||||||||||||||||
| Loans and borrowings(2) | 745,938 | 572,714 | - | - | 53,211 | 47,353 | 1,419,216 | ||||||||||||||
| Accounts payable | 57,983 | 4,602 | - | - | - | - | 62,585 | ||||||||||||||
| Other liabilities(1) | 7,970 | 0 | - | - | - | - | 7,970 | ||||||||||||||
| Total financial liabilities | 811,891 | 577,316 | - | - | 53,211 | 47,353 | 1,489,771 | ||||||||||||||
32
| MINERA EXAR S.A. NOTES TO THE FINANCIAL STATEMENTS FOR THE YEAR ENDED DECEMBER 31, 2024 (Expressed in thousands of US dollars, except for per share amounts, shares in thousands) |
24. FAIR VALUE MEASUREMENT (continued)
| December 31, 2023 | Financial assets and liabilities measured at amortized cost |
Financial assets measured at fair value through profit and loss |
Embedded derivative associated with related party loans |
Total | |||||||||||||||||
| (Level 1) | (Level 2) | ||||||||||||||||||||
| Current | Non-current | Current | Non-current | Current | Non-current | ||||||||||||||||
| Cash and cash equivalents (1) | 49 | - | - | - | - | - | 49 | ||||||||||||||
| Accounts receivable and other receivable (1) |
3,521 | 1,025 | - | - | - | - | 4,546 | ||||||||||||||
| Total financial assets | 3,570 | 1,025 | - | - | 4,595 | ||||||||||||||||
| Loans and borrowing (2) | 580,330 | 536,979 | - | - | 62,688 | 43,460 | 1,223,457 | ||||||||||||||
| Accounts payable | 62,395 | 4,904 | - | - | - | - | 67,299 | ||||||||||||||
| Other liabilities (1) | 4,961 | - | - | - | - | - | 4,961 | ||||||||||||||
| Total financial liabilities | 647,686 | 541,883 | - | - | 62,688 | 43,460 | 1,295,717 | ||||||||||||||
(1) These assets and liabilities are carried at amortized cost and approximate fair values as a result of their short-term maturities.
(2) Loans and borrowing are carried at amortized costs. The fair value of the loans and borrowings approximately to carrying value other than the Negotiable bonds, fair value of which is disclosed in Note 23. The fair value of the loans is calculated as the present value of future cash flows based on the contractual cash flows discounted using a market rate of interest for similar instruments. The fair value of the Negotiable bonds is calculated with reference to their quoted price.
There were no amounts transferred between levels of the fair value hierarchy during the years ended December 31, 2024, and 2023.
25. FINANCIAL RISK MANAGEMENT
The principal risks impacting the Company's financial instruments are described below.
Credit Risk
Credit risk is the risk of loss associated with a counterparty's inability to fulfill its payment obligations. Financial instruments that potentially subject the Company to a concentration of credit risk consist primarily of cash, cash equivalents, accounts receivables from related parties (refer Note 6 and 18).
The Company's maximum exposure to credit risk for cash, cash equivalents, and accounts receivables from the related parties, is the amount disclosed in the statements of financial position. The Company's cash and cash equivalents and short-term investments are held through large financial institutions, with expected credit losses on cash and cash equivalents estimated to be de minimis.
The Company's exposure to credit risk associated with accounts receivable is influenced mainly by the individual characteristics of each customer.
The Company performed an expected credit loss assessment for these receivables, which did not indicate any significant credit risk or factors that would result in default, as majority of the receivables were settled subsequent to the year-end.
33
| MINERA EXAR S.A. NOTES TO THE FINANCIAL STATEMENTS FOR THE YEAR ENDED DECEMBER 31, 2024 (Expressed in thousands of US dollars, except for per share amounts, shares in thousands) |
25. FINANCIAL RISK MANAGEMENT (continued)
Liquidity risk
Liquidity risk is the risk that the Company will be unable to meet its financial obligations when due. The Company's approach to liquidity management is to ensure as much as possible that sufficient liquidity exists to meet their maturity obligation on the expiration dates. For this reason, companies in the group to which it belongs have financed and will continue financing the Company's operations in the Argentine Republic. During 2024, the Company has continued to generate income from its sales, with an upward trend that is expected to continue over time. The Company believes that it has sufficient liquidity to meet the Company's minimum obligations for at least the next 12 months from December 31, 2024.
| 1 year or less | 1 to 5 years | More than 5 years | Total 2024 | |||||||||
| Loans and borrowings | $ | 836,582 | $ | 736,843 | $ | 39 | 1,573,464 | |||||
| Accounts payable | 61,684 | - | - | 61,684 | ||||||||
| Other liabilities | - | 3,200 | 5,200 | 8,400 | ||||||||
| Total financial liabilities | $ | 898,266 | $ | 740,043 | $ | 5,239 | 1,643,548 |
| 1 year or less | 1 to 5 years | More than 5 years | Total 2023 | |||||||||
| Loans and borrowings | $ | 628,849 | $ | 697,945 | $ | - | 1,326,794 | |||||
| Accounts payable | 66,176 | - | - | 66,176 | ||||||||
| Other liabilities | - | 3,200 | 5,200 | 8,400 | ||||||||
| Other financial liabilities | $ | 695,025 | $ | 701,145 | $ | 5,200 | 1,401,370 |
Market risk
Market risk encompasses a range of risks. Movement in risk factors, such as market price risk, the Company's share price, and currency risk, can affect the fair values of financial assets and liabilities. The Company is exposed to foreign currency risk, as described below.
Foreign Currency Risk
The Company is exposed to foreign currency risks arising from its net exposure to assets and liabilities denominated in currencies other than its functional currency, the U.S. dollar. Foreign currency risk represents the possibility that fluctuations in exchange rates between the U.S. dollar and other currencies could adversely affect the Company's financial position or results of operations.
The majority of expenditures related to the Company's exploration, development, and construction activities are incurred in ARS$. As a result, the Company is primarily exposed to currency risk related to the ARS.
The Company maintains assets denominated in ARS$, including:
• Cash and cash equivalents
• Advances to suppliers
• Value-added tax receivables, which are expected to be recovered through export recovery claims
• Tax, customs, and gross income withholdings and levies
• Debit and credit taxes, which include portions that can be offset against other tax obligations
34
| MINERA EXAR S.A. NOTES TO THE FINANCIAL STATEMENTS FOR THE YEAR ENDED DECEMBER 31, 2024 (Expressed in thousands of US dollars, except for per share amounts, shares in thousands) |
25. FINANCIAL RISK MANAGEMENT (continued)
The Company does not currently use derivative instruments to hedge its foreign currency exposure. Long-term ARS$-denominated assets are primarily related to VAT credits, which are expected to be recovered in future periods through export sales.
Given the Company's current net ARS exposure, a fluctuation of ±10% in the ARS$ exchange rate is not expected to have a material impact on the Company's financial statements.
Capital Management
The Company's objectives in managing capital are to safeguard its ability to continue as a going concern in order to pursue the exploration and development of its mineral properties, and to maintain a flexible capital structure. The capital structure of the Company consists of related parties' loans and borrowings, and bank loans, comprising issued capital, contributed surplus, and deficit. The Company manages its capital structure and makes adjustments to it in light of changes in economic conditions and the risk characteristics of the underlying assets.
Effective December 23, 2019, changes to Argentina's tax laws proposed by the new Argentine Government were implemented. The changes ratified and extended legislation, which was to expire on December 31, 2019, and allow the Argentine Central Bank to regulate funds coming into and flowing out of Argentina to maintain stability and support the economic recovery of the country. These capital controls, together with additional temporary controls enacted on May 29, 2020, have the effect of requiring exporters to convert the equivalent value of foreign currency received from the export into Argentine Pesos; requiring the prior consent of the Argentine Central Bank to the payment of cash dividends and distributions of currency out of Argentina; requiring Argentine companies to convert foreign currency loans received from abroad into Argentine Pesos; and restricting the sale of Argentine Pesos for foreign currency. These changes have since been ratified and extended legislation to December 31, 2025.
However, on April 11, 2025, the Argentine Government announced the removal of foreign exchange controls and implemented a new exchange rate regime applicable primarily to individuals. The official exchange rate is now subject to a floating band between ARS 1,000 and ARS 1,400 per USD, with a 1% monthly adjustment. This measure is part of a new $20,000,000 agreement with the IMF, which included an initial disbursement of $12,000,000.
In parallel, Emergency Decree No. 269/2025 repealed the "Dólar Blend" mechanism, requiring 100% of export proceeds to be repatriated and settled through the official foreign exchange market. Certain exceptions remain in place for specific export regimes and services. Exporters must designate a financial institution to monitor each transaction, and settlement compliance is considered fulfilled upon certification by the designated entity.
To carry out the planned exploration and development of its projects and cover administrative costs, the Company will use its existing working capital and draw on its financing resources.
On the other hand, the Company has a commitment from its shareholders to provide financial assistance to ensure the continued financing of its activities.
Management reviews its capital management approach on an ongoing basis and believes that, given the relative size of the Company, this approach is reasonable. There were no changes in the Company's approach to capital management during the year ended December 31, 2024.
35
| MINERA EXAR S.A. NOTES TO THE FINANCIAL STATEMENTS FOR THE YEAR ENDED DECEMBER 31, 2024 (Expressed in thousands of US dollars, except for per share amounts, shares in thousands) |
26. SUBSEQUENT EVENT
Debt restructuring
During fiscal year 2024, Minera Exar S.A. entered into a Memorandum of Understanding ("MOU") with Exar Capital B.V., Ganfeng Lithium Netherlands Co. B.V., and Lithium Argentina to restructure its financial debt related to the Cauchari-Olaroz project.
In Q2 2025, Minera Exar obtained and accepted $120,000 in loan facilities from international banks, secured by standby letters of credit arranged by Ganfeng, with Lithium Argentina providing a guarantee to Ganfeng for its share of the facilities, amounting to $58,800 for the term of the loans. The loans have a current tenor of one year from the first drawdown. Loan arrangement and structuring fees of $704 and standby letter of credit costs of $1,120 were charged to Minera Exar and included in the cost of borrowings.
36
ITEM 19. EXHIBITS
110
| 15.12* | Consent of Qualified Person (Frederik Reidel) | |
| 15.13* | Consent of Qualified Person (Atacama Water SpA) | |
| 15.14* | Consent of Price Waterhouse & Co. S.R.L. | |
| 97.1** | Incentive Compensation Recovery Policy | |
| 101.INS* | Inline XBRL Instance Document–the instance document does not appear in the Interactive Data File as its XBRL tags are embedded within the Inline XBRL document | |
| 101.SCH* | Inline XBRL Taxonomy Extension Schema With Embedded Linkbase Documents | |
| 101.DEF* | Inline XBRL Taxonomy Extension Definition Linkbase Document | |
| 101.LAB* | Inline XBRL Taxonomy Extension Label Linkbase Document | |
| 101.PRE* | Inline XBRL Taxonomy Extension Presentation Linkbase Document | |
| 104* | Cover Page Interactive Data File (formatting as Inline XBRL and contained in Exhibit 101) | |
| * | Filed herewith | |
| ** | Previously filed |
# Portions of this exhibit have been redacted in compliance with Regulation S-K Items 601(a)(5) and 601(b). The Company agrees to furnish a copy of any omitted schedule or exhibit to the SEC upon its request.
111
SIGNATURES
The registrant hereby certifies that it meets all of the requirements for filing on Form 20-F/A and that it has duly caused and authorized the undersigned to sign this annual report on its behalf.
| LITHIUM ARGENTINA AG | ||
| By: | /s/ Sam Pigott | |
| Name: Sam Pigott | ||
| Title: President and Chief Executive Officer | ||
Date: June 27, 2025
112
CERTIFICATION REQUIRED BY RULE 13a-14(a) UNDER THE SECURITIES EXCHANGE ACT OF 1934
I, Sam Pigott, of Lithium Argentina AG certify that:
1. I have reviewed this annual report on Form 20-F/A of Lithium Argentina AG (the "Issuer");
2. Based on my knowledge, this report does not contain any untrue statement of a material fact or omit to state a material fact necessary to make the statements made, in light of the circumstances under which such statements were made, not misleading with respect to the period covered by this report;
3. Based on my knowledge, the financial statements, and other financial information included in this report, fairly present in all material respects the financial condition, results of operations and cash flows of the Issuer as of, and for, the periods presented in this report;
4. The Issuer's other certifying officer and I are responsible for establishing and maintaining disclosure controls and procedures (as defined in Exchange Act Rules 13a-15(e) and 15d-15(e)) and internal control over financial reporting (as defined in Exchange Act Rules 13a-15(f) and 15d-15(f)) for the Issuer and have:
a) Designed such disclosure controls and procedures, or caused such disclosure controls and procedures to be designed under our supervision, to ensure that material information relating to the Issuer, including its consolidated subsidiaries, is made known to us by others within those entities, particularly during the period in which this report is being prepared;
b) Designed such internal control over financial reporting, or caused such internal control over financial reporting to be designed under our supervision, to provide reasonable assurance regarding the reliability of financial reporting and the preparation of financial statements for external purposes in accordance with generally accepted accounting principles;
c) Evaluated the effectiveness of the Issuer's disclosure controls and procedures and presented in this report our conclusions about the effectiveness of the disclosure controls and procedures, as of the end of the period covered by this report based on such evaluation; and
d) Disclosed in this report any change in the Issuer's internal control over financial reporting that occurred during the period covered by the annual report that has materially affected, or is reasonably likely to materially affect, the Issuer's internal control over financial reporting.
5. The Issuer's other certifying officer and I have disclosed, based on our most recent evaluation of internal control over financial reporting, to the Issuer's auditor and the audit committee of the Issuer's board of directors (or persons performing the equivalent functions):
a) All significant deficiencies and material weaknesses in the design or operation of internal control over financial reporting which are reasonably likely to adversely affect the Issuer's ability to record, process, summarize and report financial information; and
b) Any fraud, whether or not material, that involves management or other employees who have a significant role in the Issuer's internal control over financial reporting.
|
|
By: |
/s/Sam Pigott |
|
Date: June 27, 2025 |
|
Sam Pigott |
CERTIFICATION REQUIRED BY RULE 13a-14(a) UNDER THE SECURITIES EXCHANGE ACT OF 1934
I, Alex Shulga, of Lithium Argentina AG certify that:
1. I have reviewed this annual report on Form 20-F/A of Lithium Argentina AG (the "Issuer");
2. Based on my knowledge, this report does not contain any untrue statement of a material fact or omit to state a material fact necessary to make the statements made, in light of the circumstances under which such statements were made, not misleading with respect to the period covered by this report;
3. Based on my knowledge, the financial statements, and other financial information included in this report, fairly present in all material respects the financial condition, results of operations and cash flows of the Issuer as of, and for, the periods presented in this report;
4. The Issuer's other certifying officer and I are responsible for establishing and maintaining disclosure controls and procedures (as defined in Exchange Act Rules 13a-15(e) and 15d-15(e)) and internal control over financial reporting (as defined in Exchange Act Rules 13a-15(f) and 15d-15(f)) for the Issuer and have:
a) Designed such disclosure controls and procedures, or caused such disclosure controls and procedures to be designed under our supervision, to ensure that material information relating to the Issuer, including its consolidated subsidiaries, is made known to us by others within those entities, particularly during the period in which this report is being prepared;
b) Designed such internal control over financial reporting, or caused such internal control over financial reporting to be designed under our supervision, to provide reasonable assurance regarding the reliability of financial reporting and the preparation of financial statements for external purposes in accordance with generally accepted accounting principles;
c) Evaluated the effectiveness of the Issuer's disclosure controls and procedures and presented in this report our conclusions about the effectiveness of the disclosure controls and procedures, as of the end of the period covered by this report based on such evaluation; and
d) Disclosed in this report any change in the Issuer's internal control over financial reporting that occurred during the period covered by the annual report that has materially affected, or is reasonably likely to materially affect, the Issuer's internal control over financial reporting.
5. The Issuer's other certifying officer and I have disclosed, based on our most recent evaluation of internal control over financial reporting, to the Issuer's auditor and the audit committee of the Issuer's board of directors (or persons performing the equivalent functions):
a) All significant deficiencies and material weaknesses in the design or operation of internal control over financial reporting which are reasonably likely to adversely affect the Issuer's ability to record, process, summarize and report financial information; and
b) Any fraud, whether or not material, that involves management or other employees who have a significant role in the Issuer's internal control over financial reporting.
|
|
By: |
/s/Alex Shulga |
|
Date: June 27, 2025 |
|
Alex Shulga |
CERTIFICATION PURSUANT TO
18 U.S.C. §1350,
AS ADOPTED PURSUANT TO
SECTION 906 OF THE SARBANES-OXLEY ACT OF 2002
In connection with the Annual Report of Lithium Argentina AG (the "Company") on Form 20-F/A for the period ended December 31, 2024 as filed with the Securities and Exchange Commission on the date hereof (the "Report"), I, Sam Pigott, Chief Executive Officer of the Company, certify, pursuant to 18 U.S.C. Section 1350, as adopted pursuant to Section 906 of the Sarbanes-Oxley Act of 2002, that:
(1) The Report fully complies with the requirements of Section 13(a) or 15(d) of the Securities Exchange Act of 1934, as amended; and
(2) The information contained in this Report fairly presents, in all material respects, the financial condition and results of operations of the Company.
| June 27, 2025 | /s/ Sam Pigott |
| Sam Pigott | |
| Chief Executive Officer | |
| (Principal Executive Officer) |
CERTIFICATION PURSUANT TO
18 U.S.C. §1350,
AS ADOPTED PURSUANT TO
SECTION 906 OF THE SARBANES-OXLEY ACT OF 2002
In connection with the Annual Report of Lithium Argentina AG (the "Company") on Form 20-F/A for the period ended December 31, 2024 as filed with the Securities and Exchange Commission on the date hereof (the "Report"), I, Alex Shulga, Chief Financial Officer of the Company, certify, pursuant to 18 U.S.C. Section 1350, as adopted pursuant to Section 906 of the Sarbanes-Oxley Act of 2002, that:
(1) The Report fully complies with the requirements of Section 13(a) or 15(d) of the Securities Exchange Act of 1934, as amended; and
(2) The information contained in this Report fairly presents, in all material respects, the financial condition and results of operations of the Company.
| June 27, 2025 | /s/ Alex Shulga |
| Alex Shulga | |
| Chief Financial Officer | |
| (Principal Financial and Accounting Officer) |

SEC TECHNICAL REPORT SUMMARY
LITHIUM RESOURCE ESTIMATE
PASTOS GRANDES PROJECT
SALTA PROVINCE, ARGENTINA
PREPARED FOR
Lithium Argentina AG
(NYC:LAR)
PREPARED BY
Frederik Reidel,
Atacama Water
Effective Date: December 31, 2024
 |
TABLE OF CONTENTS
| 1 SUMMARY | 1 |
| 1.1 Terms of reference | 1 |
| 1.2 Property description and ownership | 1 |
| 1.3 Physiography and climate | 2 |
| 1.4 Geology and mineralization | 2 |
| 1.5 Drilling and testing | 4 |
| 1.6 Current project status | 4 |
| 1.7 Mineral resources | 4 |
| 1.8 Capital and operation costs | 6 |
| 1.9 Conclusion and Recommendations | 7 |
| 2 INTRODUCTION | 9 |
| 2.1 Terms of reference | 9 |
| 2.2 Qualifications of Qualified Persons | 9 |
| 2.2.1 Qualified Person | 9 |
| 2.2.2 Site Visits | 10 |
| 2.3 Effective Date | 10 |
| 2.4 Previous Technical Reports | 10 |
| 2.5 Reference Reports | 10 |
| 2.6 Sources of information | 11 |
| 2.7 Specific Characteristics of Lithium Brine Projects | 11 |
| 2.8 Units of Measure & Glossary of Terms | 11 |
| 3 PROPERTY DESCRIPTION AND LOCATION | 16 |
| 3.1 Property location | 16 |
| 3.2 Mining license | 16 |
| 3.3 Ownership and title | 19 |
| 3.4 Royalties | 21 |
| 3.5 Environmental liabilities | 21 |
| 3.6 Other significant factors and risks | 21 |
| 4 ACCESSIBILITY, CLIMATE, LOCAL RESOURCES, INFRASTRUCTURE AND PHYSIOGRAPHY | 22 |
| 4.1 Accessibility | 22 |
| 4.2 Physiography | 22 |
| 4.3 Climate | 24 |
| 4.3.1 Temperature | 25 |
| 4.3.2 Rainfall | 25 |
| 4.3.3 Solar radiation | 28 |
| 4.3.4 Wind | 28 |
| 4.3.5 Evaporation | 29 |
| 4.3.6 Summary of meteorological parameters | 30 |
| 4.4 Local Infrastructure | 30 |
| 4.4.1 Railroad | 30 |
| 4.4.2 Natural gas | 31 |
| 4.4.3 Water | 31 |
| 4.4.4 Surface area | 31 |
| 4.5 Vegetation | 31 |
|
| 5 HISTORY | 32 |
| 6 GEOLOGICAL SETTING, MINERALIZATION, AND DEPOSIT | 34 |
| 6.1 Regional geology | 34 |
| 6.1.1 Tectonic context | 34 |
| 6.1.2 Stratigraphy | 34 |
| 6.1.3 Structure | 42 |
| 6.2 Local geology | 44 |
| 6.2.1 Borehole information | 44 |
| 6.2.2 Geophysical surveys | 46 |
| 6.3 Local geology description | 47 |
| 6.3.1 Fluvial/Alluvial Unit | 47 |
| 6.3.2 Upper clay unit (Blanca Lila Formation) | 47 |
| 6.3.3 Saline/Lacustrine unit | 47 |
| 6.3.4 Central clastic unit | 47 |
| 6.3.5 Base Breccia/Gravels unit | 48 |
| 6.4 Mineralization | 58 |
| 6.5 Deposit type | 58 |
| 6.6 Hydrogeology | 59 |
| 6.7 Water balance | 61 |
| 6.8 Drainable porosity | 61 |
| 6.9 Permeability | 63 |
| 7 EXPLORATION | 64 |
| 7.1 Surface brine sampling | 64 |
| 7.2 Geophysical studies | 66 |
| 7.2.1 Eramet (2011-2013) | 66 |
| 7.2.2 Millennial exploration (2017 - 2019) | 66 |
| 7.2.3 LSC exploration (2017 - 2018) | 68 |
| 7.2.4 Centaur/AMSA exploration (2018 - 2022) | 68 |
| 7.2.5 LAC exploration (2022) | 69 |
| 7.2.6 Recommendations | 69 |
| 7.3 DRILLING | 70 |
| 7.3.1 Overview | 70 |
| 7.3.2 Exploration drilling | 74 |
| 7.3.3 Production well drilling | 74 |
| 7.3.4 Freshwater Exploration Drilling | 75 |
| 7.3.5 Recommendations | 75 |
| 7.4 Hydraulic testing | 76 |
| 7.4.1 Brine Well Pumping Tests | 76 |
| 7.4.2 Pumping tests conducted in freshwater wells | 80 |
| 7.4.3 Recommendations | 81 |
| 8 SAMPLE PREPARATION, ANALYSIS, AND SECURITY | 91 |
| 8.1 Sampling Methods and Assays | 91 |
| 8.1.1 Millennial drainable porosity analysis (2016-2019) | 91 |
| 8.1.2 AMSA drainable porosity samples (2021-2022) | 93 |
| 8.1.3 Brine samples | 95 |
|
| 8.2 Drainable porosity QA/QC | 97 |
| 8.3 Brine QA/QC | 100 |
| 8.3.1 Millennial duplicate brine samples | 101 |
| 8.3.2 Millennial check samples | 105 |
| 8.3.3 Millennial field blanks | 107 |
| 8.3.4 Millennial standard samples | 109 |
| 8.3.5 AMSA duplicate brine samples | 114 |
| 8.3.6 AMSA field blanks | 116 |
| 8.3.7 AMSA standard samples | 117 |
| 8.3.8 Centaur duplicate brine samples | 120 |
| 8.3.9 Centaur field blanks | 122 |
| 8.3.10 Centaur Standard samples | 124 |
| 9 DATA VERIFICATION | 126 |
| 10 MINERAL PROCESSING AND METALLURGICAL TESTING | 127 |
| 11 BRINE RESOURCE ESTIMATES | 128 |
| 11.1 Overview | 128 |
| 11.2 Resource model domain and aquifer geometry | 128 |
| 11.3 Specific Yield | 128 |
| 11.4 Brine Concentrations | 129 |
| 11.5 Resource category | 129 |
| 11.6 Resource model methodology and construction | 133 |
| 11.6.1 Univariate statistical description | 134 |
| 11.6.2 Variography | 136 |
| 11.7 Grade estimate | 141 |
| 11.8 Resource estimate | 145 |
| 12 MINERAL RESERVE ESTIMATES | 148 |
| 13 MINING METHODS | 149 |
| 14 RECOVERY METHODS | 150 |
| 15 PROJECT INFRASTRUCTURE | 151 |
| 15.1 Permanent installations | 151 |
| 15.2 Services | 157 |
| 16 MARKET STUDIES AND CONTRACTS | 162 |
| 16.1 Lithium applications | 162 |
| 16.2 Lithium demand | 164 |
| 16.3 Lithium supply | 166 |
| 16.4 Lithium suppliers leading companies and market share | 169 |
| 16.5 Lithium supply demand balance | 170 |
| 16.6 Price forcast | 171 |
| 17 ENVIROMENTAL STUDIES, PERMITTING AND SOCIAL OR COMMUNITY IMPACT | 174 |
| 17.1 Environmental studies | 174 |
| 17.2 Environmental permits | 174 |
| 17.3 Social and community | 176 |
| 18 CAPITAL AND OPERATING COSTS | 177 |
| 18.1 Project capital costs | 177 |
| 18.2 Project operating costs | 177 |
|
| 19 ECONOMIC ANALYSIS | 179 |
| 19.1 Main assumptions | 179 |
| 19.2 Evaluation criteria | 179 |
| 19.3 Tax | 180 |
| 19.4 Capital expenditures | 181 |
| 19.5 Operating costs | 182 |
| 19.6 Production revenues | 182 |
| 19.7 Mine closure | 182 |
| 19.8 Sustaining CAPEX | 182 |
| 19.9 Cash flow projection | 183 |
| 19.10 Economic evaluation results | 185 |
| 19.11 Payback analysis | 185 |
| 19.12 Sensitivity analysis | 185 |
| 19.13 Discussions and conclusions | 187 |
| 20 ADJACENT PROPERTIES | 189 |
| 21 ADDITIONAL INFORMATION | 192 |
| 22 INTERPRETATION AND CONCLUSIONS | 193 |
| 23 RECOMMENDATIONS | 195 |
| 24 REFERENCES | 197 |
LIST FIGURES
| Figure 3.1 ocation map of the Pastos Grandes Project | 18 |
| Figure 3.2 Location map of PGSA mining concessions | 20 |
| Figure 4.1 Hydrological subdivisions of the Pastos Grandes Basin | 23 |
| Figure 4.2 Surface water features within Pastos Grandes basin | 24 |
| Figure 4.3 Isohyet map for Salar de Pastos Grandes | 26 |
| Figure 4.4 Correlation between observed and predicted annual precipitation (M&A,2018) | 27 |
| Figure 4.5 Predicted annual precipitation for the Salar de Pastos Grandes (M&A,2018) | 27 |
| Figure 4.6 Solar radiation measured at Salar de Pastos Grandes (M&A,2018) | 28 |
| Figure 4.7 Wind speed measured at Salar de Pastos Grandes (M&A,2018) | 29 |
| Figure 6.1 Stratigraphic chart (modified from Blasco et al., 1996) | 35 |
| Figure 6.2 Regional geological Scheme (modified from Blasco et al., 1996) | 36 |
| Figure 6.3 Geological cross section, Pastos Grandes Depression (modified from Alonso, 1992) | 37 |
| Figure 6.4 Structural setting of the Puna | 44 |
| Figure 6.5 Generalized evolution of the structures of the Puna (Houston, 2010) | 45 |
| Figure 6.6 Plan view of the interpreted geological units | 50 |
| Figure 6.7 N-S section, through the geological model looking from the NW) | 51 |
| Figure 6.8 Spatial distribution Fluvial/Alluvial Unit | 52 |
| Figure 6.9 Spatial distribution Upper Clay Unit (Blanca Lila Formation) | 53 |
| Figure 6.10 Spatial distribution Saline-Lacustrine Unit | 54 |
| Figure 6.11 Spatial distribution Central Clastic Unit | 55 |
| Figure 6.12 Spatial distribution Base Breccia/Gravel Unit | 56 |
| Figure 6.13 Cross sections AA' and BB' through the of the Pastos Grandes basin | 57 |
| Figure 6.14 Cross section CC' and DD' through the Pastos Grandes basin | 58 |
|
| Figure 6.15 Conceptual model for mature and immature (Houston et al., 2011) | 60 |
| Figure 6.16 Hydrogeological cross section | 63 |
| Figure 7.1 Historical surface brine samples in Salar de Pastos Grandes | 66 |
| Figure 7.2 Geophysical surveys conducted in Salar de Pastos Grandes | 68 |
| Figure 7.3 Borehole locations in Salar de Pastos Grandes | 72 |
| Figure 7.4 Location map of the pumping tests conducted in Salar de Pastos Grandes | 78 |
| Figure 7.5 Location, setup and results of pumping test well PGPW16-01 (2017) | 83 |
| Figure 7.6 Location, setup and results of pumping test PGPW17-04 | 84 |
| Figure 7.7 Location, setup and results of pumping test PGPW18-15 | 85 |
| Figure 7.8 Location, setup and results of pumping test PGPW18-17 | 86 |
| Figure 7.9 Location, setup and results of pumping test PGPW16-01 (2019) | 87 |
| Figure 7.10 Location, setup and results of pumping test PGWW19-02 | 88 |
| Figure 7.11 Location, setup and results of pumping test PGWW19-03 | 89 |
| Figure 8.1 Pt comparison for check samples DBSA - GSA | 100 |
| Figure 8.2 Sy comparison for check samples DBSA - GSA | 100 |
| Figure 8.3 Sy and RBR comparison for check samples DBSA - GSA | 101 |
| Figure 8.4 Max-min plot for lithium in duplicates - ASANOA | 104 |
| Figure 8.5 Max-min plot for potassium in duplicates - ASANOA | 104 |
| Figure 8.6 Max-min plot for lithium in duplicates - SGS | 105 |
| Figure 8.7 Max-min plot for potassium in duplicates - SGS | 105 |
| Figure 8.8 Max-min plot for lithium in check samples: ASANOA - SGS | 107 |
| Figure 8.9 Max-min plot for potassium in check samples: ASANOA - SGS | 107 |
| Figure 8.10 Blank vs previous samples for lithium - ASANOA | 108 |
| Figure 8.11 Blank vs previous samples for potassium - ASANOA | 109 |
| Figure 8.12 Blank vs previous samples for lithium - SGS | 109 |
| Figure 8.13 Blank vs previous samples for potassium - SGS | 110 |
| Figure 8.14 Graphical analysis of lithium within 'RR' Standards assayed by ASANOA. | 111 |
| Figure 8.15 Graphical analysis of potassium within 'RR' Standards assayed by ASANOA. | 112 |
| Figure 8.16 Graphical analysis of lithium within 'RR' Standards assayed by SGS. | 113 |
| Figure 8.17 Graphical analysis of potassium within 'RR' Standards assayed by SGS. | 113 |
| Figure 8.18 Graphical analysis of lithium within 'INBEMI' Standards assayed by SGS. | 114 |
| Figure 8.19 Graphical analysis of potassium within 'INBEMI' Standards assayed by SGS. | 114 |
| Figure 8.20 Max-min plot for lithium in duplicates - SGS | 116 |
| Figure 8.21 Max-min plot for potassium in duplicates - SGS | 116 |
| Figure 8.22 Blank vs previous samples for lithium - SGS | 117 |
| Figure 8.23 Blank vs previous samples for potassium - SGS | 118 |
| Figure 8.24 Graphical analysis of lithium within 'STD-1' Standards assayed by SGS. | 119 |
| Figure 8.25 Graphical analysis of potassium within 'STD-1' Standards assayed by SGS. | 120 |
| Figure 8.26 Graphical analysis of lithium within 'STD-2' Standards assayed by SGS. | 120 |
| Figure 8.27 Graphical analysis of potassium within 'STD-2' Standards assayed by SGS. | 121 |
| Figure 8.28 Max-min plot for lithium in duplicates - ASANOA | 122 |
| Figure 8.29 Max-min plot for potassium in duplicates - ASANOA | 123 |
| Figure 8.30 Blank vs previous samples for lithium - ASANOA | 124 |
| Figure 8.31 Blank vs previous samples for potassium - ASANOA | 124 |
| Figure 8.32 Graphical analysis of lithium within 'STD-A' Standards assayed by ASANOA. | 125 |
|
| Figure 8.33 Graphical analysis of potassium within 'STD-A' Standards assayed by ASANOA. | 126 |
| Figure 11.1 Schematic section illustrating resource categories based on data density for different zones | 132 |
| Figure 11.2 Spatial distribution of resource classification by depth | 133 |
| Figure 11.3 lithium and potassium histograms and cumulative distributions | 136 |
| Figure 11.4 Lithium and potassium histograms and cumulative distributions for region I | 137 |
| Figure 11.5 Experimental variogram and variogram model for the indicator variable | 140 |
| Figure 11.6 Experimental variogram and variogram model for potassium and lithium in region I | 141 |
| Figure 11.7 N-S section through the resource model showing the lithium grade distribution | 143 |
| Figure 11.8 W-E section through the resource model showing the lithium grade distribution | 144 |
| Figure 11.9 SW-NE section through the resource model showing the lithium grade distribution | 145 |
| Figure 11.10 Brine volume cut-off grade for Measured and Indicated Resources | 146 |
| Figure 15.1 Project installations | 153 |
| Figure 15.2 Layout of the Lithium Carbonate Plant | 155 |
| Figure 15.3 Routing for the "La Puna" gas pipeline | 160 |
| Figure 15.4 Routing for the Pastos Grandes gas pipeline | 161 |
| Figure 16.1 LFP, LMFP, and NCM comparison (Source: Lithium Quarterly Market Review October 2024 from iLiMarkets.) | 164 |
| Figure 16.2 Battery Raw materials cost (Source: Lithium Quarterly Market Review October 2024 from iLiMarkets) | 164 |
| Figure 16.3 Battery raw materials cost (Source: Lithium Quarterly Market Review October 2024 from iLiMarkets.) | 165 |
| Figure 16.4 Lithium Demand in Batteries (2024) (Source: Lithium Quarterly Market Review October 2024 from iLiMarkets.) | 165 |
| Figure 16.5 Lithium EV main players (Source: Lithium Quarterly Market Review October 2024 from iLiMarkets.) | 166 |
| Figure 16.6 EV Sales Forecast per Region (Source: Lithium Quarterly Market Review October 2024 from iLiMarkets. Horizontal axis label is in years.) | 167 |
| Figure 16.7 EV Penetration Rate Forecast (Source: Lithium Quarterly Market Review October 2024 from iLiMarkets.) | 167 |
| Figure 16.8 Lithium Production (2023) by Country (Source: U.S. Geological Survey, Mineral Commodity Summaries, January 2024. It excludes US production.) | 168 |
| Figure 16.9 Lithium Supply Forecast per Resource Type (Source: Lithium Quarterly Market Review October 2024 from iLiMarkets.) | 168 |
| Figure 16.10 Lithium Supply Forecast per Country (Source: Lithium Quarterly Market Review October 2024 from iLiMarkets.) | 169 |
| Figure 16.11 Market cap/sum LCE Mined (24-28) (Source: Lithium Quarterly Market Review October 2024 from iLiMarkets.) | 170 |
| Figure 16.12 Lithium Supply & Demand Forecast (Source: Lithium Quarterly Market Review October 2024 from iLiMarkets.) | 171 |
| Figure 16.11 Projected Pricing for Battery-Quality Lithium Carbonate Used in Economic Model (Source: "Lithium Price Forecast," Benchmark Mineral Intelligence, October 2024.) | 173 |
| Figure 19.1 Project NPV Before Taxes at 10% Discount Rate-Sensitivity Base Case Scenario | 187 |
| Figure 19.2 Diagram for Project NPV After Taxes at 10% Discount Rate-Sensitivity Base Case Scenario | 188 |
| Figure 20.1 Location map of adjacent properties | 192 |
|
LIST OF TABLES
| Table 1.1 Maximum, average and minimum elemental concentrations of the Pastos Grandes brine | 3 |
| Table 1.2 Average values (mg/L) of key components and ratios for the Pastos Grandes brine | 3 |
| Table 1.3 Results of drainable porosity analyses | 5 |
| Table 1.4 Mineral Resources of the PGSA mining claims - Dated December 31, 2024 | 5 |
| Table 1.5 OPEX estimate | 6 |
| Table 2.1 Acronyms and Abbreviations. | 11 |
| Table 2.2 Units of measurement | 13 |
| Table 3.1 PGSA mining tenements | 19 |
| Table 4.1 Principal meteorological parameters of Salar de Pastos Grandes | 30 |
| Table 6.1 Boreholes incorporated in the geological model. | 46 |
| Table 6.2 Maximum, average and minimum elemental concentrations of the Pastos Grandes brine | 59 |
| Table 6.3 Average values (mg/L) of key components and ratios for the Pastos Grandes brine | 59 |
| Table 6.4 Water balance for Salar de Pastos Grandes | 62 |
| Table 6.5 Results of drainable porosity analyses | 64 |
| Table 6.6 Summary of permeability values | 64 |
| Table 7.1 Summary of 2016-2022 boreholes | 73 |
| Table 7.2 Summary of pumping test PGPW16-01 (2017) | 79 |
| Table 7.3 Summary of pumping test PGPW17-04 | 79 |
| Table 7.4 Summary of pumping test PGPW18-15 | 80 |
| Table 7.5 Summary of pumping test PGPW18-17 | 80 |
| Table 7.6 Summary of pumping test PGPW16-01 (2019) | 81 |
| Table 7.7 Summary of pumping test PGWW18-01 | 81 |
| Table 7.8 Summary of pumping test PGWW19-02 | 81 |
| Table 7.9 Summary of pumping test PGWW19-03 | 82 |
| Table 7.10 Summary of brine well tests | 90 |
| Table 7.11 Summary of freshwater pumping tests | 91 |
| Table 8.1 Summary of laboratory tests conducted by GSA | 94 |
| Table 8.2 Analytical methods used by ASANOA and SGS for brine assays. | 97 |
| Table 8.3 Total porosity results for paired samples using GSA lithologic classification. | 99 |
| Table 8.4 Specific yield results for paired samples using GSA lithological classification. | 99 |
| Table 8.5 Summary of QAQC insertion rates for each campaign | 102 |
| Table 8.6 Statistical analysis of duplicate samples - ASANOA | 102 |
| Table 8.7 Statistical analysis of duplicate samples - SGS | 103 |
| Table 8.8 Statistical analysis of check samples - ASANOA & SGS | 106 |
| Table 8.9 Element concentrations (best values) for Standard RR - Millennial | 110 |
| Table 8.10 Element concentrations for Standard INBEMI - Millennial | 111 |
| Table 8.11 Statistical analysis of duplicate samples - SGS | 115 |
| Table 8.12 Element concentrations (best values) for Standards 1 & 2 - AMSA | 118 |
| Table 8.13 Statistical analysis of duplicate samples - ASANOA | 121 |
| Table 8.14 Element concentrations (best values) for Standards A & B - Centaur | 125 |
| Table 11.1 Summary statistics of drainable porosity for geological units | 130 |
| Table 11.2 Summary of brine chemistry composition | 130 |
| Table 11.3 Summary of univariate statistics of Li and K | 135 |
| Table 11.4 Parameters for the calculation of the experimental variograms of the indicator variable | 138 |
| Table 11.5 Parameters for the calculation of the experimental variograms of the K and Li concentrations | 138 |
|
| Table 11.6 Mineral Resources of the PGSA mining claims of Pastos Grandes Project - Dated December 31, 2024 | 147 |
| Table 11.7 Pastos Grandes Project resources expressed as LCE and KCl | 148 |
| Table 16.1 3-year and 5-year average spot price of battery grade LCE | 173 |
| Table 16.2 Benchmark Minerals market price expectations for battery quality lithium | 174 |
| Table 18.1 Project estimate CAPEX | 178 |
| Table 18.2 Estimate OPEX | 179 |
| Table 19.1 The key inputs to the economic analysis | 181 |
| Table 19.2 CAPEX | 182 |
| Table 19.3 OPEX summary | 183 |
| Table 19.4 Discounted Cash Flow Summary | 185 |
| Table 19.5 Economic Evaluation | 186 |
| Table 19.6 Results of sensitivity analysis | 187 |
| Table 19.7 Results of sensitivity analysis | 187 |
| Table 20.1 Mining properties in the vicinity of the Pastos Grandes Project | 190 |
| Table 22.1 Summary of the average brine composition (g/L) and ratios | 194 |
| Table 22.2 Mineral Resources of the PGSA mining claims - Dated December 31, 2024 | 195 |
| Table 22.3 PGSA resources expressed as LCE and KCl | 195 |
| Table 23.1 Estimated budget for the 2025 brine resource evaluation program | 197 |
|
1 SUMMARY
1.1 Terms of reference
Lithium Argentina AG (LAR); previously Lithium Americas Corp, acquired the Pastos Grandes Project from Millennial in January 2022. LAR subsequently acquired additional mining concessions (LAC Norte and Sur) during 2022. LAR retained Atacama Water to prepare this Technical Report Summary for the Pastos Grandes Project with the objective of updating the mineral resource estimate for lithium contained in brine for the LAR properties in the Pastos Grandes basin based on the consolidation and integration of available information.
LAR completed the acquisition of all the shares of AMSA in April 2023. AMSA owns 65% of the Sal de la Puna Project through a joint venture interest in Sal de la Puna Holdings Ltd. the 100% owner of the Argentine subsidiary, PASAU, the owner of the claims forming part of the Sal del la Puna Project. The remaining 35% of Sal de la Puna Holdings Ltd. is owned by joint venture partner Ganfeng New Energy Technology Development (Suzhou) Co., Ltd. The mineral resource estimate presented herein does not include any resource on the Sal de la Puna properties. LAR anticipates conducting additional work to evaluate consolidating the Pastos Grandes basin to include potential upside from the Sal de la Puna Project."
This Technical Report Summary was prepared in accordance with the requirements of Regulation S-K, Subpart 1300 of the SEC. The Report also includes technical judgment of appropriate additional technical parameters to accommodate certain specific characteristics of minerals hosted in liquid brine as outlined in CIM Best Practice Guidelines for Resource and Reserve Estimation for Lithium Brines and as discussed by Houston (Houston et al, 2011).
1.2 Property description and ownership
The Pastos Grandes Project is situated within the Department of Los Andes approximately 10 km south of the village of Santa Rosa de Los Pastos Grandes and 130 km west of the city of Salta, the capital of the Salta Province in Argentina. The property's location is defined by its center point, which is at approximately 3,428,966 mE, 7,283,194 mN (POSGAR 04 / Argentina zone 3). The Project encompasses a surface area of more than 24,000 ha in Salar de Pastos Grandes at an elevation of roughly 3,785 masl.
The Project site is near Highway 129 which connects 40 km north with Highway 51. Highway 51 traverses from Salta to the international border with Chile at the Sico Pass and connects further west to the major mining center of Calama, as well as the ports of Antofagasta and Mejillones in northern Chile. Both ports are major transportation hubs for the importation of mining equipment and the exportation of mineral commodities.
Prior to August 2024, LAR held 100% percent of the ownership of Pastos Grandes S.A. ("PGSA"). In August 2024, LAR sold a 14.9 percent interest in PGSA to a subsidiary of Ganfeng Lithium Co, Ltd. Through its 85.1 percent ownership of PGSA, LAR controls the mining concessions of the Pastos Grandes Project. These concessions include El Milagro, Neptali II, Norte Argentino, Juan Eduardo, Aguamarga 15, Taba PG, Papadopulos LXXIV, Ignacio, Ignacio IV, Daniel Ramon, Aguamarga 10, Nueva Sijesyta 01, Papadopulos XXXII and cover an area of 12,729 ha. In addition, PGSA controls several other mining concessions and easements to further facilitate project development which are under application and cover some additional 11,000 ha. A legal opinion provided by LAR indicates that all claims are in good standing and all payments are current.
|
1.3 Physiography and climate
The hydrographic basin of the Salar de Pastos Grandes ("Salar de Pastos Grandes" or the "Salar") covers 1,690 km2 in the Altiplano of northwestern Argentina. The average elevation of the basin is 4.301 masl. The Pastos Grandes Basin had been divided into two subbasins according to topographic criteria, the Río Sijes subbasin at the east and Pastos Grandes subbasin at the west. The active saline crust of the Salar is in the western section of the hydrographic basin and covers nearly 31.4 km2. The Salar nucleus sits at an approximate elevation of 3,767 masl. Unlike other salars of the region, the topography of the nucleus of Salar the Pastos Grandes is irregular.
Surface runoff is mainly restricted to the rainy season during summer. Three intermittent to ephemeral rivers enter the Salar, Rio Sijes from the east, Rio Pastos Grandes from the north, and Rio Corral Colorado from the northeast. Three semi-permanent lagoons occur near the discharge areas of the three above-mentioned rivers into the nucleus of the Salar. Springs and wetlands occur towards the north of the Salar over the interface between the alluvium and evaporitic crust in the lower parts of the Rio Pastos Grandes and Rio Corral Colorado.
The climate in the Project area is severe and can be described as a typical continental, cold, high-altitude desert, with resultant scarce vegetation. Daily temperature variations may exceed 25oC. Solar radiation is intense, especially during the months of October through March, leading to high evaporation rates. The rainy season occurs between the months of December and March when occasional flooding can develop in the Salar and may limit certain activities.
1.4 Geology and mineralization
Based on the lithological descriptions of drill core and cuttings together with the interpretation of the available geophysical information and field observations, five major geological units were defined and correlated.
• A Fluvial/Alluvial Unit is characterized by a heterogeneous sequence of alluvial and fluvial sediments of variable texture, dominated by clastic sediments formed by gravel and sand that surround the Salar. These fractions may present low proportions of fine sediments (sands or clays) which develop mainly along the northern and southern edges of Salar de Pastos Grandes, prograding in depth towards the center to interdigitate with finer silt sediments (clay and sandy clays) from the Central Clastics Unit.
• An Upper Clay Unit (Blanca Lila Fm) occurs in the center-south of the basin as well as in the western margins where it occurs in outcrop. This clay-dominated unit intercalates with layers of evaporites, halites, and borates.
• A Saline/Lacustrine Unit occurs immediately below the Blanca Lila Fm and in the north-central part of the Salar at surface. This Unit is characterized by a massive and compact halite body with the presence of interstitial clastic material and occasional intercalations of finer levels of clay. The average thickness of this Unit ranges between 200 m and 300 m, reaching maximum thicknesses of 700 m in the central-eastern sector of the basin which is interpreted as an ancient depocenter.
|
• A Central Clastic Unit consists of clay and clayey sands and occurs within the central sector of the basin underneath the halite deposits and seems to represent a distal sector of an alluvial fan and its interaction with marginal lacustrine deposits of the Salar.
• A Base Breccia/Gravels Unit is a sedimentary breccia unit of coarse fragments of silicified conglomerate and ignimbrites. It contains intermixed levels of sand and gravel with a thickness of 200 m on the western edge of the basin and deepening towards the north-central limit of the resource area where due to limited information its thickness becomes uncertain.
The brines from Pastos Grandes are solutions saturated in sodium chloride with an average concentration of total dissolved solids (TDS) of 302 g/L and an average density of 1.19 g/cm3. The other components present in the Pastos Grandes brine are K, Li, Mg, SO4, Cl and B with relatively low Ca. The brine can be classified as a sulphate-chloride type with anomalous lithium. Lithium concentrations in Salar de Pastos Grandes have an average value of 392 mg/L, with some samples reaching up to 700 mg/L.
Table 1.1 shows a breakdown of the principal chemical constituents in the Pastos Grandes brine including maximum, average, and minimum values, based on 501 primary brine samples collected between 2017 and 2022.
Table 1.1 Maximum, average and minimum elemental concentrations of the Pastos Grandes brine
|
|
B |
Ca |
Cl |
Li |
Mg |
K |
Na |
SO4 |
Density |
|
Units |
mg/L |
mg/L |
mg/L |
mg/L |
mg/L |
mg/L |
mg/L |
mg/L |
g/cm3 |
|
Maximum |
938.00 |
1,707 |
196,869 |
701.0 |
5,130 |
6,660 |
130,032 |
13,998 |
1,22 |
|
Average |
557.62 |
821 |
169,838 |
391.8 |
2,257 |
3,733 |
102,381 |
7,547 |
1,19 |
|
Minimum |
20.2 |
11.00 |
116.00 |
8.75 |
23.20 |
18.00 |
196.00 |
12.00 |
1,00 |
Brine quality is evaluated through the relationship of the elements of commercial interest, such as lithium and potassium with those components that constitute impurities, such as Mg, Ca and SO4. The calculated ratios for the averaged chemical composition are presented in Table 1.2.
Table 1.2 Average values (mg/L) of key components and ratios for the Pastos Grandes brine
|
K |
Li |
Mg |
Ca |
SO4 |
B |
Mg/Li |
K/Li |
|
3,733 |
392 |
2,257 |
821 |
7,547 |
558 |
5.76 |
9.53 |
|
1.5 Drilling and testing
Three drilling campaigns have been carried out for the Project since 2011. Eramet SA ("Eramet") conducted the first exploration program in 2011 including 11 shallow exploration boreholes ("SW" series), two diamond drill holes (DW01PGDDH and DW02PGDDH), four shallow exploration holes completed with 6-inch diameter casing ("PMP" series), and three exploration wells of varying depths completed with 6-inch diameter casing (DW03PG, DW04PG, DW05PG).
The second and third campaigns conducted by Millennial included 32 brine exploration boreholes (PGMW16-01 through PGMW19-22), 6 freshwater exploration wells (PGWW18-01 to PGWW19-06) and 4 brine production wells (PGPW16-01 to PGPW18-17) with drilling depths of up to 640 m. Most of the monitoring wells were completed as piezometers with 2-inch diameter PVC slotted casing, while production wells were constructed with 6 to 8-inch diameter screened casing.
AMSA carried out a drilling program on the Sal de la Puna Project immediately south and adjacent to the LAC properties in Salar de Pastos Grandes during 2021/2. This program consisted of two diamond core holes (DD-01 and DD-02), three combination core /rotary holes (RR-01 through RR-03), a production well (PW-1), and several piezometer installations.
The exploration drilling during these campaigns allowed for the collection of continuous cores to prepare "undisturbed" samples from specified depth intervals for laboratory porosity analyses and the collection of depth-representative brine samples at specified intervals. A total of 76 drainable porosity analyses were carried out and 501 primary brine chemistry analyses have been received from certified laboratories.
Eight pumping tests had been completed in Salar de Pastos Grandes. These tests included three one-day tests on freshwater wells PGWW18-02, PGWW19-02 and PGWW19-03, three three-day tests on brine wells PGPW16-01, PGPW18-15 and PGPW18-17; and two long-term pumping tests on brine wells PGPW16-01 and PGPW17-04.
1.6 Current project status
LAR is currently carrying out additional works, engineering, and other optimization studies with the view of publishing an updated technical report supporting the economic and other parameters for the Project and arrive to a construction decision by the end of 2025. LAR further anticipates conducting work to evaluate consolidating the Pastos Grandes basin to include potential upside from the Sal de la Puna Project.
1.7 Mineral resources
The brine resource estimate was determined by defining the aquifer geometry, the drainable porosity or specific yield ("Sy") of the hydrogeological units in the Salar, and the concentration of the elements of economic interest, mainly lithium and potassium. Brine resources were defined as the product of the first three parameters. The model resource estimate is limited to the PGSA mining concessions in Salar de Pastos Grandes and do not include the AMSA properties The resource model domain is constrained by the following factors:
|
● The upper boundary of the model is determined by the highest elevation samples within the dataset and, or the phreatic brine level.
● The lateral extent of the resource model covers an area of 56 km2, confined within the boundaries of the PGSA mining claims in the Salar. Additionally, the extent is restricted by the contact between the Quaternary basin and the underlying basement rock.
● The lower boundary of the model domain is set to coincide with the basement from the geological model or the total depth of 635 m when the basement is not present.
The specific yield values used to develop the resources are based on results of the logging and hydrogeological interpretation of chip samples and recovered core from the drilling programs, results of drainable porosity analyses carried out on 76 undisturbed core samples by Corelabs, GeoSystems Analysis, Daniel B Stephens & Associates. Boreholes within the measured and indicated resource areas are appropriately spaced at a borehole density of one bore per 4 km2. Table 1.3 shows the drainable porosity values assigned to the different geological units for the resource model. The distributions of lithium and potassium concentrations in the model domain are based on a total of 501 brine analyses (not including QA/QC analyses).
Table 1.3 Results of drainable porosity analyses
|
Lithology |
Sy Average |
|
Blanca Lila |
0.5% |
|
Alluvium |
13.9% |
|
Saline Lacustrine |
4.1% |
|
Clastic Central |
5.4% |
|
Base Gravels |
12.5% |
The resource estimation for the Project was developed using the Stanford Geostatistical Modelling Software (SGeMS) and the geological model as a reliable representation of the local lithology. The author was closely involved with the block model development; all results have been reviewed and checked at various stages and are believed to be valid and appropriate for these resource estimates. Table 1.4 shows the mineral resource estimate for lithium and potassium for the PGSA mining claims of the Pastos Grandes Project.
|
Table 1.4 Mineral Resources of the PGSA mining claims - Dated December 31, 2024
| Measured (M) | Indicated (I) | M+I | Inferred (I) | |||||
| Li | K | Li | K | Li | K | Li | K | |
| Aquifer volume (km3) | 13.45 | 2.15 | 15.60 | 5.22 | ||||
| Mean specific yield (Sy) | 0.11 | 0.06 | 0.10 | 0.08 | ||||
| Brine volume (km3) | 1.5 | 0.1 | 1.6 | 0.4 | ||||
| Mean grade (g/m3) | 49 | 495 | 26 | 260 | 46 | 462 | 39 | 403 |
| Concentration (mg/l) | 438 | 4419 | 457 | 4,655 | 441 | 4,452 | 460 | 4,794 |
| Resource (tonnes) | 662,000 | 6,660,000 | 57,000 | 570,000 | 719,000 | 7,230,000 | 205,000 | 2,100,000 |
| LAR 85.1% interest (tonnes) | 563,000 | 5,668,000 | 49,000 | 485,000 | 612,000 | 6,153,000 | 174,000 | 1,787,000 |
Notes to the resource estimate (Table 1.4):
1. S-K 1300 definitions were followed for Mineral Resources.
2. The Qualified Person for this Mineral Resource estimate is Frederik Reidel, CPG
3. No Mineral Reserves have been estimated for this updated Mineral Resource Estimate.
4. The Mineral Resource Estimate is reported as lithium contained in brine in-situ.
5. The Mineral Resource Estimate is not a Mineral Reserve Estimate and does not have demonstrated economic viability. There is no certainty that all or any part of the Mineral Resources will be converted to Mineral Reserves. Inferred Resources have great uncertainty as to their existence and whether they can be mined economically.
6. A cut-off grade of 200 mg/l has been applied to the M+I+I resources estimates.
The cutoff grade is based on the various inputs and the formula blow:

Where:
Total Capital Expenditure= USS 1,781 million
Total Operating Expenditure = USS 6,020 million
Cost of Capital = USS 178 million (10 percent of Total Capital)
Total Brine Extracted = 628 Mm3
Conversion from Li to Li2CO3= 5.323
Projected LCE Price = USS 20,00 per metric ton of LCE
Export Duties =4.5%
Royalties= 3.0%
Calculated Recovery= 65%
Resulting in a calculated cut-off grade of 200 mg/l.
Factors that may affect the Brine Resource estimate include: locations of aquifer boundaries; lateral continuity of key aquifer zones; presence of fresh and brackish water which have the potential to dilute the brine in the wellfield area; the uniformity of aquifer parameters within specific aquifer units; commodity price assumptions; changes to hydrogeological, metallurgical recovery, and extraction assumptions; density assignments; and input factors used to assess reasonable prospects for eventual economic extraction. Currently, Mr. F. Reidel (the QP), does not know any environmental, legal, title, taxation, socio-economic, marketing, political, or other factors that would materially affect the current Resource estimate.
7. Numbers may not add due to rounding averaging.
8. The effective date is December 31, 2024.
|
1.8 Capital and operation costs
The capital investment for the Pastos Grandes Project, including equipment, materials, indirect costs and contingencies during the construction period is estimated to be US$ 880 million. This total does not include possible capitalized interest expenses that might be incurred during the same period. Out of this, total Direct Project Costs represent US$ 590 million, Indirect Project Costs represent US$ 59 million, and the provision for Contingencies is US$ 81 million. Indirect costs represent 7 % of total project costs, while contingencies are 10 % of the total estimated project costs.
The operating cost estimate has been prepared for the production of 24,000 TPY of battery grade (BG) Li2CO3. No production of KCl is considered at this time. The process definition for the project was carried out and delivered by LAR. A Pilot Plant facility was installed in PGSA properties near the salar which will be fed with concentrated brine from pilot plant on the salar. Vendor quotations have been used for reagents costs. Energy prices - mainly natural gas and diesel fuel- and chemicals prices correspond to expected costs at the project's delivery point.
Table 1.5 OPEX estimate
| OPEX | USD/t |
| Reagents | 2,881 |
| Natural gas | 67 |
| Electric Power | 420 |
| Required manpower | 700 |
| Pond harvesting | 752 |
| Others | 1,362 |
| Total | 6,183 |
1.9 Conclusion and Recommendations
Based on the analyses and interpretation of the exploration work carried out for the Pastos Grandes Project between 2011 and 2023, the following concluding statements are prepared:
• The entire Project area has been covered by exploratory drilling between 2011 and 2023 at an approximate borehole density of one exploration borehole per 4 km2; it is the opinion of the author that such borehole density is appropriate for the mineral resource estimate described herein.
|
• The results of drilling 18 core holes and 30 rotary boreholes and the analysis of 501 primary brine samples (excluding QA/QC samples) identify distinct brine composition and grade at specific depth intervals, showing a relatively uniform distribution of lithium bearing brines throughout the Project to a depth of 635 m. The brine composition for the Project is summarized in Table 1.1.
• The lithium bearing brine contains sufficient levels of lithium and potassium to be potentially economic for development.
• Pumping tests carried in productions wells completed in this lower brine aquifer supported brine production rates of 25 L/s over 30-day durations indicating favorable hydrogeological conditions and that brine can be commercially produced with conventional wellfield techniques.
• Geophysical surveys and brine exploration drilling carried out within the Project area indicate that the limits of the lower brine aquifer remain open laterally and at depth so that important exploration potential exists to significantly increase the lithium resources documented in the report.
• It is the opinion of the author that the Salar geometry, brine chemistry composition, and the specific yield of the Salar sediments have been adequately defined to a depth 635 m to support the mineral resource estimate described in Table 22.2.
The following technical work is recommended to further advance the Project towards construction and into production.
• Incorporate the lithium resources hosted on the AMSA properties into the resource estimate for the Project so that these resources can be properly incorporated in the numerical groundwater flow and transport modeling for final brine production wellfield design, evaluation of potential environmental constraints, and the estimation of updated reserves.
• Carry out a 30-day pumping test on AMSA production well PW-1 to characterize the southern extent of the lower brine aquifer.
• Drill three deep core holes into the lower brine aquifer to improve the confidence level of geological and drainable porosity parameters in the central clastics and basal gravel /breccia units. These holes should be completed as deep monitoring wells for additional observations point during the additional pumping tests recommended.
• Carry out 30-day pumping tests in existing brine production wells PGPW18-15 and PGPW18-17 with water level monitoring in the above-mentioned new observations points.
• Carry out 7-day pumping test on water production wells PGMW19-2 and PGPW19-3 along with additional groundwater exploration work to secure future water supply requirements from freshwater resources within the Pastos Grandes and Sijes basins.
• Numerical modelling should be resumed with the AMSA-developed 3D FEFLOW groundwater flow and transport model for the basin to carry out predictive simulations for the design and layout of the future brine production wellfield, evaluation of potential environmental effects, and the preparation of updated lithium reserves for the Project.
|
• Based on the results of the predictive model simulations drill and complete three additional brine production wells in the lower brine aquifer.
• Implement systematic hydro(geo)logical monitoring programs of surface water and groundwater features to reinforce the baseline characterization of the Pastos Grandes basin. Continue with the surveys and studies to improve the quantification of the water balance components of the basin.
• Drill 7-10 deep exploration core holes aimed at increasing the lithium resource base of the Project.
• Drill 4 industrial water exploration wells to evaluate the resources and optimize the production strategy, including Arena Minerals' blocks to the North and East of the basin.
|
2 INTRODUCTION
2.1 Terms of reference
LAR acquired the Pastos Grandes Project from Millennial in January 2022. LAR subsequently acquired additional mining concessions (LAC Norte and Sur) during 2022. LAR retained Atacama Water to prepare this Technical Report Summary for the Pastos Grandes Project with the objective of updating the mineral resource estimate for lithium contained in brine for the LAR properties in the Pastos Grandes basin based on the consolidation and integration of available information.
LAR completed the acquisition of all the shares of AMSA in April 2023. AMSA owns 65% of the Sal de la Puna Project through a joint venture interest in Sal de la Puna Holdings Ltd. the 100% owner of the Argentine subsidiary, PASAU, the owner of the claims forming part of the Sal del la Puna Project. The remaining 35% of Sal de la Puna Holdings Ltd. is owned by joint venture partner Ganfeng New Energy Technology Development (Suzhou) Co., Ltd. The mineral resource estimate presented herein does not include any resource on the Sal de la Puna properties. LAR anticipates conducting additional work to evaluate consolidating the Pastos Grandes basin to include potential upside from the Sal de la Puna Project."
This Technical Report Summary was prepared in accordance with the requirements of Regulation S-K, Subpart 1300 of the SEC. The Report also includes technical judgment of appropriate additional technical parameters to accommodate certain specific characteristics of minerals hosted in liquid brine as outlined in CIM Best Practice Guidelines for Resource and Reserve Estimation for Lithium Brines and as discussed by Houston (Houston et al, 2011).
2.2 Qualifications of Qualified Persons
2.2.1 Qualified Person
Frederik Reidel serves as the Qualified Person (QP) for this Report in compliance with 17 CFR § 229.1300.
Frederik Reidel, AIPG, has been involved with exploration and development efforts of the Pastos Grandes Salar since 2022 and visited the Pastos Grandes area on various occasions. Mr. Reidel is an independent consultant to the lithium industry and a Qualified Person (QP) as defined by 17 CFR §229.1300. He is Certified Professional Geologist (# 11454) with the American Institute of Professional Geologist (AIPG) and Competent Person (# 390) with the Chilean Mining Commission (CCCRRM), and co-author of" Complementary Guidelines for Mineral Resource and Reserve Estimation in Brines" for Chilean Code CH 20.235. He has carried out brine resource evaluation work in Salares de Cauchari, Centenario, Diablillos, Maricunga, Pastos Grandes, and Pocitos over the last 15 years. Mr. Reidel is not an employee of or otherwise affiliated with LAR.
LAR is satisfied that the QP meets the qualifying criteria under 17 CFR § 229.1300.
|
2.2.2 Site Visits
Frederik Reidel last visited the Pastos Grandes site in November 2024. Specific work carried out during the visit included review of existing wells, planning of future drilling and testing work for the ongoing development of the Project and meetings with site geologists and management.
2.3 Effective Date
The Effective Date of this report of the Mineral Resource estimate is December 31, 2024.
2.4 Previous Technical Reports
This SEC Technical Report Summary is the first that has been prepared for LAR's Pastos Grandes Project. Thus, this report is not an update of a previously filed Technical Report Summary under the SK Regulations.
2.5 Reference Reports
Previous technical reports prepared for the Project, which were not prepared in accordance with S-K 1300, include:
● Technical Report on Pastos Grandes Project. Prepared for LSC Lithium Corporation by Hains Engineering Company Limited. Dated October 2018
● Technical Report: Phase III Measured, Indicated, and Inferred Lithium and Potassium Resource Estimate, Pastos Grandes Project, Salta Province, Argentina, prepared by Montgomery & Associates for Millennial Lithium Corporation. Dated May 2019.
● Technical Report: Feasibility Study of the Pastos Grandes Project, Salta Province, Argentina, Technical Report No. 209020-00055-000-GE-TEN-0003 prepared by WorleyParsons and Montgomery & Associates for Millennial Lithium. Dated July 2019.
● Technical Report: Sal de la Puna Lithium Project, Pastos Grandes Salt Lake, Salta Province, Argentina prepared for Arena Minerals by independent consultants Murray Booker and Pablo Gómez. Dated September 29, 2021.
● Technical Report: Lithium Resources Update Pastos Grandes Project, Salta Provice, Argentina prepared for Lithium Americas Corp by Frederik Reidel. Dated April 30, 2023.
|
2.6 Sources of information
The author was provided full access to the LAR databases including drill core and cuttings, drilling and testing results, brine chemistry and porosity laboratory analyses, aquifer testing results, geophysical surveys, and all other information available from the work carried out on the Project between 2011 and 2025. Meetings and other communication took place between LAR staff and the author to facilitate the preparation of this report. The documentation reviewed, and other sources of information, are listed at the end of this report in Chapter 24 References.
2.7 Specific Characteristics of Lithium Brine Projects
Although extensive exploration and development of new lithium brine projects has been underway for the last decade it is important to note there are essential differences between brine extraction and hard rock lithium, base, or precious metal mining. Brine is a fluid hosted in an aquifer and thus can flow and mix with adjacent fluids once pumping of the brine commences. An initial in-situ resource estimate is based on knowledge of the geometry of the aquifer, and the variations in porosity and brine grade within the aquifer.
Brine deposits are exploited by pumping the brine to the surface and extracting the lithium in a specialist production plant, generally following brine concentration through solar evaporation in large evaporation ponds. To assess the recoverable reserve, further information on the permeability and flow regime in the aquifer and the surrounding area is necessary to be able to predict how the lithium contained in brine will change over the Project's life. These considerations are examined more fully in Houston et. al., (2011) and in the Canadian Institute of Mining (CIM) and Joint Ore Reserve Committee (JORC) (Australia) brine reporting guidelines. The reader is referred to these key publications for further explanation of the details of brine deposits.
Hydrogeology is a specialist discipline which involves the use of specialized terms which are frequently used throughout this document. The reader is referred to the glossary for definition of terms.
2.8 Units of Measure & Glossary of Terms
The metric (SI system) units of measure are used in this report unless otherwise noted. Table 2.1 provides a list of abbreviations used in this Technical Report. All currency in this report is in US dollars (US$) unless otherwise noted.
Table 2.1 Acronyms and Abbreviations.
| Abbreviation | Definition |
| AA | atomic absorption |
| AMC | Argentina Mining Code |
| BG | battery-grade |
|
|
Abbreviation |
Definition |
|
CAGR |
Compound annual growth rate |
|
CAPSA |
Compañía Argentina de Perforaciones S.A. |
|
CIM |
Canadian Institute of Mining, Metallurgy and Petroleum |
|
CRP |
Community Relations Plan |
|
DIA |
Environmental Impact Assessment (Declaración de Impacto Ambiental) |
|
EIR |
Environmental Impact Report |
|
EV |
electric vehicles |
|
EVT |
evapotranspiration |
|
FOB |
free on board |
|
HSECMS |
Health, Safety, and Environmental Management System |
|
ICP |
inductively coupled plasma |
|
IRR |
Internal rate of return |
|
IX |
ion exchange |
|
JORC |
Joint Ore Reserve Committee (Australia) |
|
KCl |
potassium chloride |
|
Kr |
hydraulic conductivity in the radial (horizontal) direction |
|
Kz |
hydraulic conductivity in the vertical direction |
|
LC |
lithium carbonate |
|
LCE |
lithium carbonate equivalent |
|
LFP |
lithium-iron-phosphate |
|
Li |
lithium |
|
LOM |
life of mine |
|
NI |
Canadian National Instrument |
|
NPV |
net present value |
|
NaCl |
Halite Salts |
|
OSC |
Ontario Securities Commission |
|
QA/QC |
quality assurance/quality control |
|
|
Abbreviation |
Definition |
|
QP |
Qualified Person |
|
RO |
reverse osmosis |
|
RC |
reverse circulation |
|
TDS |
total dissolved solids |
Table 2.2 Units of measurement
| Abbreviation | Description |
| °C | degrees Celsius |
| % | percent |
| AR$ | Argentinean peso |
| US$ | United States dollar |
| dmt | dry metric tonnes |
| G | grams |
| GWh | Gigawatt hours |
| ha | hectare |
| Hr | hour |
| Kg | kilogram |
| L | liters |
| L/min | liters per minute |
| L/s | liters per second |
| L/s/m | liters per second per meter |
| kdmt | thousand dry metric tonnes |
| km | kilometer |
| km2 | square kilometers |
| km/hr | kilometer per hour |
| Kt | Kilotonne |
| ktpa | kilotonne per annum |
|
|
Abbreviation |
Description |
|
kVa |
kilovolt amp |
|
M |
million |
|
M |
meters |
|
m2 |
square meter |
|
m3 |
cubic meters |
|
m3/hr |
cubic meters per hour |
|
m bls |
meters below land surface |
|
m btoc |
meters below top of casing |
|
m/d |
meters per day |
|
min |
minute |
|
mm |
millimeter |
|
mm/a |
millimeters annually |
|
mg |
milligram |
|
Mt |
million tonnes |
|
MVA |
megavolt-ampere |
|
ppm |
Parts per million |
|
ppb |
parts per billion |
|
T |
tonne |
|
S |
second |
|
Sy |
Specific yield or Drainable Porosity unit of porosity (percentage) |
|
Ss |
Specific Storage |
|
tpa |
tonnes per annum |
|
µm |
micrometer |
|
μS |
microSeimens |
|
V |
volt |
|
w/w |
weight per weight |
|
wt% |
weight percent |
|
Yr |
year |
|
3 PROPERTY DESCRIPTION AND LOCATION
3.1 Property location
The Pastos Grandes Project is situated within the Department of Los Andes, approximately 10 km south of the village of Santa Rosa de Los Pastos Grandes, and 130 km west of the city of Salta, the capital of the Salta Province in Argentina. The property's location is defined by its center point, which is situated at approximately 3,428,966 mE, 7,283,194 mN (POSGAR 04 / Argentina zone 3). The Project encompasses a surface area of more than 24,000 hectares in Salar de Pastos Grandes at an elevation of roughly 3,785 masl.
The Project site is situated near Highway 129 which connects 40 km north with Highway 51. Highway 51 traverses from Salta to the international border with Chile at the Sico Pass and connects further west to the major mining center of Calama, as well as the ports of Antofagasta and Mejillones in northern Chile. Both ports are major transportation hubs for the importation of mining equipment and the exportation of mineral commodities. Figure 3.1 shows the general location map of the Project.
3.2 Mining license
The location of LAR mining concessions is shown in Figure 3.2 , and the property information is summarized in Table 2.2. Tenement coordinates are given in the Argentine coordinate system which uses the Gauss Krueger Transverse Mercator projection and the Argentine Posgar 94 datum. The properties are in Argentine GK Zone 3. All other map coordinates used in this report are Posgar 94 except where noted.
The Argentine mining regulations recognize two types of tenements. Cateos, also known as Exploration Permits, grant permission to explore the tenement for a period that is proportional to its size. The duration of an Exploration Permit is determined by the size of the tenement, with a 1 unit (500 hectares) permit lasting 150 days, and additional units (500 hectares) extending the permit by 50 days each. The largest permit allowed is 20 units (10,000 hectares) and lasts for 1,100 days, starting 30 days after issuance of the permit. The permit holder must submit an exploration work plan and an environmental impact assessment and pay a fee of $1,600 Argentine pesos per unit (500 hectares). Additionally, the permit holder must make relinquishments after 300 and 700 days.
|
On the other hand, mining exploitation concessions/licenses are known as "Mines" or "Claims". This kind of permits grant authorization to exploit the tenement, subject to regulatory environmental approval. These licenses have no time limit, provided that the property holder fulfils their obligations under the Mining Code. These obligations include, among others:
• Paying the annual rent (canon);
• Completing a survey of the property boundaries;
• Submitting a mining investment plan; and
• Meeting the minimum investment commitment.
The PGSA properties are registered as "Mines" under the file numbers listed in Table 3.1 in the Department of Los Andes (Salta Province). It should be noted that the recently acquired AMSA properties are not included in this list.
|
Figure 3.1 Location map of the Pastos Grandes Project
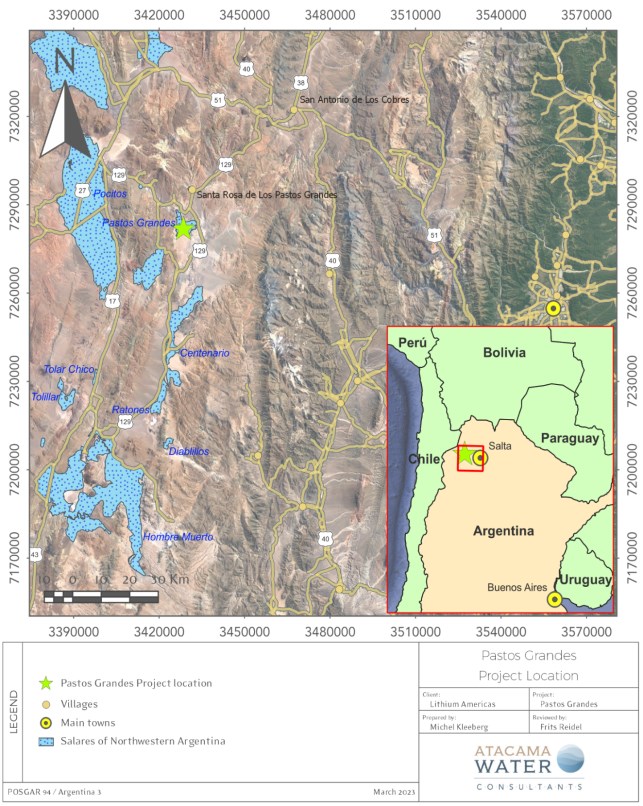
|
3.3 Ownership and title
Prior to August 2024, LAR held 100% of the ownership of PGSA. In August 2024, LAR sold a 14.9% interest in PGSA to a subsidiary of Ganfeng Lithium Co, Ltd. Through it 85.1% ownership in PGSA, LAR controls the mining concessions of the Pastos Grandes Project. A legal opinion was provided by Mr. Rafael Argañaraz Olivero on February 25, 2025 that the mining concessions held by PGSA, listed in Table 3.1 below are in good standing as of December 31, 2024.
Table 3.1 PGSA mining tenements
| Nª | Name | File No. | Property | Salar | Surface area (ha) |
| 1 | Aguamarga 10 | 19092 | PPG-SA | Pastos Grandes | 3,087 |
| 2 | Aguamarga 15 | 19097 | PPG-SA | Pastos Grandes | 1,298 |
| 3 | Centenario I | 19475 | PPG-SA | Pastos Grandes | 799 |
| 4 | Corral colorado - Cantera | 24333 | PPG-SA | Pastos Grandes | 50 |
| 5 | Daniel Ramon | 18571 | PPG-SA | Pastos Grandes | 1,837 |
| 6 | El Milagro | 17588 | PPG-SA | Pastos Grandes | 101 |
| 7 | Ignacio I | 17606 | PPG-SA | Pastos Grandes | 501 |
| 8 | Ignacio IV | 17630 | PPG-SA | Pastos Grandes | 178 |
| 9 | Ignacio IV (*) | 17630 | PPG-SA | Pastos Grandes | 850 |
| 10 | Jorge Eduardo | 18693 | PPG-SA | Pastos Grandes | 598 |
| 11 | Neptali II. | 18403 | PPG-SA | Pastos Grandes | 166 |
| 12 | Norte Argentino I | 18550 | PPG-SA | Pastos Grandes | 358 |
| 13 | Nueva Sijesytea-01 | 23736 | PPG-SA | Pastos Grandes | 110 |
| 14 | Ona | 1268 | PPG-SA | Pastos Grandes | 297 |
| 15 | Papadopulos LXXIV | 20247 | PPG-SA | Pastos Grandes | 3,044 |
| 16 | Papadopulos XXXII | 19667 | PPG-SA | Pastos Grandes | 301 |
| 17 | PPG01. | 24231 | PPG-SA | Pastos Grandes | 971 |
| 18 | PPG02 | 24255 | PPG-SA | Pastos Grandes | 3,324 |
| 19 | PPG04 | 734830 | PPG-SA | Pastos Grandes | 95 |
| 20 | PPG05 (ULEX-BORAX-PPG) | 741663 | PPG-SA - PASA | Pastos Grandes | 231 |
| 21 | TABAPG | 20016 | PPG-SA | Pastos Grandes | 316 |
|
Figure 3.2 Location map of PGSA mining concessions
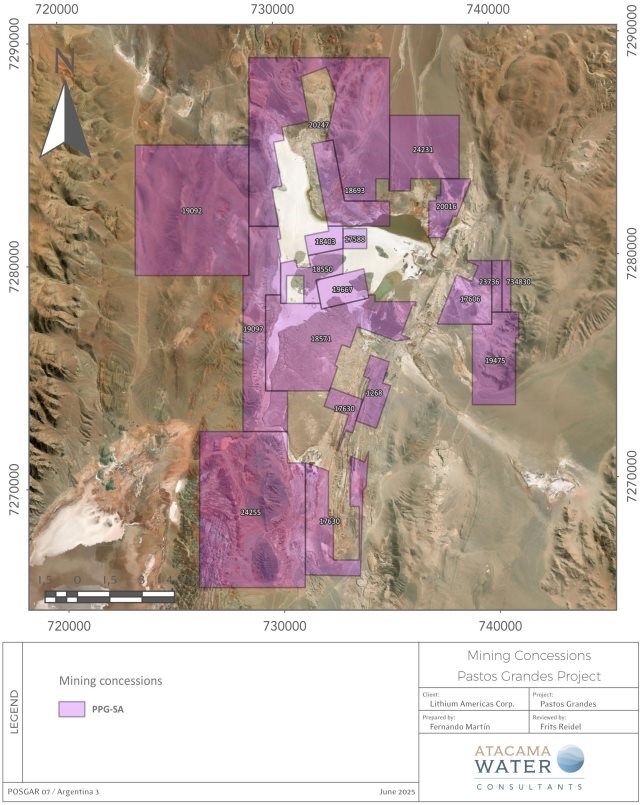
|
3.4 Royalties
The Argentine federal government regulates ownership of mineral resources, although mineral properties are administered by the provinces. In 1993 the federal government established a limit of 3% on mining royalties to be paid to the provinces as a percentage of the "pit head" value of extracted minerals. ANG is expecting a 3% royalty payable to the Salta Province based on earnings before income tax if a brine mining operation is established.
3.5 Environmental liabilities
The author is not aware that the Project is subject to any material environmental liabilities.
3.6 Other significant factors and risks
Several normal risk factors are associated with the property. These risks include but are not limited to the following:
● Mining properties may not be renewed by the provincial authorities.
● Final environmental approvals may not be received from the local authorities.
● Obtaining all necessary licenses and permits on acceptable terms in a timely manner or at all.
● Changes in federal or provincial laws and their implementation may impact planned activities.
● The company may be unable to meet its obligations for expenditure and maintenance of property licenses.
● Activities on adjacent properties may have an impact on the Project.
|
4 ACCESSIBILITY, CLIMATE, LOCAL RESOURCES, INFRASTRUCTURE AND PHYSIOGRAPHY
4.1 Accessibility
From the city of Salta the Project is reached via the town of Campo Quijano, then continuing along National Route 51 (RN-51) through Quebrada del Toro, the town of San Antonio de los Cobres, and a further 15 km to the junction with Provincial Route 129 (RP-129). 45 km to the Southwest is the village of Santa Rosa de Los Pastos Grandes, which is located 8 km in a straight line to the north of the Salar. Total driving time from Salta to the Project is approximately 4 hours.
The distance between San Salvador de Jujuy and the Project is approximately 330 km and takes about 5 hours by car. The access from Jujuy is via National Route 9 (RN 9) for approximately 60 km to the north until reaching the town of Purmamarca, from there National Route 52R (RN52) for a further 150 km, passing the village of Susques to RP 40 reaching San Antonio de Los Cobres, where the same route described above leads to the village of Santa Rosa de los Pastos Grandes and then to the Salar.
San Antonio de los Cobres is 50 km to the northeast from the Project with a population of approximately 5,500. It hosts the regional administration and has a hospital, petroleum and gas services, and several hotels. The village of Pocitos with a population of approximately 100 is located some 40 km to the northwest of the Project. It is envisaged that some labour force will be contracted from these localities.
4.2 Physiography
The hydrographic basin of the Salar de Pastos Grandes covers 1,690 km2 in the Altiplano of Northwestern Argentina. The average elevation of the basin is 4.301 masl while the maximum and minimum elevations are 6,004 masl and 3,767 masl respectively. The Pastos Grandes Basin has been divided into two subbasins according to topographic criteria, the Río Sijes sub-basin at the east and Pastos Grandes sub-basin at the west as shown in Figure 4.1. The active saline crust of the Salar is in the western section of the hydrographic basin and covers near 31.4 km2. The salar nucleus sits at an approximately elevation of 3,767 masl.
Unlike other salars of the region, the topography of the nucleus of the Salar the Pastos Grandes is irregular. The current saline crust flat is disrupted over approximately 15% of its area by elevated outcrops of Blanca Lila Formation, which have been interpreted as slightly older salar sediments that have been eroded yet remained as more resistant "islands".
|
Figure 4.1 Hydrological subdivisions of the Pastos Grandes Basin
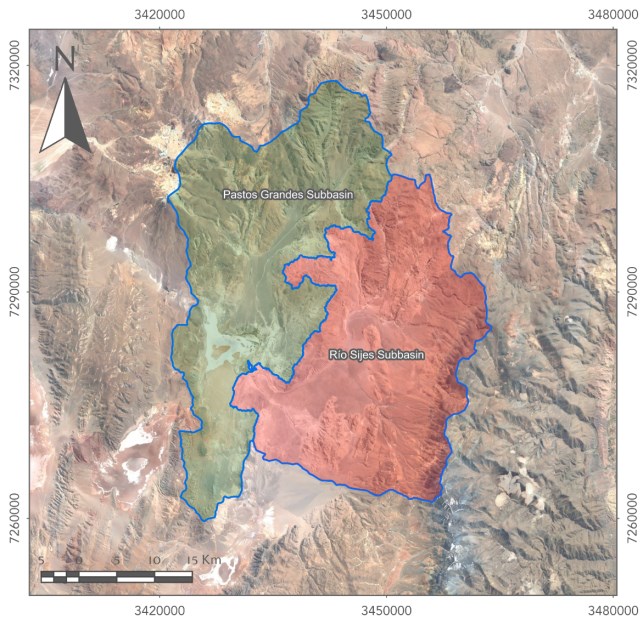
Surface runoff is mainly restricted to the rainy season during summer. Three intermittent to ephemeral rivers enter the Salar, Rio Sijes from the east, Rio Pastos Grandes from the north, and Rio Corral Colorado from the northeast. Flow in Rio Sijes may originate from groundwater discharge to the surface system near the exit point of the Sijes subbasin into the Pastos Grandes. Average flow of Río Sijes has been measured at 160 l/s. Flow in Rio Corral Colorado has been measured at 44 L/s and in Rio Pastos Grandes at 38 L/s. A systemic surface monitoring is being implemented during 2023 to obtain a better understanding of the flow regimes in these rivers throughout the different seasons of the year.
|
Three semi-permanent lagoons occur near the discharge areas of the three above-mentioned rivers into the nucleus of the Salar. Springs and wetlands occur towards the north of the Salar over the interface between the alluvium and evaporitic crust in the lower parts of the Rio Pastos Grandes and Rio Corral Colorado.
Figure 4.2 Surface water features within Pastos Grandes basin
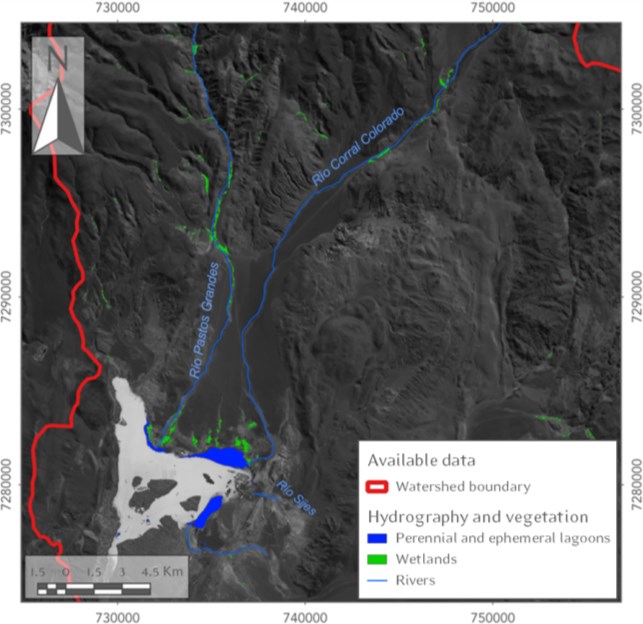
4.3 Climate
The climate in the Project area is severe and can be described as a typical continental, cold, high-altitude desert, with resultant scarce vegetation. Daily temperature variations may exceed 25oC. Solar radiation is intense, especially during the months of October through March leading to high evaporation rates. The rainy season occurs between the months of December and March when occasional flooding can develop in the Salar and may limit certain exploration activities.
|
Limited historical climate data are available for the Project and the surrounding areas and is mainly derived from public government-operated stations. These records extend from 1950 to 1990 with 30 years of complete information for most stations. Private data from other companies operating in the region have shorter recording periods including 10 years at El Fénix station from FMC in Salar de Hombre Muerto. Locally, the Project maintained a meteorological station during 2017-2018, completing 10 months of measurements to help building a preliminary water balance for the basin. Mean annual precipitation measured at these stations range from 48 to 121 mm/year while the mean temperature is between 4.7 - 8.1 °C. Eramine also installed in 2012 a station within the Salar with 18 months of records.
Figure 4.3 shows the location of the meteorological stations that were used to characterize the climate for the region.
4.3.1 Temperature
It has been observed that due to the relative proximity and similar elevation, the temperature of Salar de Pastos Grandes exhibits a similar pattern to the San Antonio de Los Cobres and Mina Concordia stations (Dworzanowski et al., 2019). The data between 1950 and 2001 show a mean temperature of these stations of about 7°C, ranging from 1.7°C in winter to 11°C in summer. Daily variations are close to 20°C.
4.3.2 Rainfall
The rainy season occurs between the months of December and March, where most of the annual rainfall occurs often in brief convective storms that originate from Amazonia to the northeast. The period between April and November is typically dry. Annual rainfall tends to increase towards the northeast, especially at lower elevations. Significant control on annual rainfall is exerted by ENSO (El Niño-Southern Oscillation) (Houston, 2006) with significant yearly differences in rainfall linked to ENSO events.
Mean annual precipitation is estimated from a relationship between precipitation and geographical location (M&A, 2018), based on historical meteorological records in for the vicinity of the Pastos Grandes basin. This relation considered latitude and elevation of each station, and was described by the following equation:

Where Pp: mean annual precipitation (mm), Z: elevation (masl), L: geographical longitude expressed in degrees.
|
Figure 4.3 Isohyet map for Salar de Pastos Grandes
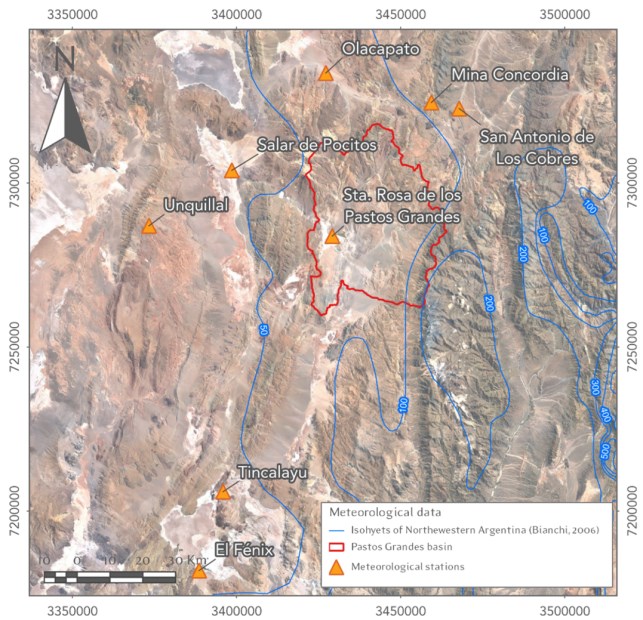
The result of this approximation is shown in Figure 4.4 where a correlation factor R2 of 0.86 was obtained which is considered adequate for the scopes of this report.
After dividing the Pastos Grandes basin into elevation bands and applying equation (1) to each different band, a mean precipitation value of 137 mm/year was estimated for the basin as shown in Figure 4.5 . This magnitude of rainfall is consistent with annual precipitation estimated for several basins of the region, as well as with the isohyet map of northwest Argentina in Figure 4.3 .
|
Figure 4.4 Correlation between observed and predicted annual precipitation (M&A,2018)
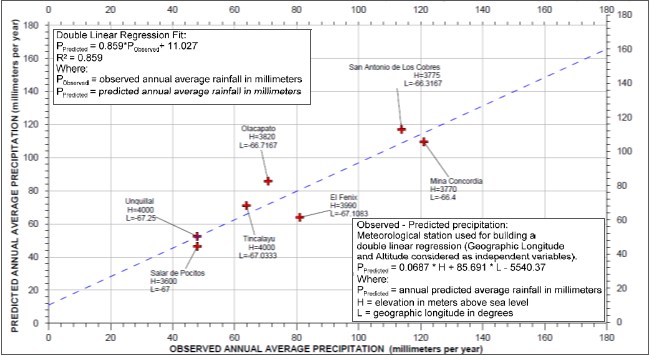
Figure 4.5 Predicted annual precipitation for the Salar de Pastos Grandes (M&A,2018)
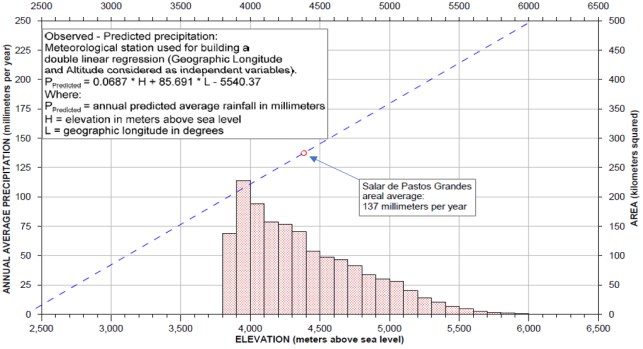
|
4.3.3 Solar radiation
Solar radiation is the most important energy input for evaporation. Long-term solar radiation data is not available for the Salar de Pastos Grandes directly. Local solar radiation measurements were taken from the meteorological station installed in 2017 which registered maximum values between 750 to 1.550 W/m2 and mean values between 200-400 W/m2 as shown in Figure 4.6 .
4.3.4 Wind
Strong winds are frequent in the Puna, reaching speeds of over 100 km/h on rare occasions with an average near 15 km/h. The wind during summer is generally pronounced after noon and usually calmed during the night. During winter wind velocities are generally higher than in summer. A summary of wind speeds measured by the Pastos Grandes meteorological station during 2017 - 2018 is shown in Figure 4.7 .
Figure 4.6 Solar radiation measured at Salar de Pastos Grandes (M&A,2018)
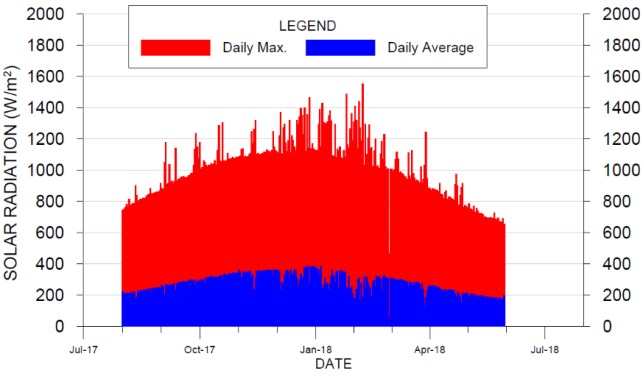
|
Figure 4.7 Wind speed measured at Salar de Pastos Grandes (M&A,2018)
4.3.5 Evaporation
Evaporation was estimated using empirical relations between evaporation and elevation derived from measured data across several salars in the Atacama Desert. Houston (2006) proposed the following equation for freshwater pan evaporation:

Where Z is the elevation of the evaporating feature.
From relation (2), and assuming mean elevation of 3,785 masl for the salar crust, pan freshwater evaporation was estimated to be 2.130 mm/year. To estimate pan brine evaporation a salinity factor (Ks) was used which is dependent on density. According to Ide (1978) this factor is described by the following equation:

Where d: fluid density (g/cm3)
Assuming the brine of Pastos Grandes has a homogeneous density of 1.2 g/cm3, the salinity correction factor reaches 0.61, leading to a pan brine evaporation of 1,299 mm/year. This rate can be broken monthly using the monthly fractional values of annual pan evaporation found in Houston (2006) as shown in Table 4.1.
|
4.3.6 Summary of meteorological parameters
A summary of the measured and estimated meteorological parameters in the Salar de Pastos Grandes is shown in Table 4.1.
Table 4.1 Principal meteorological parameters of Salar de Pastos Grandes
|
Month |
Pp1 (mm) |
T2 (°C) |
Mean solar radiation3 (W/m2) |
Maximum solar radiation4 (W/m2) |
Pan-A freshwater evaporation5 (mm) |
Pan-A brine evaporation6 (mm) |
|
Jan |
59 |
11 |
304 |
1,489 |
244.6 |
149.2 |
|
Feb |
50 |
10.8 |
271 |
1,552 |
227.8 |
138.9 |
|
Mar |
2 |
10 |
275 |
1,245 |
217.2 |
132.5 |
|
Apr |
0 |
7.5 |
230 |
976 |
168.7 |
102.9 |
|
May |
0 |
4.2 |
191 |
786 |
130.8 |
79.8 |
|
Jun |
0 |
2.3 |
#N/D |
#N/D |
113.9 |
69.5 |
|
July |
0 |
1.7 |
#N/D |
#N/D |
111.8 |
68.2 |
|
Aug |
0 |
3.9 |
227 |
916 |
132.9 |
81.0 |
|
Sep |
0 |
6 |
276 |
1,239 |
154.0 |
93.9 |
|
Oct |
0 |
8.2 |
321 |
1,306 |
198.2 |
120.9 |
|
Nov |
0 |
10 |
346 |
1,322 |
204.6 |
124.8 |
|
Dec |
3 |
10.8 |
338 |
1,466 |
225.7 |
137.6 |
|
Total |
113 |
7.2 |
278 |
1,552 |
2,130 |
1,299 |
4.4 Local Infrastructure
4.4.1 Railroad
The Project is in the vicinity of the existing railroad between Salta and Antofagasta that is administrated by two different companies: The Chilean Ferrocarril Antofagasta - Bolivia (Luksic Group) and the Argentinean state owned Ferrocarril Belgrano. It consists of a narrow-gauge railway connecting Antofagasta (Chile) on the Pacific coast to the northern part of Argentina with connections to Buenos Aires on the Atlantic coast. The connection between Pocitos - Antofagasta has been reinstated in cooperation between the regional governments and is currently active shipping product for Livent's lithium operation in Salar del Hombre Muerto.
1Annual mean precipitation observed in the Salar 2017-2018 (M&A, 2018)
2 Data taken from San Antonio de los Cobres weather station (Bianchi et al., 2005), available in https://anterior.inta.gob.ar/prorenoa/info/resultados/Precip_NOA/base_precipitaciones_noa.asp
3 Solar radiation observed in the Salar 2017-2018 (M&A, 2018)
4 Solar radiation observed in the Salar 2017-2018 (M&A, 2018)
5 Estimated by using the assumptions found in Houston (2011) and Houston (2006)
6 Estimated by using a salinity correction factor on pan freshwater evaporation (IDE, 1978)
|
4.4.2 Natural gas
A natural gas line (Gas de la Puna) with a distribution terminal is in the village of Pocitos. Here gas is redistributed to Livent in Salar del Hombre Muerto and other lithium operations in the Puna currently being developed. Natural gas provision is currently under study. One possibility is that the Project will connect to this terminal with a dedicated pipeline for the supply of natural gas during operations.
4.4.3 Water
It is expected that all industrial water supply requirements for the Project can be developed from groundwater resources hosted in the alluvial fans surrounding Salar de Pastos Grandes.
4.4.4 Surface area
The Project controls sufficient surface rights to execute the contemplated mining and processing activities.
4.5 Vegetation
Due to the extreme weather conditions in the region, the predominant vegetation is of the high-altitude xerophytic type adapted to high levels of solar radiation, winds, and severe cold. The vegetation is dominated by woody herbs of low height from 0.40 - 1.5 m, grasses, and cushion plants. The nucleus of the salar is devoid of vegetation due to its high salinity surface.
|
5 HISTORY
Borate mining has taken place in the general vicinity of Salar de Pastos Grandes since the early 1960s. Borax Argentina extracts colemanite, hydroboracite, and ulexite from the Sijes Formation located on tenements situated on the southern and eastern edges of the Pastos Grandes basin. These minerals are processed at the Sijes borates plant.
In 1979, DGFM (a state-owned Argentine arms manufacturer) conducted a lithium exploration program that covered several salars in northwestern Argentina, including Salar de Pastos Grandes (Nicolli et al., 1982). The exploration included surface mapping and sampling of six brine samples from surface, eight from hand-dug pits, and four from streams around the Salar. The sampling campaign found lithium and potassium concentration anomalies with average values of 384 parts per million (ppm) Li and 4,066 ppm K for the pit samples, and 327 ppm Li and 3,518 ppm K for the surface samples. The stream samples reported lithium concentration below detection limits.
In 1987 ULEX began borate production at the Sol de Mañana Mine in the southeastern portion of the Salar near the Rio Sijes reaching a production of near 1,000 t of colemanitehydroboracite- ulexite per year (Hains et al., 2018). Tramo SRL has mined borates (colemanite) at the Quebracho property on the southern border of Salar de Pastos Grandes and common salt (halite, NaCl) on the Salar's surface since 2006. Other smaller mining companies have also carried out salt exploitation over various properties in the Salar (Dworzanowski, 2019).
During 2011 and 2012, Eramet through its subsidiary Eramine Sudamerica SA ("Eramine") carried out exploration activities in the Salar including geophysical surveys (VES, TEM and CSAMT campaigns), drilling (exploration and production wells to maximum depth of 160 m), testing, and geochemical sampling. This work has been referred to as the Stage One investigation of the Pastos Grandes Project and identified a lithium-enriched brine aquifer with lithium concentrations ranging between 330-560 mg/L and a ratio Mg:Li of between 5.35 - 7.87.
LSC Lithium undertook an exploration program between 2016 and 2018 focused on the western and central portion of Salar de Pastos Grandes with a reported mineral resource estimate in 2018 of measured and indicated resources of 344 kt Li and of inferred resources of 58kt Li.
Millennial conducted an extensive program of field work across the Salar from 2016 to 2021 known as the Stage Two and Three investigations of the Pastos Grandes Project. These programs delineated measured and indicated resources of 4,120 kt of LCE (Montgomery & Associates 2019). A positive Feasibility Study (FS) was completed (Worley 2019) for a 24 ktpa battery lithium carbonate production plant with a 40-year mine-life using conventional lithium processing technology based on 943 kt of proven and probable Mineral Reserves. In January of 2022 LAR completed the acquisition of Millennial including the Pastos Grandes Project. LAR is not treating the mineral reserve estimate as a current mineral reserve estimate and no qualified person has done sufficient work to classify this historical mineral reserve estimate as a current mineral reserve. While the mineral reserve estimate was reported in accordance with CIM categories, the qualified person is unable to verify the relevance and reliability of the estimate at this time.
Centaur Resources ("Centaur") carried out lithium exploration activities on the 'Alma Fuerte' mining claim of its Sal de la Puna Project immediate to the south and east of the LAR mining claims during 2018/2019. This program included drilling of three boreholes including a pumping well to around 600 m depth, pumping tests, and seismic & TEM geophysical surveys. On October 19, 2021, AMSA announced the results of the maiden mineral resource estimate (effective as of September 9, 2021) conducted on its Sal de la Puna Project. An Inferred mineral resource consisting of 560,000 t LCE was defined on the Almafuerte property. The resource estimate utilized ordinary kriging for estimation of the lithium and other element concentrations. The porosity model was developed using geological logs and inverse distance squared estimation of natural gamma log data from holes, which was used to constrain the distribution of an upper halite unit and a lower clastic sediment unit. The halite unit thickens to the east across the Almafuerte property and a hard boundary for porosity data was applied at the contact.
|
The block model was developed with dimensions of 500 x 500 x 20 m (E, N, RL respectively). The plan dimensions were chosen as they are around a third of the drill hole spacing, and the shorter vertical dimension was chosen to reflect downhole data spacing. The search criteria used for the brine assay ordinary kriging estimates consisted of 2,000, 4,000 and 7,000 m and 100, 100 and 300 m in the horizontal and vertical respectively between the first and third estimation passes.
SDLP Project Lithium Resource
|
Volume |
Specific |
Volume |
Brine liters |
Li |
K |
Mg |
B |
grams |
Tonnes |
|
3,735,000,000 |
6.25% |
230,000,000 |
230,000,000,000 |
460 |
3,894 |
2,490 |
619 |
1.058E+11 |
106,000 |
SDLP Project Lithium Resource
|
Tonnes Li |
Tonnes LCE |
|
106,000 |
560,000 |
Work carried out by AMSA on the Sal de la Puna Project prior to its merger with LAR is further described in Sections 10 and 24 below.
 |
6 GEOLOGICAL SETTING, MINERALIZATION, AND DEPOSIT
6.1 Regional geology
6.1.1 Tectonic context
According to Turner (1972) and Isacks (1988), the main lithium-containing region of South America is in the Puna Plateau of the central Andes. The Puna Plateau is approximately 2,000 km long, 300 km wide and has an average elevation of 3,700 mal. The eastern volcanic arc and centers have been active from the Miocene to the present (Jordan & Gardeweg, 1989) and are the source of mineralized fluids throughout the plateau. The uplift of the Puna Plateau is the result of the crustal shortening that occurred in the Tertiary and magmatic accumulation (Isacks, 1988).
The section of the Puna which developed in Argentina shows distinct features of the Altiplano than those seen in Bolivia and Peru. Alonso et al. (1984) divided this zone into Southern Puna and Northern Puna according to their relative position with respect to the Olacapato lineament. This lineament corresponds to a regional megafracture on a WNW-ESE course that crosses other geological provinces of the Andean axis. The observed geological differentiation in the upper crust is a response to the deep segmentation of the subducted Nazca plate which, and according to Alonso et al. (1984), would condition a different metallogenic development. The southern Puna is considered the plateau region associated with the volcanic arc developed between 24" and 27" S and the Northern Puna to the region between 24" and 22" S.
The volcanic arc limits the Puna hydrological basin to the west while the Eastern Cordillera limits this basin to the east. Towards the Puna Austral (Southern Puna), a combination of east-west striking volcanic chains with uplifted blocks caused by north-south striking reverse faults limit numerous hydrological sub-basins (Alonso, 1986; Alonso et al., 1991; Vandervoort, 1995), with numerous and extensive salt flats covering their bases, frequently surrounded by important alluvial systems. Thick sections of Neogene strata (up to 5 km) are present within depositional basins (Jordan & Alonso, 1987; Alonso et al., 1991), which contain evaporites (mainly halite, gypsum, and borates) and alluvial clastic material with smaller tuff horizons (Alonso, 1986). Exposed Neogene strata is present along the margins of the salars due to reverse faulting or as intra-basin uplift within the salt flats (Vandevoort, 1995).
6.1.2 Stratigraphy
The stratigraphy of the Pastos Grandes area (Blasco et al. 1996) is summarized in Figure 6.1 and Figure 6.2 . The units that outcrop in the region correspond only to rocks of Ordovician and Cenozoic age.
The Ordovician outcrops are represented by leptometamorphic shales and greywackes, green to grey, strongly folded and fractured that make up the Cordón de Copalayo (Coquena Fm.), on the western flank of the depression, as well as its basement. Additionally, Ordovician plutonites and metamorphites assigned to the Oire Eruptive Complex are found in a conspicuous northern prolongation of the Oire ridge and on the eastern edge of the depression.
|
In strong angular unconformity and with an inclination towards the east, a thick sequence of tertiary continental sedimentary rocks developed which outcrop across the width of the basin (17 km), although in many cases without continuity. Turner (1960), based on chromatic and lithological differences, subdivided these tertiary sedimentary rocks into Fm Geste, Fm. Pozuelos and Fm. Sijes, components of what are called the Pastos Grandes Group. Alonso and Gutierrez (1986) identified the Fm. Singuel and separated it from the top originally assigned to the Fm. Sijes of this thick sequence of sparsely consolidated conglomerates with increasing gradation. Figure 6.3 shows a schematic cross-section of the outcrop units in Salar de Pastos Grandes, modified from Alonso (1992).
Figure 6.1 Stratigraphic chart (modified from Blasco et al., 1996)
|
Chart |
Geological Units in Pastos Grandes Basin |
|
|
65 - Alluvial and Coluvial Deposits: Boulders, sands and clays. 64 - Evaporitic Deposits: Halite, borates, carbonates, sulf. 61 - Terraced Deposits: Fanglomerates, tuff. 59 - Blanca Lila Formation: Clay, evaporites, ash. 55 - Abra del Gallo Formation: Ignimbrites and dacites. 54 - Bequeville Formation and Equivalents: Dacites. 53 - Rumibola Formation: Basalts, Andesites
52 - Singuel Formation: Conglomerates, sand and tuff. 50 - Tajamar Formation: Ignimbrite, tuff. 49 - Agua Caliente Formation: Dacites. 44 - Sijes Formation: Sand, pelites, borates, volcanics. 41 - Pozuelos Formation: Halite - Sandstone with gypsum. 40 - Geste Formation: Alluvial and Fluvial conglomerates. 26/27 - Oire Eruptive Complex: Granodiorite and Leucogranites 17 - Coquena Formation: Metasedimentites and Sedimentites. |
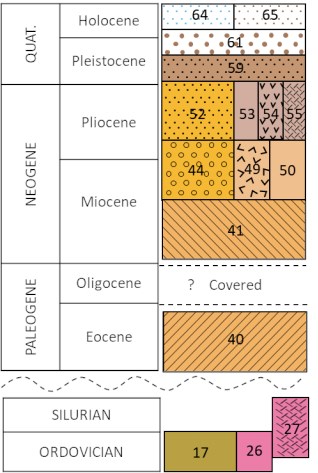
|
Figure 6.2 Regional geological Scheme (modified from Blasco et al., 1996)
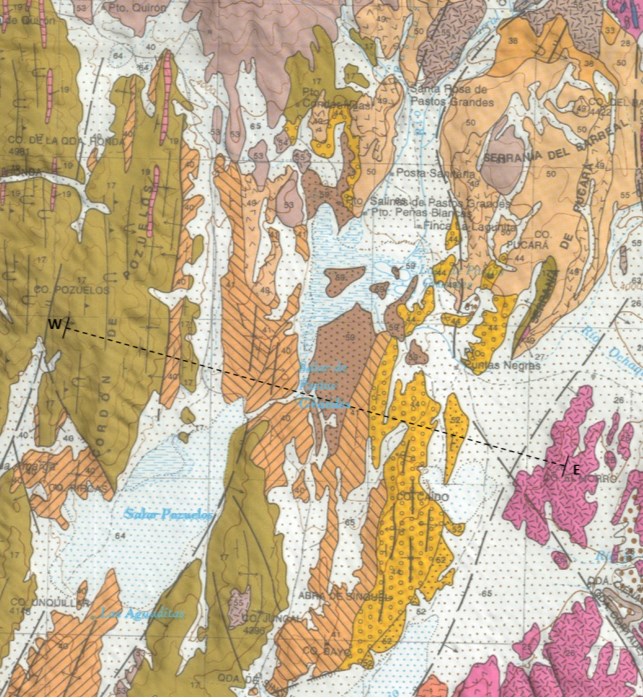
|
Figure 6.3 Geological cross section, Pastos Grandes Depression (modified from Alonso, 1992)
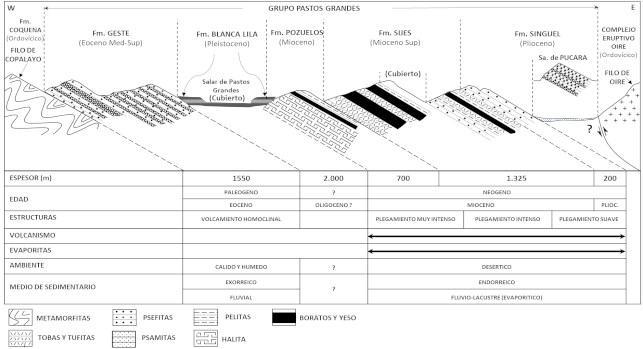
Lower paleozoic (Ordovician)
17 - Coquena Formation
Metasedimentites and Sedimentites
In the Salar de Pastos Grandes area, the Coquena Formation outcrops in the Sierra de Pozuelos constituting the ridge that divides the Centenario-Pastos Grandes basin to the east from the Pocitos or Quirón basin to the west. Outcrops are also mentioned in the Sierras del Pucara, on the northeastern limit of the basin, and in the vicinity of Santa Rosa de los Pastos Grandes (Cerro Condor Huasi). They belong to the oldest outcropping rocks in the sector whose age was estimated as Arenig-Llanvirn based on different associations of graptolite fauna. In general terms, the sequence is made up of yellow-green shales, siltstones and subordinate sandstones, with evidence of very low-grade regional metamorphism and intercalations of submarine vulcanite with an acid composition up to 1 m thick.
26/27 - Oire Eruptive Complex
26: Porphyric Granite - Granodiorite and 27: Leucogranites
It constitutes a north-south strip of granitic rocks that forms the western foothills of the Palermo snow-capped mountain with slopes towards the Salar de Pastos Grandes basin. There are discrepancies between absolute ages and stratigraphic relationships, assigning them to an extended period between the Llanvirnian and Lower Silurian ages.
|
The Oire eruptive complex is mainly constituted by fine-grained and porphyroid varieties of granodiorities which are followed chronologically by leucogranites and rhyodacitic porphyries that intrude into the granodioritic facies. A complex of aplitic and lamprophyric dykes complete the sequence.
Tertiary
Pastos Grandes Group
Turner (1964) defines this group as a set of continental clastic sediments with evaporite intercalations, which varies from coarse-grained at the base to fine-grained, advancing to claystones and limonites with pyroclastic intercalations in the upper third. Based on lithological differences this author recognizes three formations, Geste, Pozuelos and Sijes. The Sijes Fm was later subdivided by Alonso and Gutierrez (1986), separating the Singuel Formation (Figure 6.2 ).
40 - Geste Formation
This formation consists of fluvial deposits, alluvial fans and conglomerates. It crops out unconformably on Paleozoic units on the western edge of Salar de Pastos Grandes in which two sections are recognized. The lower section is characterized by tabular bodies of thick, poorly selected, light red polymictic conglomerates with clasts of quartz, quartzite, granite, phyllite vulcanite, schist, hornfels, and limestone. They were interpreted as proximal alluvial fans originated by mud flows. The upper section transitional over the previous one is characterized by fine polymictic conglomerates, light red in color, poorly selected with clasts of quartz, quartzites, granites, phyllite, vulcanite, and schists. It was interpreted as alluvial deposits of distal facies compared with the lower section with passage in the upper part to braided fluvial deposits of the basal part of the overlying Formation. Based on mammal ages, this Unit was assigned a Middle to Upper Eocene age.
41 - Pozuelos Formation
Halite - Sandstone with gypsum interbeds
It outcrops to the north of Salar de Pozuelos and to the east of Salar de Pastos Grandes and is characterized by thick sequences, up to 5 m, of halite (rock salt) dominance. It is composed of a succession of rock salt with intercalations of fine sandstone, siltstone, claystone, gypsum, and a small proportion of tuff and tuffite. The upper section, approximately 100 m thick, is dominated by silty claystones, sandstones, and tuffs. The top of the Pozuelos Fm passes transitionally to the Sijes Fm. There are no direct elements that allow dating the Pozuelos Fm; however, based on the 6.8 Ma Sijes Fm and the mammal ages of the upper part of the Geste Fm, it can be delimited between the Middle to Late Eocene and Lower Miocene.
44 - Sijes Formation
Sandstones and shales with borates and pyroclastics
This formation crops out to the east of Campo de la Paciencia in the Colorados range to the southeast of the Salar de Pocitos in the depression of the Salar de Pastos Grandes, and in the Salar de la Laguna up to the northwestern latitude of Salar Centenario.
Three members are recognized in the Pastos Grandes region for the Sijes Formation: Monte Amarillo, Monte Verde and Esperanza.
|
The Monte Amarillo member is constituted by yellowish-green flakes and has a guide bank of red claystones at the base that integrates the contact unit with the Pozuelos Fm. It has a section with intercalations of pelites with ulexite, gypsum and rhythmic intercalations of hydroboracite and gypsum with disseminated ulexite. It is thought that each sequence represents a lacustrine cycle.
The Monte Verde Member has a lower mudstone section with a gray tuff bank at the base. The upper section of light brown to greenish flakes has rhythmic intercalations of inyoite, colemanite, and gypsum. There is abundant disseminated ulexite and scattered levels of gray tuffs and tuffites. It has a tight folding style, but softer than the underlying member.
The Esperanza Member has the highest pyroclastic content and begins with a normally graded conglomerate that ends with interbedded sandstones and friable shales, as well as two levels of white tuffs. This member contains both diatom and gastropod levels.
Additionally, the upper section is predominantly pyroclastic and contains carbonate levels. Towards the top there are intercalations of coarse sandstone and fine friable conglomerates. The folding style consists mainly of broad folds with homocline deformations found only on the top. These facies were classified as continental endorheic with an arid climate and active explosive volcanism with salt flat beaches and brackish or saltwater lagoons, like the environment that currently prevails in the Puna salars, like Salar de Pastos Grandes nowadays.
Based on radiometric dating, carried out in tuffs located at its base (6.81 Ma) and top (4.0 Ma), it can be deduced that the depositional cycle of the Sijes Fm took place between the upper Miocene and the lower Pliocene.
49 - Agua Caliente Formation y Equivalents
Dacites
All lava spills and subvolcanic bodies of predominantly dacitic composition belonging to the volcanic cycle that began in the Late Miocene which have been eroded and are integrated under this name. The formation crops out in numerous points and proximities within the Salar de Pastos Grandes. Below the Queva lava flows and volcanic edifices and in the Antuco river creek, south and west of Santa Rosa de los Pastos Grandes. These rocks have grayish tones and a porphyritic structure of abundant phenocrysts of very close feldspars interposed by aphanitic paste. Under the microscope one can see biotitic quartz content, dacites, and andesites with a low proportion of quartz. An intense hydrothermal alteration is often associated with this Formation, particularly in the cases in which it is traversed by northwesterly trending fractures. Based on radiometric dating and stratigraphic relationships (it overlies the Pozuelos Formation), and it is estimated that the top of the Formation dates to the Upper Miocene.
50 - Tajamar Formation
Tuff and ignimbrites
The various outcrops of tuffs, ignimbrites and volcanic agglomerates in the area are closely related to each other, as they are associated with the same volcanic cycle and grouped under this name. Dacitic compositions are prevalent among these extrusive rocks. The Tajamar Fm crops out to the west of Salar de Pocitos. This region is characterized by alternating andesitic agglomerates with a tuff matrix, white dacitic tuffs, and gray and purple conglomeradic sandstones that overlie Tertiary sediments of the Pastos Grandes Group and the Batín Fm or on different Palaeozoic units. Based on radiometric dating and stratigraphic relationships the Upper Miocene to Pliocene age is inferred for this unit.
|
52 - Singuel Formation
Conglomerates and sandstones with tuffs and gypsum
It outcrops to the north of Salar Centenario and can be followed to the south of the Sijes river basin, in the Salar de Pastos Grandes depression. This Formation consists of sandy conglomerates and conglomeradic sandstones of reddish color, arranged in layers formed by Ordovician sedimentary rocks from the Oire Eruptive Complex and ignimbrites and tuffs. In the upper part there are frequent intercalations with tuffs and volcanic agglomerates. The authors who studied this Unit in detail suggest a typical fluvial environment, related to restricted lagoon environments evidenced by the presence of diatoms. Based on the stratigraphic relationships, as well as the dating of ignimbrites and tuffs, it is estimated that the sedimentation of the Singuel Fm and Equivalents could have occurred between the Upper Miocene and the Lower Pliocene.
53 - Rumibola Formation
Andesites and basalts
This Unit includes hypersthenic basalts, partly with olivine and hornblend andesites from the Tul Tul del Medio and Pocitos volcanoes, as well as Nevado Queva and the Pastos Grandes mountain range. The andesite lavas and subvolcanic bodies of the Rumibola Fm frequently have a characteristic reddish alteration color. The lower levels of the Chivinar and Guanaquero hills are made up of hypersthenic phenobasalts, which may present olivine. The Tul Tul y del Medio and Pocitos volcanoes have a main body formed by hornblendiferous or lamprobolite, hypersthenic andesites. In the Nevados de Queva area there are two main pulses of andesitic lavas. A Pliocene age is inferred for this unit extending its lower limit to the upper Miocene.
54 - Bequeville Formation and Equivalents
Dacites
It constitutes a succession of dacitic and andesitic outcrops to the west of Salar Centenario, originally assigned to the Miocene and later inferred to the Pliocene. The Formation corresponds to lavas and subvolcanic bodies, mainly dacitic in composition, with a reddish color in the surface and greenish-gray color in fresh fractures. The rock structure is porphyric with a microgranular holocrystalline paste with quartz, feldspar and mafic phenocrystals.
Based on its morphology, its unconformity stratigraphic relationships with respect to the previous volcanic cycle, its lithological similarities with the tuffs of the Abra del Gallo Fm, as well as alteration dating in volcanites with similar levels of erosion, this Formation is assigned to the Pliocene.
55 - Abra del Gallo Formation
Ignimbrites and dacites
Designated based on the outcropping Unit in the homonymous locality and designated Abra del Gallo Fm. Its deformation is less than the ignimbrites/tuffs of the previous cycle and regarding its morphological aspect can be distinguished by its relatively smooth surface extension, as well as being less dislocated than the ignimbrites of the Tajamar Fm and its equivalents. The Formation crops out in the spring of the Pastos Grandes River and can be seen to the north of the town of Santa Rosa de los Pastos Grandes. The outcrops are composed of hypersthenic biotite, phenodacitic tuffs and ignimbrites of yellowish white color. The age of the tuffs and ignimbrites found within this Formation can be assigned to the Upper Miocene to Pliocene.
|
Quaternary
59 - Blanca Lila Formation
Pelites, evaporites, travertine and borates
The outcrops of this Unit are distributed on the edges of Salar de Pastos Grandes reaching its greatest expression to the north and south, forming slabs towards the center of the Salar. The total outcrops cover 140 km2 with an approximate thickness of 30 m.
In unconformity above the Sijes Fm, light gray gravel, sand and tuffites were deposited in banks 20 to 50 cm thick. Occasionally, carbonate veins are present, and cross-bedding and convoluted lamination are observed. Sands and clays continue upward, sometimes with rhythmic stratification. Borate banks are also present, followed by silts and clays. Layers of caliche, which contain bird footprints and plant remains, are intercalated with calcium carbonate cemented levels. The entire unit is covered by a coherent sandy caliche layer that protects the relief from erosion. The depositional environment corresponds to a depression with centripetal drainage, muddy beaches and a predominantly seasonal evaporation body as indicated by the rhythmites. The footprints of birds and diatoms indicate a shallow lagoon environment. These conditions are the same that currently exist in Salar de Pastos Grandes and in some other salars in the region. Fission traces from gray tuff in the middle to upper part of the Blanca Lila Fm indicate a Lower Pleistocene age (1.6 Ma).
61 - Terrace Deposits
Fanglomerates with tuff layers
Under this name are the haulage deposits that constitute the highest terraces. They are described by different authors according to the area in which they are distributed.
They are essentially developed on tertiary deposits of the Pastos Grandes Group reaching Salar de Pocitos to the east. Other smaller deposits which could not be represented due to the scale of the map are found in the vicinity of Salar de Pastos Grandes. They consist of alluvial deposits that generally correspond to the outcrops from which they come. It is made up of medium to coarse fanglomerates, moderately selected with coarse stratification, and a yellowish color that is well differentiated from the reddish deposits of the Tertiary. Clasts of volcanites and metamorphites predominate over the older schists and sediments. In the Salar de Pastos Grandes the piedmont layers are shallow, up to 8 m, and formed by gypsiferous red argillaceous sandstones and light gray argillaceous sandstones, distinguishable from the Blanca Lila Fm. The deposits are sub horizontal and cover tertiary or older units. Considering that the last ignimbritic levels represented by the Abra del Gallo Fm and equivalents are interbedded in the terraced levels, these deposits are inferred to be from the Pleistocene to Early Holocene. The terraced deposits are covered by Holocene basalts.
64 - Evaporitic Deposits
Halite, borates, carbonates and sulfates
The presence of salars in the Puna area is one of its several relevant features, occupying tectonic-type depressions with a general north-south orientation. The basins are endorheic, and their water input has a seasonal distribution. Given the dry climate prevailing in the region, the main output of water occurs through evaporation, along with the consequent formation of salts. Generally, evaporite deposits are intercalated with clayey layers as well as borates and gypsum. The endorheic basins occupied by the salars were already formed during the Pliocene. Thus, volcanism divided primitive basins (as in the case of the Pocitos, Tul tul and Medio volcanoes). Therefore, although the process of formation of vents continues up to the present, it is not ruled out that its accumulation began in the Upper Tertiary.
|
65 - Alluvial and Coluvial Deposits
Boulders, sands and clays; mudflats
They constitute the modern detrital accumulations and comprise various origins and are widely distributed throughout the region. They present variable thicknesses and are unevenly distributed over all the underlying units. In general, they are unconsolidated deposits of highly variable granulometry which cover depressions forming alluvial fans or constitute fluvial deposits in various creeks. Locally there are accumulations of dune forming sands with eolic origin, such as at the southern end of the Salar de Pozuelos. The ejection cones that converge towards the great depressions are composed of clastic elements of variable granulometry, generally sandy silt or fine clastic material. Finally, vertical and horizontal granulometric selection can be observed while superficial and thin layers of angular fragments are common, settled on silt or sand, leaving thick clasts accumulated on the surface.
6.1.3 Structure
The Andean tectonic evolution in the region was conditioned by the Paleozoic structuring and, to a lesser extent, by the extensional regime present during the Upper Paleozoic. Three main compressional stages are recognized during the evolution of Andean tectonics in the region. The first being the pre-Oligocene stage, which folded the Neopaleozoic strata with crossed orientations respect to the orogenic front, due to the uplift and rotation of blocks controlled by ancient structures. The second stage consists of the foreland basin, which was already installed during the Oligocene, with its deposits slightly deformed into open folds. Finally, the third stage corresponds to the advance of the orogenic front and the recycling of the foreland basin. The elevation of basement blocks was accentuated from 6 Ma (Seggiaro et al., 2006) generating a folded belt of thick skin with double vergence. Towards the end of this stage, out-of-sequence structures developed between the main thrusts of ages less than 4 million years. Since the last 2 million years, an important extensional and transcurrent tectonic activity began in the Southern Puna, related to the recent volcanism. Finally, the modern sedimentary deposits were formed by alluvial fans, debris flows, ephemeral fluvial deposits, and mudflats that make up the filling of basins restricted to intermontane valleys.
The dominant structures in the Puna trending N-S to NNE-SSW are generally compressional or transgressive in nature formed mainly during the Neogene. Other structures are lineaments of regional magnitude, transversal to the Andean strike with a northeast and northwest direction along with displacements that occur in the strike direction and changes in the orientation of the Neogene folds and faults as well aligned volcanic flows of Cretaceous, Miocene-Pliocene and Quaternary ages. Some of the transversal lineaments have a well-documented pre-Cenozoic history, such as the Calama-El Toro-Olacapato lineament (Figure 6.4 ). South of this lineament, the deepest levels of the crust are exposed in both the Puna and Calchaquenia suggesting that the pre-Neogene deformation was dominated by vertical movements, descending towards the north. In addition, immediately north of the lineament, the western edge of the Cretaceous rift basin undergoes a marked westward displacement (Gorustovich et al, 2011). Figure 6.5 illustrates the regional structural evolution of the Altiplano-Puna Zone.
|
Figure 6.4 Structural setting of the Puna
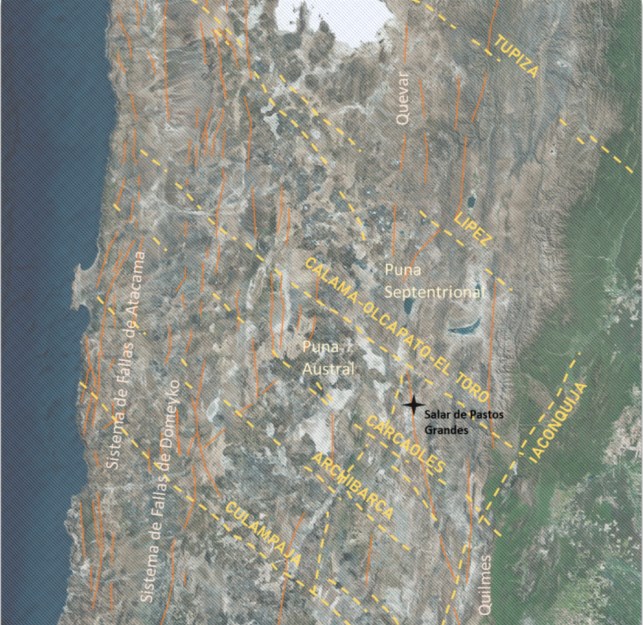
|
Figure 6.5 Generalized evolution of the structures of the Puna (Houston, 2010)
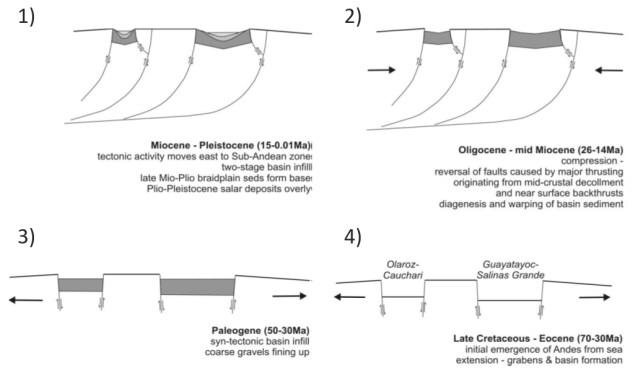
6.2 Local geology
After reviewing the available historical information associated with the Pastos Grandes Sub-basin, the following sources of information were mainly used for the interpretation and correlation of local geology:
• Drilling records available in the study area, integrating the drilling data from the Project with those reported by third parties in their respective feasibility reports (Millennial and LSC, respectively reported in Dworzanowski et al., 2019 and Hains et al., 2018).
• TEM and seismic sections developed for the Project.
• Shallow seismic refraction tomography survey carried out by Millennial (Dworzanowski et al., 2019).
• Geological sheet and stratigraphic map HG 2566-I San Antonio de los Cobres (Blasco et al., 1996).
6.2.1 Borehole information
As part of this resource update, geological descriptions were reinterpreted and the redundant information of each platform was consolidated in a single drilling record (for example, different boreholes within a few meters, of different depths and different drilling methodologies). The interpretations originally set forth in the core samples descriptions were reconciled with the observations made from field visits to adjust the lithological descriptions with the interpretation of the units.
|
Table 6.1 lists the detail of the boreholes considered in the reinterpretation while Figure 6.6 shows their spatial distribution.
Table 6.1 Boreholes incorporated in the geological model.
|
BHID |
East (m)7 |
North (m) |
Elevation8 (masl) |
Final depth (m) |
Drilling method |
Source |
|
PGMW16-01 |
3,429,218 |
7,283,662 |
3,775.6 |
190 |
DDH |
Millennial |
|
PGMW16-01b |
3,429,221 |
7,283,655 |
3,775.6 |
355 |
MR |
Millennial |
|
PGMW16-02 |
3,427,731 |
7,283,257 |
3,785 |
400 |
DDH-181-MR |
Millennial |
|
PGMW17-03 |
3,428367 |
7,283,805 |
3,773.6 |
154 |
DDH |
Millennial |
|
PGMW17-04 |
3,427,853 |
7,280,921 |
3,789.8 |
245.5 |
DDH |
Millennial |
|
PGMW17-04b |
3,427,849 |
7,280,949 |
3,786.9 |
564 |
MR-401-DDH |
Millennial |
|
PGMW17-05 |
3,428,922 |
7,281,677 |
3,773.9 |
121 |
DDH |
Millennial |
|
PGMW17-05b |
3,428,927 |
7,281,683 |
3,773.9 |
387 |
DDH |
Millennial |
|
PGMW17-05c |
3,428,918 |
7,281,672 |
3,773.9 |
601 |
MR |
Millennial |
|
PGMW17-06 |
3,429,497 |
7,281,016 |
3,785 |
455 |
DDH-387.5-MR |
Millennial |
|
PGMW17-06b |
3,429,497 |
7,281,016 |
3,785 |
424 |
MR |
Millennial |
|
PGMW17-06c |
3,429,497 |
7,281,016 |
3,785 |
571 |
MR |
Millennial |
|
PGMW17-07 |
3,426,888 |
7,282,228 |
3,763.1 |
203.3 |
DDH |
Millennial |
|
PGMW17-07b |
3,426,888 |
7,282,228 |
3,763.1 |
203.3 |
MR |
Millennial |
|
PGMW17-07c |
3,426,888 |
7,282,228 |
3,763.1 |
412 |
DDH-283-MR |
Millennial |
|
PGMW17-07d |
3,426,901 |
7,282,217 |
3,763.1 |
510 |
MR |
Millennial |
|
PGMW17-08 |
3,429,941 |
7,281,596 |
3,785 |
425.5 |
DDH |
Millennial |
|
PGMW17-08b |
3,429,941 |
7,281,596 |
3,785 |
446 |
MR |
Millennial |
|
PGMW17-09 |
3,428,156 |
7,283,107 |
3,785 |
595 |
DDH-268-MR-475-DDH-548.5-MR |
Millennial |
|
PGMW17-10 |
3,429,822 |
7,283,569 |
3,773.7 |
601 |
DDH-178-MR |
Millennial |
|
PGMW17-11 |
3,429,826 |
7,285,591 |
3,817.6 |
568 |
MR |
Millennial |
|
PGMW18-12 |
3,428,224 |
7,280,087 |
3,787.7 |
554 |
MR |
Millennial |
|
PGMW18-13 |
3,428,223 |
7,278,696 |
3,795.3 |
559 |
MR-524-DDH |
Millennial |
|
PGMW18-14 |
3,428,234 |
7,277,357 |
3,797.1 |
635 |
MR |
Millennial |
|
PGMW18-15 |
3,426,687 |
7,278,678 |
3,792.7 |
594 |
MR |
Millennial |
|
PGMW18-16 |
3,429,618 |
7,279,568 |
3,790.4 |
641 |
MR |
Millennial |
|
PGMW18-17 |
3,426,685 |
7,280,094 |
3,767.5 |
605 |
MR |
Millennial |
|
PGMW18-18 |
3,426,656 |
7,277,421 |
3,798.7 |
605 |
MR |
Millennial |
|
PGMW18-19 |
3429,083 |
7,280,529 |
3,787.7 |
602 |
MR |
Millennial |
|
PGMW18-20b |
3,430,661 |
7,279,511 |
3,777.3 |
575 |
MR |
Millennial |
|
|
BHID |
East (m)7 |
North (m) |
Elevation8 (masl) |
Final depth (m) |
Drilling method |
Source |
|
PGMW19-21 |
3,426,079 |
7,279,867 |
3,784.5 |
574.3 |
MR-180-DDH |
Millennial |
|
PGMW19-22 |
3,431,009 |
7,288,304 |
3,832.5 |
464.5 |
MR-102-DDH- 347.5-MR |
Millennial |
|
PGPW16-01 |
3,429,204 |
7,283,655 |
3,775.6 |
351 |
MR |
Millennial |
|
PGPW17-04 |
3,427,842 |
7,280,941 |
3,788.5 |
475 |
MR |
Millennial |
|
PGPW18-15 |
3,426,687 |
7,278,707 |
3,792.7 |
610 |
MR |
Millennial |
|
PGPW18-17 |
3,426,666 |
7,280,153 |
3,767.5 |
606 |
MR |
Millennial |
|
PGWW18-01 |
3,428,857 |
7,286,244 |
3,781.2 |
42 |
MR |
Millennial |
|
PGWW19-02 |
3,431,200 |
7,288,950 |
3,874.7 |
62 |
MR |
Millennial |
|
PGWW19-03 |
3,431,279 |
7,287,953 |
3,821.7 |
62 |
MR |
Millennial |
|
PGWW19-04 |
3,431,032 |
7,288,305 |
3,831.5 |
62 |
MR |
Millennial |
|
PGWW19-05 |
3,430,916 |
7,287,889 |
3,844 |
62 |
MR |
Millennial |
|
PGWW19-06 |
3,430,545 |
7,288,054 |
3,842.5 |
62 |
MR |
Millennial |
|
SPG-2018-01 |
3,431,609 |
7,283,171 |
3,776.9 |
601 |
DDH-50?-MR |
LSC |
|
SPG-2017-02 |
3,426,955 |
7,285,189 |
3,775.5 |
121 |
DDH |
LSC |
|
SPG-2017-02B |
3,427,203 |
7,284,055 |
3,769.4 |
572.5 |
DDH-50?-MR |
LSC |
|
SPG-2017-04ª |
3,243,076 |
7,282,489 |
3,774.2 |
553 |
MR |
LSC |
|
SPG-2017-05 |
3,429,294 |
7,282,107 |
3,780.8 |
279.5 |
DDH |
LSC |
|
SPG-2017-05B |
3,429,344 |
7,282,088 |
3,778.7 |
500.5 |
DDH |
LSC |
|
PP-01-2018 |
3,427,028 |
7,275,405 |
3,805.7 |
611 |
MR |
Centaur |
|
PP-02-2019 |
3,427,171 |
7,273,819 |
3,772.5 |
650 |
MR |
Centaur |
|
PP-03-2019 |
3,428,251 |
7,276,673 |
3,803.2 |
542 |
MR |
Centaur |
|
DD-01 |
3,429,329 |
7,278,639 |
3,793.5 |
700 |
DDH |
Arena Minerals |
|
DD-02 |
3,427,651 |
7,275,815 |
3,802.5 |
646 |
DDH |
Arena Minerals |
|
R-01 |
3,434,507 |
7,279,732 |
3,794.7 |
601 |
MR |
Arena Minerals |
|
R-02 |
3,435,359 |
7,283,016 |
3,813 |
411 |
MR/DDH |
Arena Minerals |
|
R-03 |
3,435,050 |
7,288,856 |
3,836 |
617 |
MR |
Arena Minerals |
Table 6.1 (Continuation)
6.2.2 Geophysical surveys
The results of a seismic refraction survey helped improve the understanding of the local geology and the development of the 3-D geological model by allowing to define the limits between some subsurface units. The interface between the fine sediments that underlie the halite crust within the Salar is represented within sections and is clearly correlated with the descriptions of the Project's boreholes. On the other hand, due to the resolution of the study, the deeper units in the basin under the halite crust show some noise and the correlation with borehole information is not direct.
|
6.3 Local geology description
Based on the lithological descriptions of the drill core and cuttings together with the interpretation of the available geophysical information and field observations five major geological units were defined and correlated, these units were incorporated into a 3-D geological model of the Pastos Grandes sub-basin. Figure 6.6 shows the geological units at surface and Figure 6.7 shows a view of the geologic model from the southwest. The geological units are described hereafter:
6.3.1 Fluvial/Alluvial Unit
The Fluvial/Alluvial Unit is characterized by a heterogeneous sequence of alluvial and fluvial sediments of variable texture, dominated by clastic sediments formed by gravel and sand that surround the Salar. These fractions may present low proportions of fine sediments (sands or clays) which develop mainly along the northern and southern edges of the Salar de Pastos Grandes, prograding in depth towards the center, to interdigitate with finer silt sediments formed by clay and sandy clays from the Central Clastics Unit. Figure 6.8 shows the spatial distribution of this unit.
6.3.2 Upper clay unit (Blanca Lila Formation)
Formed by a superficial sequence of clays with a wide distribution in the center-south of the basin, as well as in the western margins where, according to field observations, it occurs in outcrop. This clay dominated unit intercalates with layers of evaporites, halites and borates, while in the bibliography travertine and tuff horizons were also described. Figure 6.9 shows the spatial distribution of this unit.
6.3.3 Saline/Lacustrine unit
Immediately below the Blanca Lila Fm and in the north-central sector from the surface, a thick halite sequence is recognized. This Unit is characterized by a massive and compact halite body with the presence of interstitial clastic material and occasional intercalations of finer levels of clay. The average thickness of this Unit ranges between 200 m and 300 m, reaching maximum thicknesses of 700 m in the central-eastern sector of the basin, which is interpreted as an ancient depocenter. Figure 6.10 shows the spatial distribution of this unit.
6.3.4 Central clastic unit
This Unit consists of clay and clayey sands and occurs within the central sector of the basin underneath the halite deposits, as shown in Figure 6.11. This Unit is poorly characterized due to limited and low-quality borehole information but seems to represent a distal sector of an alluvial fan and its interaction with marginal lacustrine deposits of the Salar. Additional core drilling is planned during 2023 to improve the hydrogeological characterization of this Unit.
|
6.3.5 Base Breccia/Gravels unit
Based on Millennial's lithological description, a sedimentary breccia unit of coarse fragments of silicified conglomerate and ignimbrites was recognized in borehole PGMW19-21. This Unit corresponds to intermixed levels of sand and gravel with a thickness of 200 m on the western edge of the basin and deepening towards the north-central limit of the model where due to limited information its thickness becomes uncertain. Figure 6.12 shows the spatial distribution of this unit.
Three cross sections through the geological model are shown in Figure 6.13 and Figure 6.14. to demonstrate the lateral relation between the geological units across the basin Figure 6.7 shows the location of the sections.
|
Figure 6.6 Plan view of the interpreted geological units
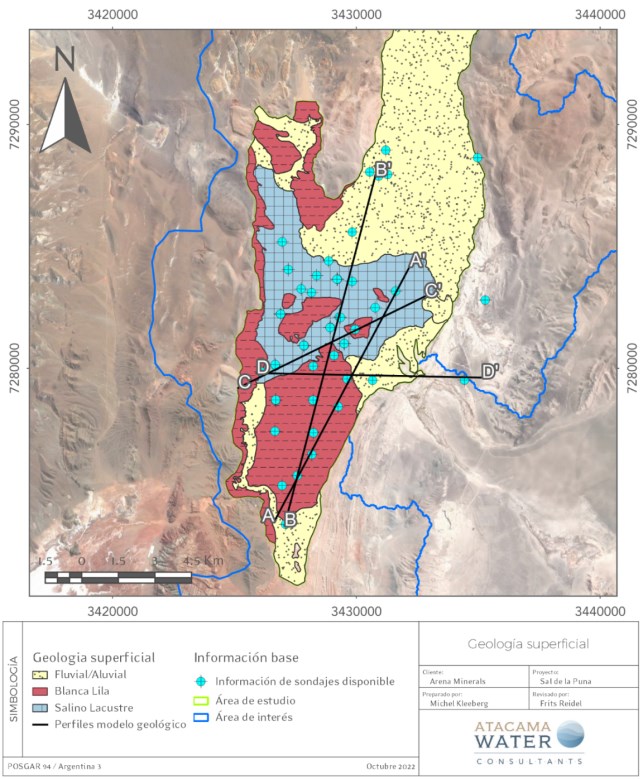
|
Figure 6.7 N-S section, through the geological model looking from the NW)
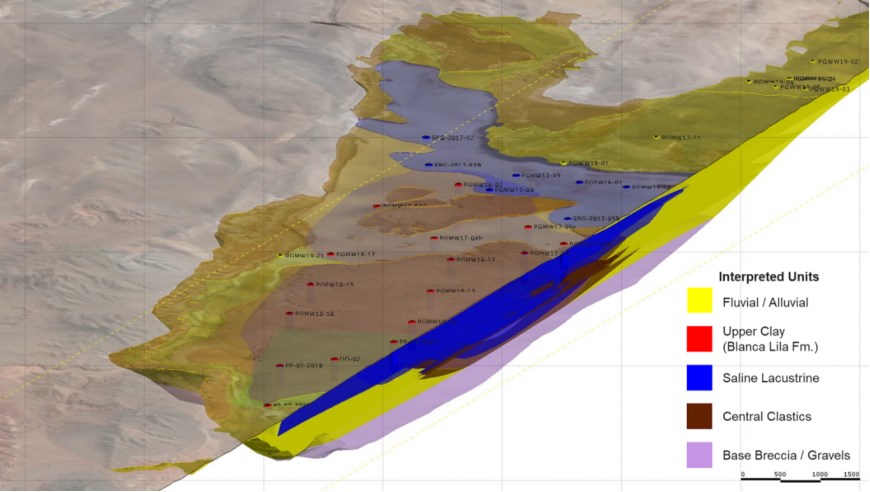
|
Figure 6.8 Spatial distribution Fluvial/Alluvial Unit
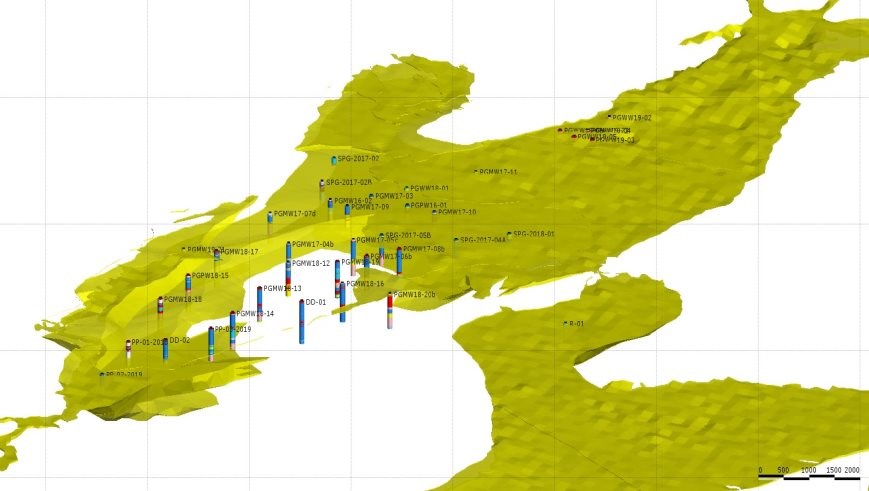
|
Figure 6.9 Spatial distribution Upper Clay Unit (Blanca Lila Formation)
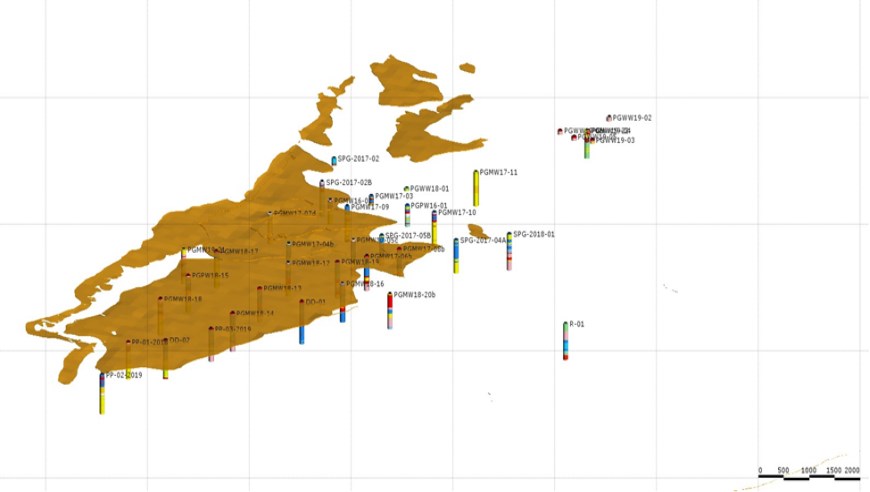
|
Figure 6.10 Spatial distribution Saline-Lacustrine Unit
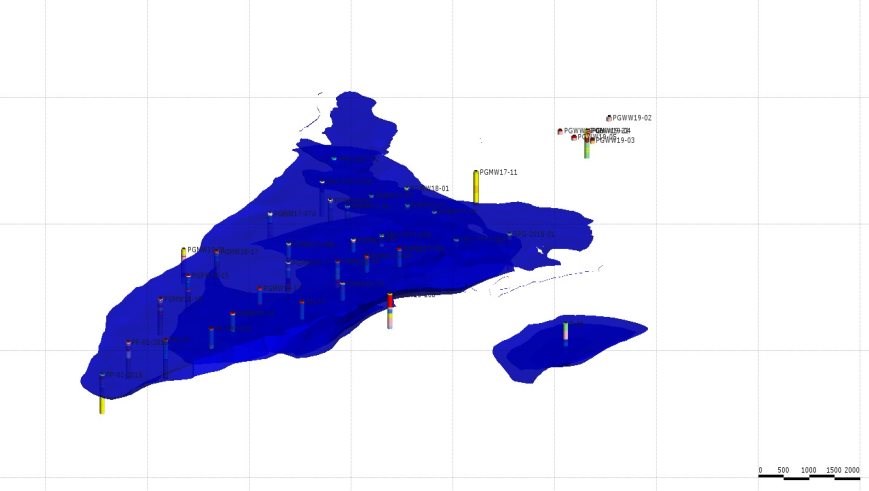
|
Figure 6.11 Spatial distribution Central Clastic Unit
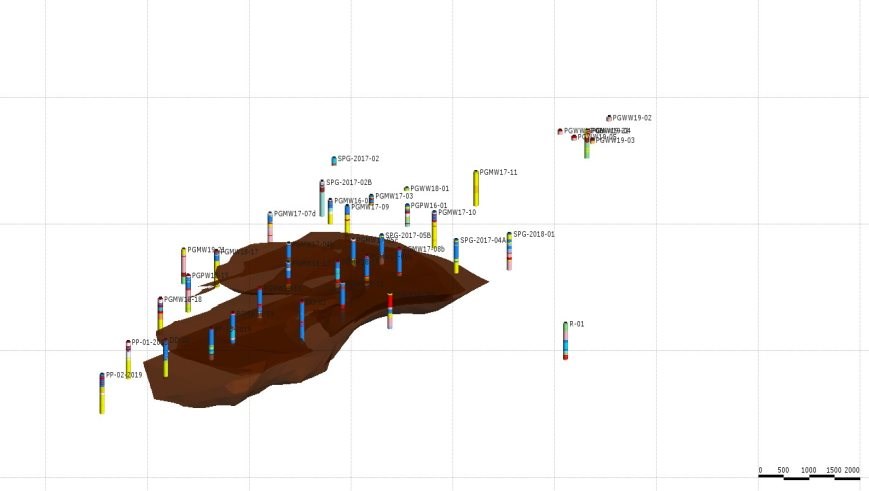
|
Figure 6.12 Spatial distribution Base Breccia/Gravel Unit
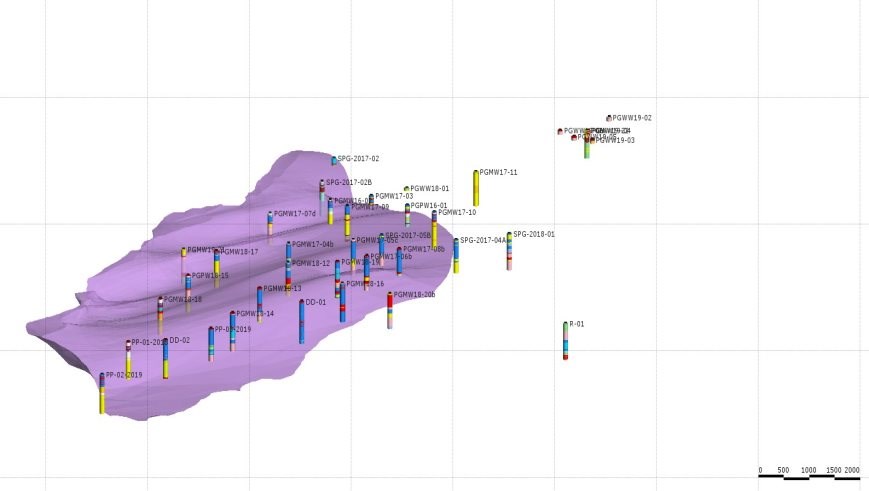
|
Figure 6.13 Cross sections AA' and BB' through the of the Pastos Grandes basin
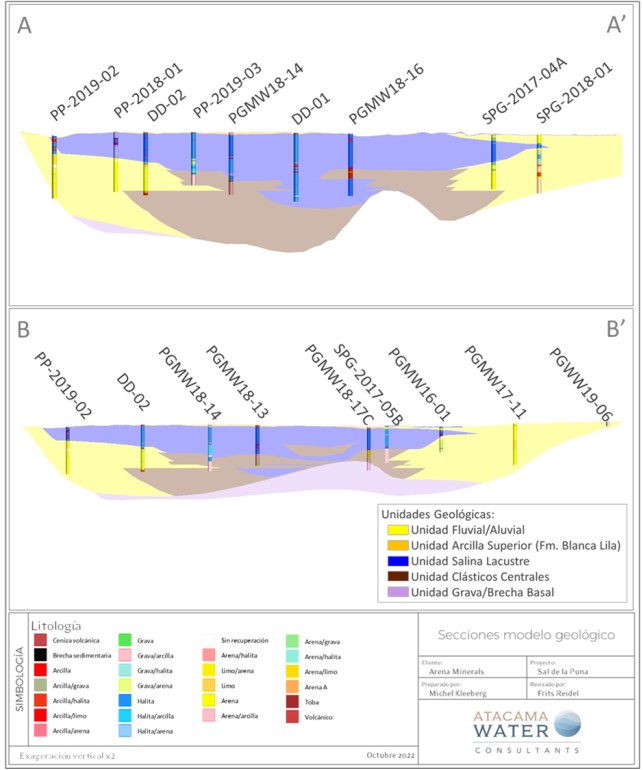
|
Figure 6.14 Cross section CC' and DD' through the Pastos Grandes basin
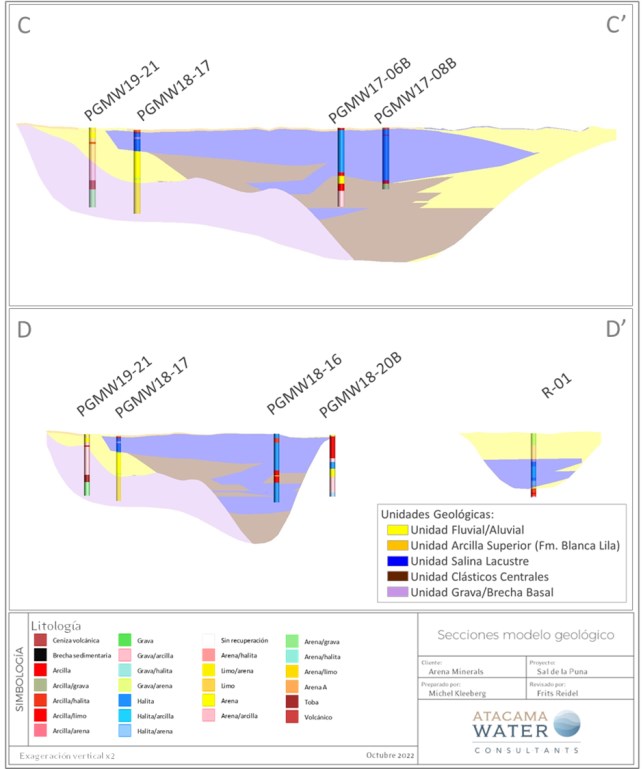
|
6.4 Mineralization
The brines from Pastos Grandes are solutions saturated in sodium chloride with an average concentration of total dissolved solids ("TDS") of 302 g/L and an average density of 1.19 g/cm3. The other components present in the Pastos Grandes brine are K, Li, Mg, SO4, Cl and B with relatively low Ca. The brine can be classified as a sulphate-chloride type with anomalous lithium. Lithium concentrations in Salar de Pastos Grandes have an average value of 392 mg/L, with some samples reaching up to 700 mg/L.
Table 6.2 shows a breakdown of the principal chemical constituents in the Pastos Grandes brine including maximum, average, and minimum values, based on 501 primary brine samples collected between 2017 and 2022.
Table 6.2 Maximum, average and minimum elemental concentrations of the Pastos Grandes brine
|
|
B |
Ca |
Cl |
Li |
Mg |
K |
Na |
SO4 |
Density |
|
Units |
mg/L |
mg/L |
mg/L |
mg/L |
mg/L |
mg/L |
mg/L |
mg/L |
g/cm3 |
|
Maximum |
938.00 |
1,707 |
196,869 |
701.00 |
5,130 |
6,660 |
130,032 |
13,998 |
1.22 |
|
Average |
557.62 |
821 |
169,838 |
391.76 |
2,257 |
3,733 |
102,381 |
7,547 |
1.19 |
|
Minimum |
20.20 |
11.00 |
116.00 |
8.75 |
23.20 |
18.00 |
196.00 |
12.00 |
1.00 |
Brine quality is evaluated through the relationship of the elements of commercial interest, such as lithium and potassium, with those components that constitute impurities, such as Mg, Ca and SO4. The calculated ratios for the averaged chemical composition are presented in Table 6.3.
Table 6.3 Average values (mg/L) of key components and ratios for the Pastos Grandes brine
|
K |
Li |
Mg |
Ca |
SO4 |
B |
Mg/Li |
K/Li |
|
3,733 |
392 |
2,257 |
821 |
7,547 |
558 |
5.76 |
9.53 |
6.5 Deposit type
Salars occur in closed (endorheic) basins without external drainage in dry desert regions where evaporation rates exceed stream and groundwater recharge rates, preventing lakes from reaching the size necessary to form outlet streams or rivers. Evaporative concentration of surface water over time in these basins leads to residual concentration of dissolved salts (Bradley et al., 2013) to develop saline brines enriched in one or more of the following constituents: sodium, potassium, chloride, sulphate, carbonate species, and, in some basins, metals such as boron and lithium. Houston et al. (2011) identified two categories of salars: 1) mature, halite dominant; and 2) immature, clastic dominant. Figure 6.15 shows the conceptual model for each salar type.
|
Figure 6.15 Conceptual model for mature and immature (Houston et al., 2011)
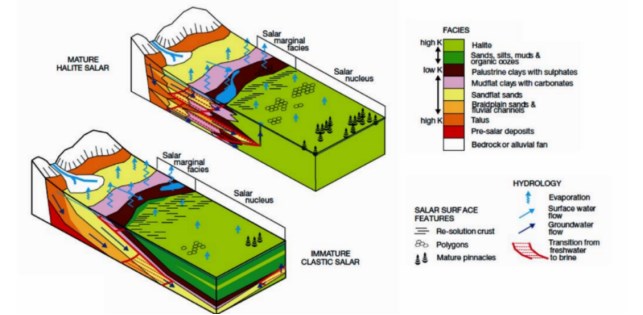
Immature salars are characterized by increased humidity (increased precipitation, less evaporation) and are more frequent at higher elevations and in the wetter northern and eastern parts of the region. They are characterized by alternate sequences of fine-grained sediments and evaporitic beds of halite and/or ulexite, indicating the changes in sediment supply due to variable tectonic and climate history (Houston, et al., 2011). Immature salars include Olaroz, Cauchari, Diablillos and Centenario.
Mature salars are less humid and tend to be more common in lower and drier areas of the region. They are characterized by a relatively thick and uniform sequence of halite deposits in variable sub-aquatic and sub-aerial conditions. Nevertheless, ancient floods leading to widespread silty clay deposits and volcanic fallout have led to thin intercalated beds that can be recognized in drill core and geophysical surveys. The central portion of Salar de Atacama is a typical mature setting.
Salar de Pastos Grandes is a mature salt flat, with a well-developed halite crust. In the central portion of the salar, the crust can reach a thickness of several hundred meters, with a thin clay layer that is constantly being generated through evaporation in the shallower beds.
6.6 Hydrogeology
The Salar is the lowest topographic point in the Pastos Grandes Basin. The salt flat itself is surrounded by alluvial fans which drain into the Salar and tertiary rocks that may act as impermeable boundaries, although further hydrogeological characterization work of the Tertiary is recommended. The surface of the Salar in the north is composed of mainly chloride facies (halite crust) with active evaporation occurring since the brine level occurs within 5 cm from the surface. The Salar surface in the south is covered by the Blanca Lila Fm with an average thickness of 3 m. Depth to brine in the southern part of the Salar is between 3 m and to 4 m, below the evaporation extinction depth that is estimated around 2.5m.
|
Based on the interpretation of drilling and testing work in the basin, four hydrogeological units have been identified as shown in Figure 6.16 and are described below:
● UH-1 Fine Grained Shallow Deposits: These sediments belong to the Blanca Lila formation and are in conformity with the underlying Saline Lacustrine Unit, reaching a maximum thickness of 30 m at the northeast of the Salar. Because of the fine texture, permeability and storage properties for this Unit are estimated to be low with a hydraulic conductivity (K) ranging between 0.1 - 0.01 m/d, a specific storage (Ss) of 1x10⁻⁶ 1/m and drainable porosity below 2%. Geophysics and field sampling suggests that this Unit is saturated with brine inside the Salar and with brackish water around the margins.
● UH-2 Evaporitic Deposits: Massive evaporitic unit, intercalated with lenses of fine-grained sediments that can have a thickness up to 700 m. This relatively homogeneous Unit includes the saline lacustrine material that forms the surface of the salar nucleus and is overlain by the Blanca Lila Fm (UH-1) in the south. Based on drilling and testing results this Unit has a relatively low permeability and could limit hydraulic connectivity between the upper and deeper hydrogeological units in the basin. The hydraulic conductivity of this Unit is estimated to be lower than 0.01 m/d, the specific storage is estimated to be near 10-6 1/m and the specific yield could reach 4%. Geophysics and field sampling suggests that this Unit is saturated with brine.
● UH-3 Alluvial and Colluvial Deposits: This hydrogeological unit includes the alluvial fans identified at the margins of the Salar which are composed of unconsolidated gravels and sand. This Unit overlies and is in lateral contact with UH-2 and locally appears interfingered with UH-4. The hydraulic conductivity ranges between 30 m/d and 50 m/d. The average drainable porosity is 14%. Groundwater flow in the Alluvial and Colluvial Deposits is generally unconfined; however, locally semi- confined to confined flow conditions occur where this unit is overlain by UH-1 and UH-2. The unit hosts freshwater resources in the alluvial fans on higher ground above the margin of the Salar and significant brine resources in the southern portion of the Salar where it is partially overlain by UH-1
● UH-4 Lower Deposits: Overlaying basement rock, this hydrogeological unit includes the Central Clastics and Base Gravels. It is composed of sandy gravels with a high fraction of fine material in a sedimentary matrix and some clayey to silty lenses that decrease the bulk vertical hydraulic conductivity. This unit is constrained to the central portion of the basin, underlies UH-2, and is in lateral contact with the unconsolidated deposits of UH-3. The hydraulic conductivity of this unit is estimated to range between 0.1 - 1 m/d, the specific storage at 10-6 1/m, and the drainable porosity near 8%. This unit forms part of the confined lower brine aquifer from which future brine production will likely not affect the freshwater resources hosted in the alluvial system due to the overlying low-permeability halite unit.
|
6.7 Water balance
A water balance for the Pastos Grandes Basin was prepared as part of the conceptual hydrogeological model and is summarized in Table 6.4. In closed endorheic basins such as Salar de Pastos Grandes recharge is in long-term equilibrium with evaporation in the absence of any brine production. Recharge is composed of direct recharge from precipitation and lateral groundwater in lows from adjacent subbasins (Sijes subbasin) and was estimated within a range of 300 - 1,000 L/s. Discharge occurs mainly through evaporation in the form of 1) soil evaporation where the water table is above the extinction depth; 2) evapotranspiration from wetlands at the margins of the Salar; and 3) free water (or brine) evaporation from perennial or ephemeral lagoons over the surface of the Salar. Table 6.4 provides a detail of the water balance estimate for the Salar de Pastos Grandes Basin.
Table 6.4 Water balance for Salar de Pastos Grandes
| Inflows (L/s) | ||
| Direct recharge from precipitation | 150 - 600 | |
| Lateral recharge from Sijes Subbasin | 150 - 400 | |
| Total inflows | 300 - 1,000 | |
| Outflows (L/s) | ||
| Evaporation | Lagoon evaporation | 100 - 300 |
| Evapotranspiration | 100 - 300 | |
| Soil evaporation | 100 - 300 | |
| Total outflows | 300 - 900 | |
6.8 Drainable porosity
Porosity is highly dependent on lithology. Total porosity is generally higher in finer grained sediments than coarser grained sediments, whereas the reverse is true for drainable porosity or specific yield, since finer grained sediments have a high specific retention. The lithology within the Salar is variable with halite and halite mixed units, clay and gravel-sand-silt-clay sized mixes spanning the full range of sediment types.
|
Figure 6.16 Hydrogeological cross section
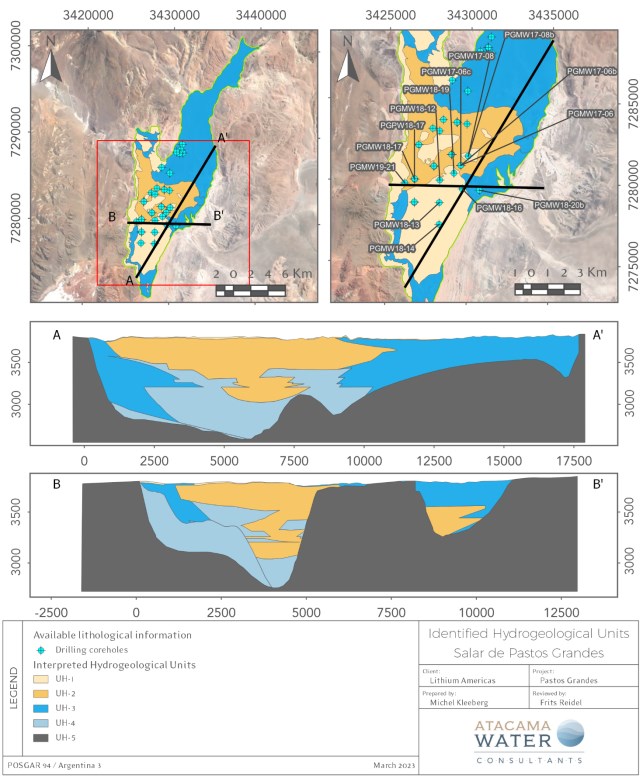
|
Based on the results of drainable porosity analyses carried out on 76 undisturbed samples from HQ core by GeoSystems Analysis it was possible to assign drainable porosity values to the specific lithological units encountered during the various drilling programs between 2016 and 2023. Table 6.5 summarizes the results of the porosity analysis. The analysis of drainable porosity is further discussed in Section 8.
Table 6.5 Results of drainable porosity analyses
|
Lithology |
Sy Average |
|
Blanca Lila |
0.5% |
|
Alluvium |
13.9% |
|
Saline Lacustrine |
4.1% |
|
Clastic Central |
5.4% |
|
Base Gravels |
12.5% |
6.9 Permeability
Permeability (or hydraulic conductivity) is also a parameter that is dependent of lithology. Generally finer grained and well-graded sediments have a lower permeability than coarser grained poorly graded sediments. Eight pumping tests have been carried out within the Salar and the surrounding alluvial sediments. The results of the interpretation of these pumping tests, integrated with literature information on similar lithologies are summarized in Table 6.6. Vertical anisotropy of 10% is proposed for these units according to different references of classical hydrogeology (Freeze & Cherry, 1979; Domenico and Schwartz, 1990; Custodio y Llamas. 1993). Further test work is recommended to improve the characterization of the hydrogeological units. The analysis of the pumping tests is further discussed in Section 7 below.
Table 6.6 Summary of permeability values
|
Unit |
Kx (m/d) |
Ky (m/d) |
Kz (m/d) |
|
Blanca Lila |
0,01 |
0,01 |
0,001 |
|
Alluvium |
10 |
10 |
1 |
|
Saline Lacustrine |
0,01 |
0,01 |
0,001 |
|
Clastic Central |
0,1 |
0,1 |
0,01 |
|
Base Gravels |
0,1 |
0,1 |
0,01 |
|
7 EXPLORATION
This section provides a description of the exploration work that has been carried out in the Salar between 2011 and 2022 by the various owners of the Project.
7.1 Surface brine sampling
In 2011, Eramet took a total of nine samples from shallow hand-dug auger holes within the eastern section of the Salar and the wetlands as shown in Figure 7.1. Three brine samples toward the west of the Salar had lithium concentrations near 600 mg/L and potassium concentrations near 7,000 mg/L while samples at the center of the Salar had lithium and potassium concentrations near 200 and 2,000 mg/L, respectively. LSC completed a second surface sampling program in 2016 which included 11 sampling sites (shallow brine bodies and hand dug pits) with similar results as Eramet in 2011. The results of the brine chemistry analysis of these samples were not used in this current resource estimate due to the uncertainty related with the quality of the sampling protocols.
|
Figure 7.1 Historical surface brine samples in Salar de Pastos Grandes
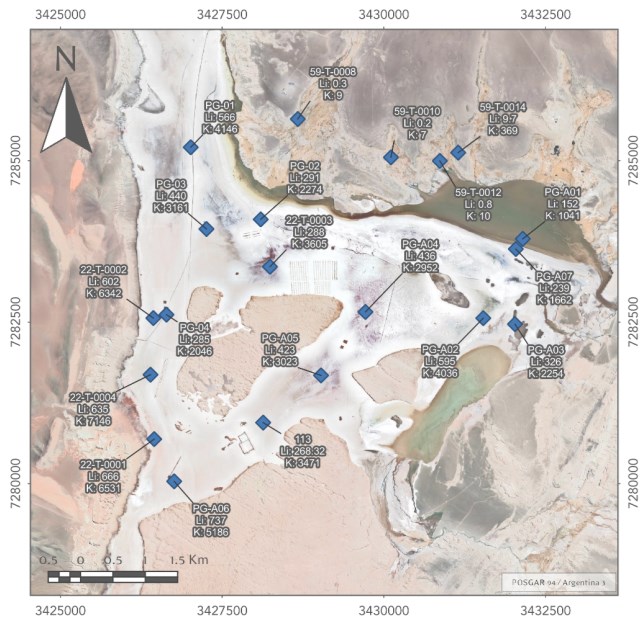
|
7.2 Geophysical studies
7.2.1 Eramet (2011-2013)
Eramine carried out a Transient Electromagnetic ("TEM"), Vertical Electrical Soundings ("VES"), and Controlled Source Audio Magnetotellurics ("CSAMT") surveys in Salar de Pastos Grandes between 2011 and 2013. The locations of the VES and CSAMT surveys are shown in Figure 7.2; no information is available for the TEM survey. The objectives of these surveys were to map the occurrence of brine versus freshwater, and the distribution and relative continuity of lithological units.
7.2.2 Millennial exploration (2017 - 2019)
7.2.2.1 VES survey (2017)
Millennial conducted a VES survey in 2017, focused on the alluvial deposits in the northern portions of the Salar. This study included 10 VES stations which were interpreted into three vertical sections whose locations are shown in Figure 7.2. The objective of this survey was to map the saline interphase, identify potential brine resources in the north, and help define new exploration drilling sites.
7.2.2.2 Seismic survey (2018-2019)
Millennial carried out a two-phase seismic investigation program during 2018-2019 to help refine the understanding of the lithology in the Salar and help define new exploration targets. The locations of the seismic lines are shown in Figure 7.2.
The seismic tomography survey provided valuable information on the vertical distinction and lateral continuity of lithological layers. Additionally, several structures were interpreted, especially in the north to south profile, suggesting north to northwest dipping beds.
7.2.2.3 Downhole temperature and electrical conductivity surveys
Down-hole electrical conductivity profiling was conducted in boreholes PGMW16-02, PGMW17-04b, PGMW17-05c, PGMW17-07d, and PGMW17-11 which were completed with 2-inch diameter PVC casing on completion of drilling. Figure 7.2 shows the location of these boreholes. Temperature and electrical conductivity were recorded at 3-m intervals using an In-Situ brand Aquatroll 100 downhole probe and brine samples were taken to measure laboratory density. The results showed a reasonably good correlation between the Aquatroll specific conductivity and the laboratory density measurements on the depth-specific samples.
|
Figure 7.2 Geophysical surveys conducted in Salar de Pastos Grandes
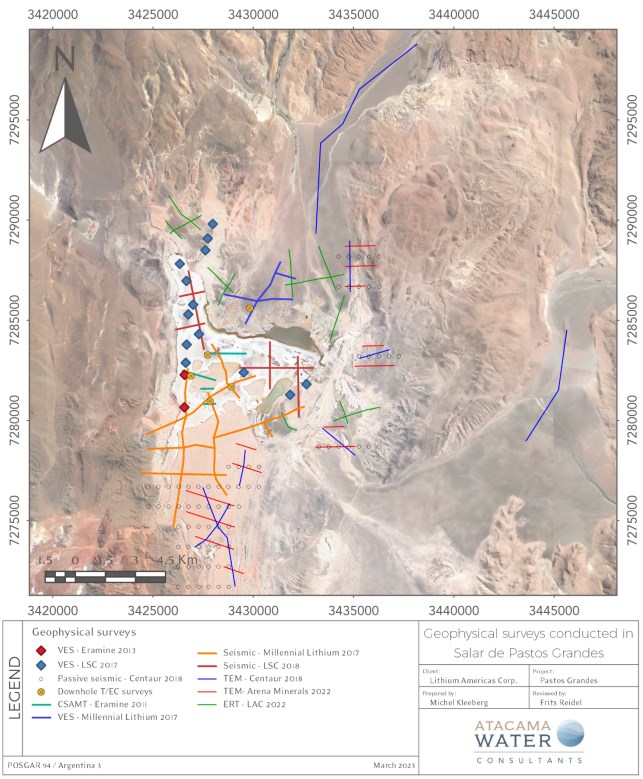
|
7.2.3 LSC exploration (2017 - 2018)
7.2.3.1 VES survey (2017b)
LSC Lithium carried out a VES study in 2017 to map lithology and the freshwater/ brine interface. The survey consisted of 13 soundings as shown in Figure 7.2. The results of this survey identified five geoelectrical units: 1) conductive gravels and sands; 2) a semi-conductive fine grained unit (silt and clays and/or halite gypsum and borates), probably related to the Blanca Lila Formation; 3) a highly conductive zone of evaporates and mixed halite/clastics saturated with brine; 4) a more resistive layer representing again the Blanca Lila Fm or other Tertiary sequences and; 5) a resistive zone interpreted as the hydrogeological basement composed of thick clastic facies (conglomerates) and/or facies of volcanic rocks (andesites).
7.2.3.2 Seismic survey (2018)
LSC undertook a seismic tomography survey consisting of six lines for a total of 15 km as shown in Figure 7.2. The interpretation of the results of this survey was based on a combination of literature values, regional geological information, and specific correlation to boreholes SPG-2017-02B and SPG-2017-04A and is summarized below.
To the west of the Salar seven seismic units were identified without structure to a depth of 600 m: 1) dry alluvial deposits; 2) halite crust; 3) saturated sand, clay and/or organic material; 4) crystalline halite; 5) saturated sand, clay and/or organic material; 6) gravels and 7) breccia.
To the center and east of the Salar 11 seismic units were identified without structure to a depth of 600 m, from top to bottom: 1) dry to partially saturated sediments and alluvial material (saturated sand, clay and/or organic material); 2) halite crust; 3) saturated sand, clay and/or organic material; 4) halite with scarce matrix; 5) halite with abundant matrix; 6) halite with scarce matrix; 7) sand; 8) alternation of halite and sand bands; 9) gravel, sand and/or clay; 10) halite with interbedded sand; 11) gravel and/or sand.
7.2.4 Centaur/AMSA exploration (2018 - 2022)
7.2.4.1 TEM survey (2018)
Centaur conducted several TEM surveys to evaluate the presence of brine beyond the margins of the Salar in the Corral Colorado river valley, the Sijes subbasin, and in the southern portion of the Salar. Figure 7.2 shows the location of the TEM lines.
The TEM lines in the north and east confirmed the existence of a deeper conductive anomaly associated with brine and the overlaying freshwater hosted in the alluvial sediments.
The southern lines over the Blanca Lila Fm showed a conductive unit close to the surface interpreted as the halite unit saturated with brine, based on drilling.
|
7.2.4.2 Passive seismic survey (2019)
A passive seismic survey was conducted by Centaur in 2019 to map basement and confirm interpreted fractures to the south and east of the Salar. This study consisted of 78 stations arranged in 10 east-west orientated lines (Figure 7.2). The survey did not consistently identify basement rocks due to depth and the poor seismic contrast between the massive halite body and basement rocks.
7.2.4.3 TEM survey (2022a)
AMSA carried out a TEM survey during 2022 along the eastern boundary of the Salar to refine the delineation of the overburden and hydrogeological basement, and to further investigate the freshwater/brine interface in this portion of the Salar based on Centaur's 2018 survey. The profile locations are shown in Figure 7.2.The survey helped identify the limit between the unconsolidated sediments and basement rock. These results and interpretations were correlated to lithological information of boreholes DD-01, DD-02 and DD-03.
7.2.5 LAC exploration (2022)
7.2.5.1 ERT survey (2022b)
LAC conducted an ERT survey to refine the delineation of freshwater resources suitable for industrial water supply in the alluvial deposits in the north-eastern portion of the Project. The survey consisted of 12 lines (Figure 7.2) with a vertical maximum resolution of 160 m -200 m.
Three geoelectrical units were identified 1) fine grained sediments with abundant interstitial clay and saturated with brine of high electrical conductivity; 2) fine to coarse grained sediments saturated with water; and 3) medium to coarse grained sediments partially or not saturated.
7.2.6 Recommendations
It is recommended to carry out additional geophysical surveys on the AMSA properties to improve the understanding of the basin geometry and the brine resource in the Salar and the marginal areas.
|
7.3 DRILLING
7.3.1 Overview
Three drilling campaigns have been carried out for the Project since 20119. Eramet conducted the first exploration program in 2011 including 11 shallow exploration boreholes ("SW" series), two diamond drill holes (DW01PGDDH and DW02PGDDH), four shallow exploration holes completed with 6-inch diameter casing ("PMP" series), and three exploration wells of varying depths completed with 6-inch diameter casing (DW03PG, DW04PG, DW05PG). Detailed information of these boreholes has not been published and is mostly unavailable, although according to Dworzanowski et al. (2018) maximum depths reached at this stage rarely exceeded 100 m. The second and third campaign conducted by Millennial included 32 brine exploration boreholes (PGMW16-01 through PGMW19-22), 6 freshwater exploration wells (PGWW18-01 to PGWW19-06) and 4 brine production wells (PGPW16-01 to PGPW18-17) with drilling depths of up to 600 m. Most of the monitoring wells were completed as piezometers with 2-inch diameter PVC slotted casing, while production wells were constructed with 6 to 8-inch diameter screened casing.
AMSA and Centaur carried out drilling programs on the Sal de la Puna Project in between 2018 and 2022. These programs consisted of two diamond core holes (DD-01 and DD-02), five combination core /rotary holes (PP-01-2018, PP-02-2018 and R-01 through R-03), two production wells (PP-03-2019 and PW-1), and several piezometer installations.
The objectives of the drilling program can be broken down into three general categories:
1. Exploration drilling to allow the estimation of "in-situ" brine resources: The drilling methods were selected to allow for 1) the collection of continuous cores to prepare "undisturbed" samples from specified depth intervals for laboratory porosity analyses and 2) the collection of depth-representative brine samples at specified intervals. Additional details of the sampling process can be found in the following chapters 11 and 12 of this report.
2. Test well installations: 8 rotary holes (PGPW16-01 to PGPW18-17; PGWW18-01 to PGWW19-03, and PW-1) which were drilled and completed as production wells to carry out pumping tests and additional selective brine sampling. Monitoring wells were installed adjacent to most of these production wells for use during the pumping tests as observation points.
3. Pumping tests: Eight pumping tests had been completed in the Salar of Pastos Grandes. These tests included three short-term tests (PGWW18-02, PGWW19-02 and PGWW19-03), each lasting about one day and conducted on freshwater wells; three three-day tests conducted on brine wells (PGPW16-01, PGPW18-15 and PGPW18-17); and two long-term pumping tests (PGPW16-01 and PGPW17-04) with 23- and 30-day duration.
Figure 7.3 shows the location of the drilling carried out for the Project and Table 7.1 includes a summary of the construction details of each completed borehole.
9 All holes drilled at the Salar were drilled vertically.
|
Figure 7.3 Borehole locations in Salar de Pastos Grandes
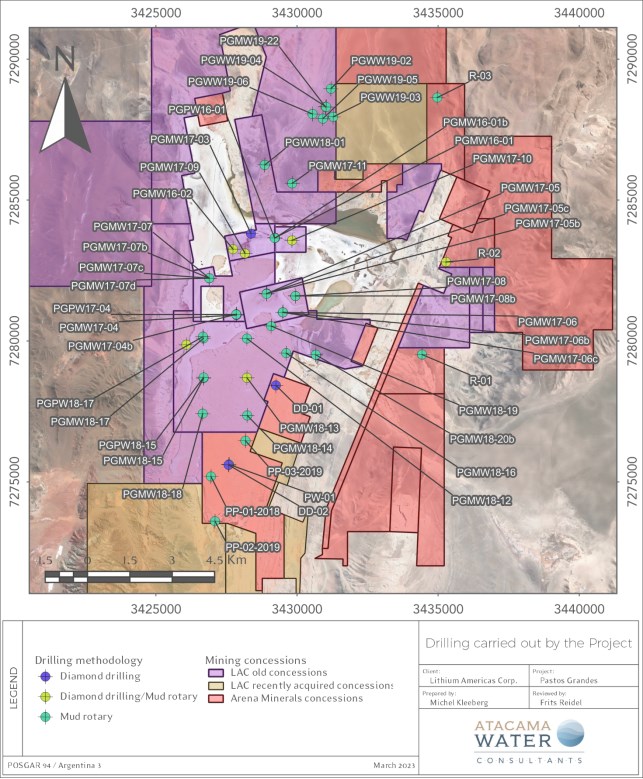
|
Table 7.1 Summary of 2016-2022 boreholes
|
Borehole |
East (m) |
North (m) |
Elevation |
TD (m) |
Method |
Year |
Completion |
|
|
Diameter |
Screened |
|||||||
|
PGMW16-01 |
3,429,218 |
7,283,662 |
3,775.60 |
190 |
DDH |
2016 |
2" |
8.6-91.7 |
|
PGMW16-01b |
3,429,221 |
7,283,655 |
3,775.60 |
355 |
MR |
2016 |
2" |
0-283.6 |
|
PGMW16-02 |
3,427,731 |
7,283,257 |
3,785 |
400 |
DDH/MR |
2016 |
2" |
8.5-386.9 |
|
PGMW17-03 |
3,428,367 |
7,283,805 |
3,773.6 |
154 |
DDH |
2017 |
- |
- |
|
PGMW17-04 |
3,427,853 |
7,280,921 |
3,789.80 |
245,5 |
DDH |
2017 |
- |
- |
|
PGMW17-04b |
3,427,849 |
7,280,949 |
3,786.90 |
564 |
DDH/MR |
2017 |
2" |
4.2-206.0 |
|
211.6-389.4 |
||||||||
|
395.0-519.5 |
||||||||
|
PGMW17-05 |
3,428,922 |
7,281,677 |
3,773.9 |
121 |
DDH |
2017 |
- |
- |
|
PGMW17-05b |
3,428,927 |
7,281,683 |
3,773.9 |
387 |
DDH |
2017 |
- |
- |
|
PGMW17-05c |
3,428,918 |
7,281,672 |
3,773.9 |
601 |
MR |
2017 |
2" |
14.2-180.6 |
|
186.6-371 |
||||||||
|
PGMW17-06 |
3,429,497 |
7,281,016 |
3,785 |
455 |
DDH/MR |
2017 |
- |
- |
|
PGMW17-06b |
3,429,497 |
7,281,016 |
3,785 |
424 |
MR |
2017 |
- |
- |
|
PGMW17-06c |
3,429,497 |
7,281,016 |
3,785 |
571 |
MR |
2017 |
- |
- |
|
PGMW17-07 |
3,426,888 |
7,282,228 |
3,763.1 |
203,3 |
DDH |
2017 |
- |
- |
|
PGMW17-07b |
3,426,888 |
7,282,228 |
3,763.1 |
203,3 |
MR |
2017 |
- |
- |
|
PGMW17-07c |
3,426,888 |
7,282,228 |
3,763.1 |
412 |
DDH/MR |
2017 |
- |
- |
|
PGMW17-07d |
3,426,901 |
7,282,217 |
3,763.1 |
510 |
MR |
2017 |
2" |
12-17.95 |
|
29.70-249.88 |
||||||||
|
261.64-499.73 |
||||||||
|
PGMW17-08 |
3,429,941 |
7,281,596 |
3,785 |
425,5 |
DDH |
2017 |
- |
- |
|
PGMW17-08b |
3,429,941 |
7,281,596 |
3,785 |
446 |
MR |
2017 |
- |
- |
|
PGMW17-09 |
3,428,156 |
7,283,107 |
3,785 |
595 |
DDH/MR |
2017 |
2" |
11.7-198.8 |
|
204.7-397.3 |
||||||||
|
403.3-583.0 |
||||||||
|
PGMW17-10 |
3,429,822 |
7,283,569 |
3,773.7 |
601 |
DDH/MR |
2017 |
- |
- |
|
PGMW17-11 |
3,429,826 |
7,285,591 |
3,817.60 |
568 |
MR |
2017 |
2" |
278.95-546.66 |
|
PGMW18-12 |
3,428,224 |
7,280,087 |
3,787.70 |
554 |
MR |
2018 |
2" |
71.61-543.61 |
|
|
Borehole |
East (m) |
North (m) |
Elevation |
TD (m) |
Method |
Year |
Completion |
|
|
Diameter |
Screened |
|||||||
|
PGMW18-13 |
3,428,223 |
7,278,696 |
3,795.30 |
559 |
DDH/MR |
2018 |
2" |
82.49-314.85 |
|
320.81-553.16 |
||||||||
|
PGMW18-14 |
3,428,234 |
7,277,357 |
3,797.10 |
635 |
MR |
2018 |
2" |
70.79-313.69 |
|
319.66-628.57 |
||||||||
|
PGMW18-15 |
3,426,687 |
7,278,678 |
3,792.70 |
594 |
MR |
2018 |
2" |
74.23-321.96 |
|
327.85-587.38 |
||||||||
|
PGMW18-16 |
3,429,618 |
7,279,568 |
3,790.40 |
641 |
MR |
2018 |
2" |
73.19-321.38 |
|
327.28-629.08 |
||||||||
|
PGMW18-17 |
3,426,685 |
7,280,094 |
3,767.50 |
605 |
MR |
2018 |
2" |
17.63-129.24 |
|
135.21-170.61 |
||||||||
|
200.43-306.32 |
||||||||
|
312.28-595.05 |
||||||||
|
PGMW18-18 |
3,426,656 |
7,277,421 |
3,798.70 |
605 |
MR |
2018 |
2" |
8.35-273.46 |
|
PGMW18-19 |
3,429,083 |
7,280,529 |
3,787.70 |
602 |
MR |
2018 |
- |
|
|
PGMW18-20b |
3,430,661 |
7,279,511 |
3,777.30 |
575 |
MR |
2018 |
2" |
0.40-64.79 |
|
111.99-336.11 |
||||||||
|
PGMW19-21 |
3,426,079 |
7,279,867 |
3,784.50 |
574,3 |
DDH/MR |
2019 |
2" |
26.15-285.16 |
|
291.01-567.71 |
||||||||
|
PGMW19-22 |
3,431,009 |
7,288,304 |
3,832.50 |
464,5 |
DDH/MR |
2019 |
2" |
37.8-363 |
|
PGPW16-01 |
3,429,204 |
7,283,655 |
3,775.60 |
351 |
MR |
2016 |
6" |
20-351 |
|
PGPW17-04 |
3,427,842 |
7,280,941 |
3,788.50 |
475 |
MR |
2017 |
6" |
113.37-464.31 |
|
PGPW18-15 |
3,426,687 |
7,278,707 |
3,792.70 |
610 |
MR |
2018 |
6" |
76.88-592.8 |
|
PGPW18-17 |
3,426,666 |
7,280,153 |
3,767.50 |
606 |
MR |
2018 |
8" |
50.43-594.4 |
|
PGWW18-01 |
3,428,857 |
7,286,244 |
3,781.20 |
42 |
MR |
2018 |
6" |
4-34 |
|
PGWW19-02 |
3,431,200 |
7,288,950 |
3,874.70 |
62 |
MR |
2019 |
6" |
29.53 |
|
PGWW19-03 |
3,431,279 |
7,287,953 |
3,821.70 |
62 |
MR |
2019 |
6" |
17-53 |
|
PGWW19-04 |
3,431,032 |
7,288,305 |
3,831.50 |
62 |
MR |
2019 |
- |
- |
|
PGWW19-05 |
3,430,916 |
7,287,889 |
3,844 |
62 |
MR |
2019 |
- |
- |
|
PGWW19-06 |
3,430,545 |
7,288,054 |
3,842.50 |
62 |
MR |
2019 |
- |
- |
|
PP-01-2018 |
3,427,028 |
7,275,405 |
3,805,70 |
611 |
MR |
2019 |
2" |
No data |
|
|
Borehole |
East (m) |
North (m) |
Elevation |
TD (m) |
Method |
Year |
Completion |
|
|
Diameter |
Screened |
|||||||
|
PP-02-2019 |
3,427,171 |
7,273,819 |
3,772,50 |
650 |
MR |
2019 |
2" |
No data |
|
PP-03-2019 |
3,428,251 |
7,276,673 |
3,803,2 |
542 |
MR |
2019 |
10"-212-8" |
No data |
|
DD-01 |
3,429,329 |
7,278,639 |
3,793,5 |
700 |
DDH |
2022 |
2" |
6m every 12m |
|
DD-02 |
3,427,651 |
7,275,815 |
3,802,50 |
646 |
DDH |
2022 |
2" |
380-440 |
|
R-01 |
3,434,507 |
7,279,732 |
3,794,70 |
601 |
MR |
2022 |
2" |
497-515 |
|
R-02 |
3,435,359 |
7,283,016 |
3,813 |
411 |
DDH/MR |
2022 |
2" |
6m every 12m |
|
R-03 |
3,435,050 |
7,288,856 |
3,836 |
617 |
MR |
2022 |
2" |
18m every 18m |
|
PW-01 |
3,427,651 |
7,275,815 |
3,802,50 |
503 |
MR |
2022 |
10"-200-8" |
350-500 |
Table 7.1 (continuation)
7.3.2 Exploration drilling
Hidrotec S.R.L. was contracted to carry out the drilling program for Millennial during 2016-2019 (PG-PW/PG-MW series). This program totaled 16,882 meters distributed in 42 vertical holes with depths ranging from 121 m to 641 m (Table 7.1). Most boreholes were drilled using a diamond core rig, but loss-circulation conditions required several locations to be re-drilled or to be drilled with a combination of core and mud rotary techniques to reach target depths (Table 7.1).
The following guidelines were followed during the diamond drilling and mud rotary program:
• Core recovery calculated and was recorded.
• Cores were described and stored in labeled cardboard core boxes.
• Drill cuttings were collected from rotary holes, described, and stored in cuttings boxes.
• Most boreholes were completed with 2-inch diameter blank and slotted PVC casing (0.75mm slot size).
The majority of brine sampling was conducted with a packer system. Packer samples were collected at specific intervals during drilling and occasionally upon completion of the drilling. Drive point sampling was used for five samples. The brine sampling procedures are further described in Section 8 below.
7.3.3 Production well drilling
Four production wells (PGPW16-01 to PGPW18-17) were drilled by Hidrotec S.R.L. during 2016=2019 using conventional mud rotary methodology following these general guidelines during the process:
• Drilling fluid was polymer mixed with brine.
• Unwashed and washed drill cuttings were described and stored in labeled plastic cutting boxes.
|
• Once drilling was finished PGPW16-01 was completed with 10-inch diameter blank PVC casing and 6-inch diameter slotted PVC well screen; PGPW17-04 and PGPW-15 were completed with 10-inch diameter blank steel casing and 6-inch diameter slotted steel well screen; and PGPW18-17 was completed with 12-inch diameter blank steel casing, 12 and 8-inch diameter slotted steel well screen.
• Gravel pack (1-3 mm diameter) was installed in the annular space surrounding the well screen.
After the installation of casing, gravel pack, and fill materials, polymer mud was broken down by emplacing sodium hypochlorite solution into the well. The developing process was completed using compressed air and by airlift pumping water and sediment from the well. The sand content of produced brine was monitored during development using an Imhoff cone.
7.3.4 Freshwater Exploration Drilling
A freshwater exploration program was carried out during 2018-2019 and included conventional mud rotary drilling of six wells to depths from 42 m to 62 m (PGWW series). The following guidelines were followed during the drilling process:
• Drilled mud rotary using conventional circulation.
• Drilling fluid was polymer mixed with brine.
• Unwashed and washed drill cuttings were described and stored in labeled plastic cutting boxes.
• PGWW18-01, PGWW19-02 and PGWW19-03 were completed with 6-inch diameter blank and slotted steel casing and gravel pack (1-3 mm diameter).
• PGWW19-04, PGWW19-05 and PGWW19-06 remained uncased.
7.3.5 Recommendations
The following additional drilling is recommended to improve the lithium resource base of the project and to further explore groundwater resources for the development of a sustainable water supply
• Based on the results of predictive model simulations drill and complete three additional brine production wells in the lower brine aquifer.
• Drill 7-10 deep exploration core holes aimed at increasing the lithium resource base of the Project.
• Drill 10-15 piezometers and 3-5 production wells to explore for groundwater resources in the Pastos Grandes and Sijes basins to meet water supply requirements for the future operation of the Project. The results of this groundwater exploration program need to be incorporated in the numerical groundwater flow model.
|
7.4 Hydraulic testing
Millennial completed eight pumping tests between 2017 and 2019. These tests included three one-day tests on the freshwater wells; three three-day tests on brine wells; and two long-term pumping tests (23- and 30-day duration) also on brine wells. Figure 7.4 includes the layout of each of these pumping tests.
7.4.1 Brine Well Pumping Tests
7.4.1.1 PGPW16-01 (2017)
A 3-day pumping test was carried out on well PGPW16-01 at an average pumping rate of 27.7 L/s. The configuration of the test and its results are shown in Table 7.2 and Figure 7.5 . The production well is screened across the saline halite unit and the underlying brine aquifer. This test included four observation wells but only SW03PG-1 (without completion information) reacted to pumping. Drawdown and recovery data were interpreted, respectively with Cooper & Jacob (1946) and Theis (1935) recovery solutions leading to a hydraulic conductivity (K) estimate of about 3 m/d.
|
Figure 7.4 Location map of the pumping tests conducted in Salar de Pastos Grandes
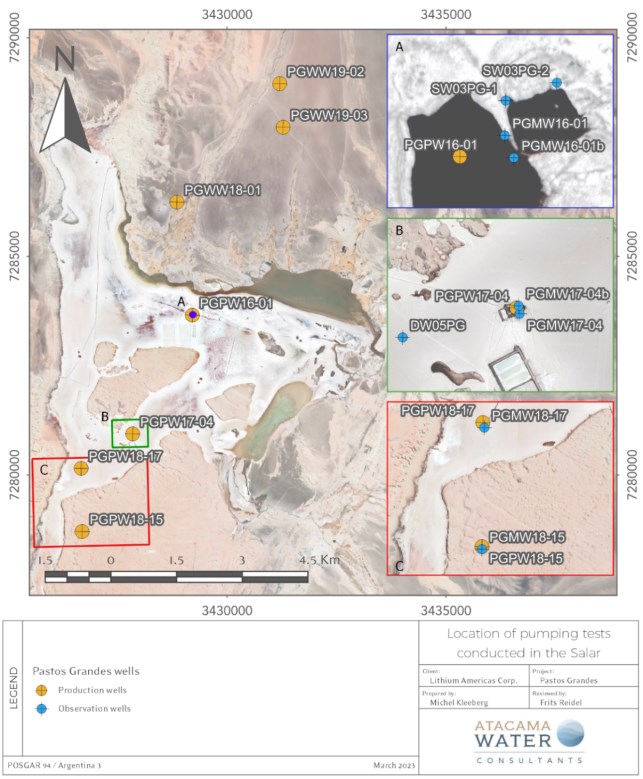
|
Table 7.2 Summary of pumping test PGPW16-01 (2017)
|
PGPW16-01 (2017) |
|||||||||
|
Well |
Type |
Q |
Duration |
Lithology |
Minimum |
Maximum |
Fit |
T |
K |
|
PGPW16-01 |
P |
27.7 |
3 |
Mixed halite, sand, silt |
224 |
9.04 |
C&J |
1.100 |
4.91 |
|
Theis Rec. |
500 |
2.23 |
|||||||
|
SW03PG-1 |
O |
Mixed halite, sand, silt |
#N/D |
1.19 |
C&J |
1.100 |
#N/D |
||
|
Theis Rec. |
1 |
#N/D |
|||||||
7.4.1.2 PGPW17-04
A 23-day pumping test was completed on PGPW17-04 at a pumping rate of 15.23 L/s in 2019. The production well is screened across halite, sand, and silt; because of the low permeability of the halite it is believed that the drawdown response is mainly related to the unconsolidated clastic sediments beneath it. Drawdown data during the pumping stage was discarded due to an apparent non-related water level recovery observed during test. Therefore, only recovery data were adjusted to the Theis (1935) recovery solution, leading to a transmissivity estimate of 40 m2/d, or a hydraulic conductivity 0.12 m/d assuming a saturated thickness of 329 m. The configuration of the test and its results are shown in Table 7.3 and Figure 7.5.
Table 7.3 Summary of pumping test PGPW17-04
|
PGPW17-04 |
|||||||||
|
Well |
Type |
Q |
Duration |
Lithology |
Minimum saturated thickness (m) |
Maximum |
Fit |
T |
K |
|
PGPW17-04 |
P |
15.23 |
23 |
Mixed halite, sand, silt |
329 |
57.11 |
Theis Rec. |
40 |
0.12 |
7.4.1.3 PGPW18-15
A pumping test (variable and constant rate, and recovery) was carried out in PGPW18-15 during April of 2019. The well was screened in the same lithological unit as PGPW-17-04. The configuration of this test and its results are shown in Table 7.4 and Figure 7.5. Water levels during the test were also monitored in PGMW18-15. The hydraulic conductivity was estimated to range between 0.15 - 0.22 m/d.
|
Table 7.4 Summary of pumping test PGPW18-15
|
PGPW18-15 |
|||||||||
|
Well |
Type |
Q |
Duration |
Lithology |
Minimum |
Maximum |
Fit |
T |
K |
|
PGPW18-15 |
P |
24.1 |
3 |
Mixed halite, sand, silt |
456 |
38.7 |
C&J |
90 |
0.2 |
|
Theis Rec. |
70 |
0.15 |
|||||||
|
PGMW18-15 |
O |
Mixed halite, sand, silt |
453 |
6.5 |
Theis |
100 |
0.22 |
||
7.4.1.4 PGPW18-17
A three-day pumping test was conducted on well PGPW18-17 well with an average pumping rate of 19.4 L/s. The configuration of the test and its results are shown in Table 7.5 and Figure 7.8 . Drawdown data was measured only in the pumping well and was adjusted to the Cooper and Jacob (1946) and Theis (1935) recovery solutions. The estimated hydraulic conductivity ranges between 0.17 - 0.22 m/d, which is consistent with previous results for the same lithologies in the Salar.
Table 7.5 Summary of pumping test PGPW18-17
|
PGPW18-17 |
|||||||||
|
Well |
Type |
Q |
Duration |
Lithology |
Minimum |
Maximum |
Fit |
T |
K |
|
PGPW18-17 |
P |
19.4 |
3 |
Mixed halite, sand, silt |
589 |
30.31 |
C&J |
130 |
0.22 |
|
Theis Rec. |
100 |
0.17 |
|||||||
7.4.1.5 PGPW16-01 (2019)
A 15-day pumping test was conducted on well PGPW16-01 at an average pumping rate of 23.2 L/s during Mau 2019. The results of this 2019 test are summarized in Table 7.6 and Figure 7.9 and are quite similar to the results of the 2017 test. Drawdown and recovery data were interpreted with the Theis (1935) recovery solution, leading to a hydraulic conductivity estimate of about 2 m/d.
|
Table 7.6 Summary of pumping test PGPW16-01 (2019)
|
PGPW16-01 (2019) |
|||||||||
|
Well |
Type |
Q |
Duration |
Lithology |
Minimum |
Maximum |
Fit |
T |
K |
|
PGPW16-01 |
P |
23.2 |
15 |
Mixed halite, sand, silt |
224 |
15.15 |
Theis Rec. |
400 |
1.79 |
7.4.2 Pumping tests conducted in freshwater wells
7.4.2.1 PGWW18-01
A variable rate and a 1-day constant rate tests with an average flow rate of 0.85 L/s was carried out on well PGWW18-01 in May 2019. No hydraulic parameters could be obtained from this test because of the short test duration and the low pumping rate as shown in Table 7.7 .
Table 7.7 Summary of pumping test PGWW18-01
|
PGWW18-01 |
|||||||||
|
Well |
Type |
Q |
Duration |
Target lithology |
Minimum |
Maximum |
Adjust |
T |
K |
|
PGWW18-01 |
P |
0.85 |
1 |
Gravels and sands |
10.96 |
5.13 |
- |
- |
- |
7.4.2.2 PGWW19-02
Well PWGWW19-02 was pump tested in 2019 (a variable rate, a constant rate and a recovery). The layout of this test and results are shown in Figure 7.10 and in Table 7.8. Drawdown and recovery trends were adjusted with the Cooper and Jacob (1946) and Theis (1935) recovery solutions, respectively. Estimated hydraulic conductivity values ranged from 20 to 60 m/d which is considered reasonable for these types of coarse-grained unconsolidated sediments. The pumping test configuration didn't include observation wells; therefore, no storage estimates could be obtained.
Table 7.8 Summary of pumping test PGWW19-02
|
PGWW19-02 |
|||||||||
|
Well |
Type |
Q |
Duration |
Lithology |
Minimum |
Maximum |
Fit |
T |
K |
|
PGWW19-02 |
P |
24 |
0.8 |
Gravels and sands |
15.5 |
5.32 |
C&J |
1.6 |
66.67 |
|
Theis Rec. |
500 |
20.83 |
|||||||
7.4.2.3
|
7.4.2.4 PGWW19-03
A variable rate, constant rate test and recovery test were carried out on Well PWWW19-03. The layout of this test and main results are shown in Figure 7.11 and in Table 7.9. Drawdown and recovery trends were adjusted with the Cooper and Jacob (1946) and Theis (1935) recovery solutions, respectively. Estimated hydraulic conductivity ranges from 6 to 11 m/d, which is reasonable for this type of coarse-grained unconsolidated sediments with a higher fine fraction. The pumping test configuration didn't include any observation wells; therefore, no storage estimates could be obtained from this test.
Table 7.10 and Table 7.11 include summary information on the pumping tests conducted in the Salar.
Table 7.9 Summary of pumping test PGWW19-03
|
PGWW19-03 |
|||||||||
|
Well |
Type |
Q |
Duration |
Lithology |
Minimum |
Maximum |
Fit |
T |
K |
|
PGWW19-03 |
P |
3.41 |
1 |
Gravels and sands |
36 |
3.46 |
C&J |
250 |
6.94 |
|
Theis Rec. |
400 |
11.11 |
|||||||
7.4.3 Recommendations
It is recommended that the following additional test work is carried out to improve the confidence level in the quantification of the hydraulic parameters of the brine and freshwater systems:
• Carry out a 30-day pumping test on AMSA brine production well PW-1 to characterize the southern extent of the lower brine aquifer.
• Carry out 30-day pumping tests in existing brine production wells PGPW18-15 and PGPW18-17 with water level monitoring in the above-mentioned new observations points.
• Carry out 7-day pumping test on water production wells PGMW19-2 and PGPW19-3 along with additional groundwater exploration work to secure future water supply requirements from freshwater resources within the Pastos Grandes and Sijes basins.
|
Figure 7.5 Location, setup and results of pumping test well PGPW16-01 (2017)
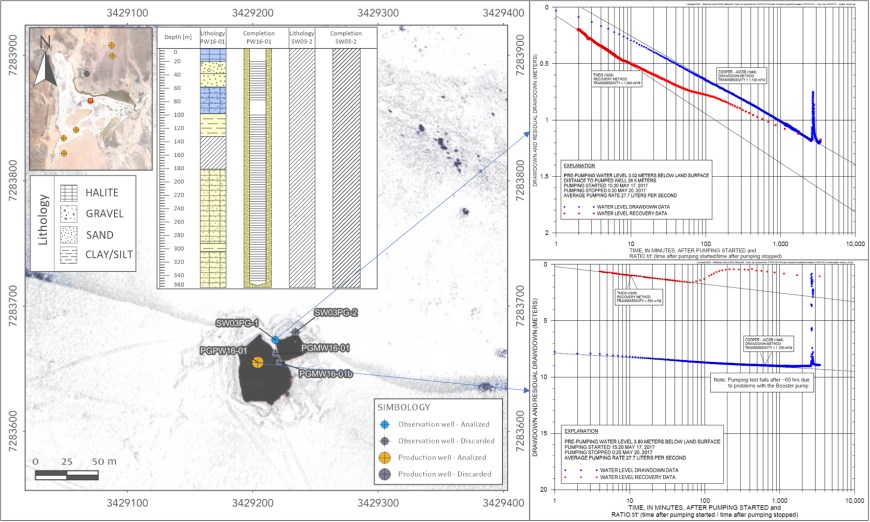
|
Figure 7.6 Location, setup and results of pumping test PGPW17-04
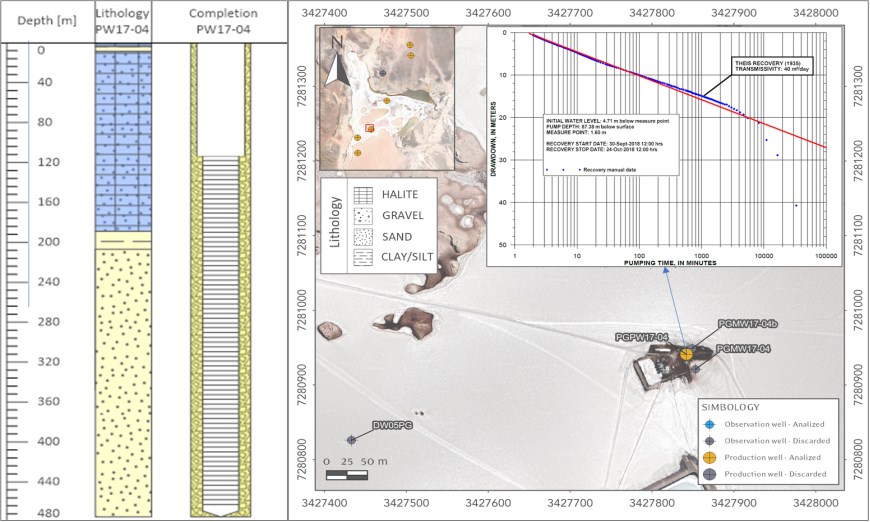
|
Figure 7.7 Location, setup and results of pumping test PGPW18-15
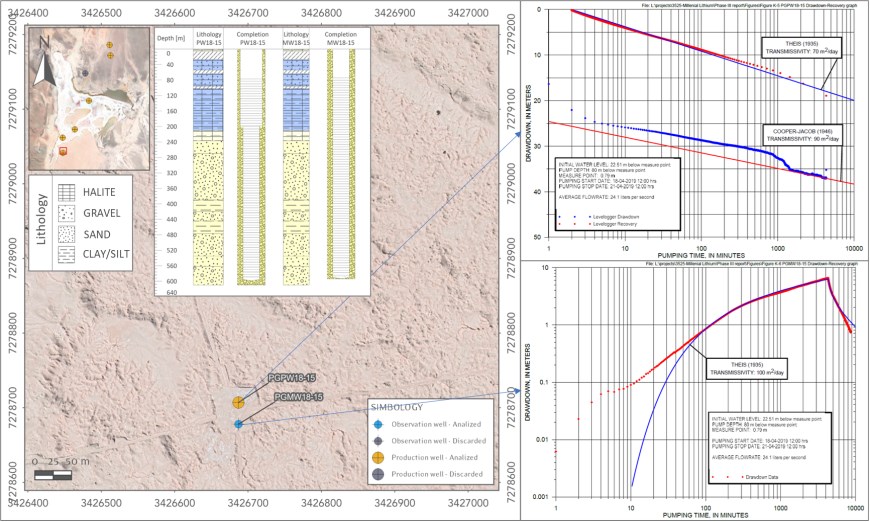
|
Figure 7.8 Location, setup and results of pumping test PGPW18-17
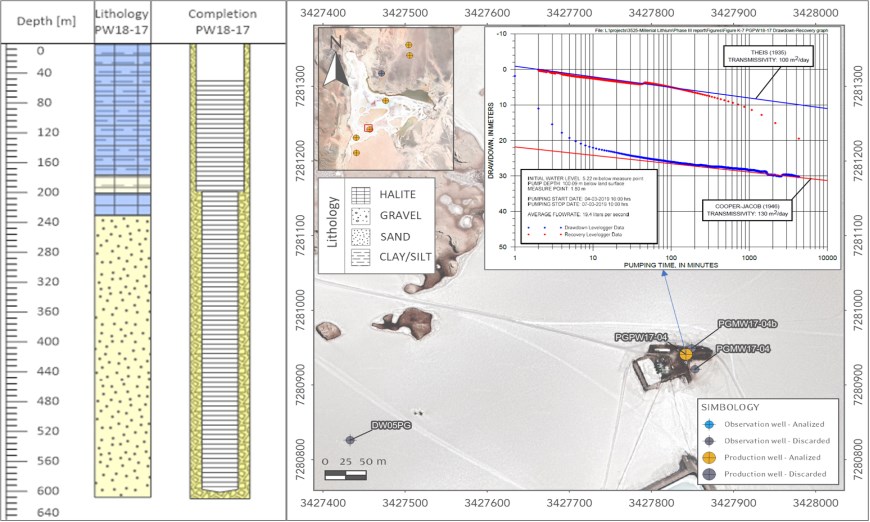
|
Figure 7.9 Location, setup and results of pumping test PGPW16-01 (2019)
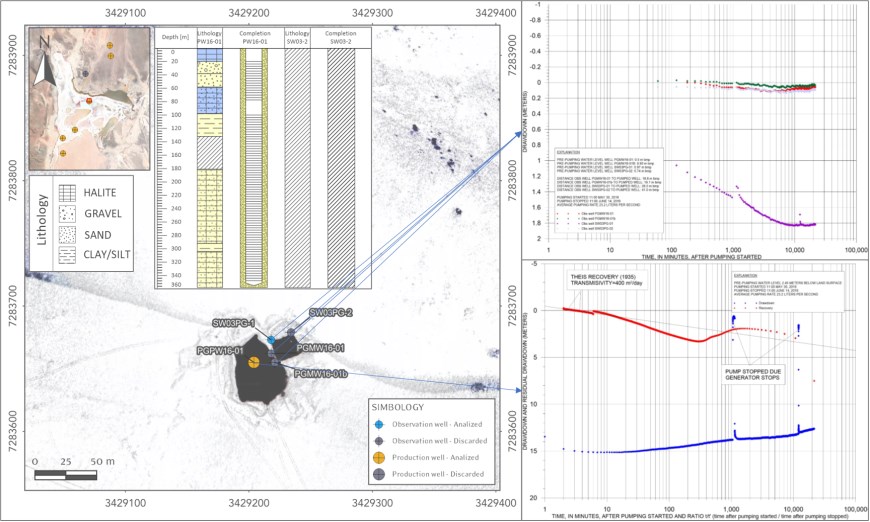
|
Figure 7.10 Location, setup and results of pumping test PGWW19-02
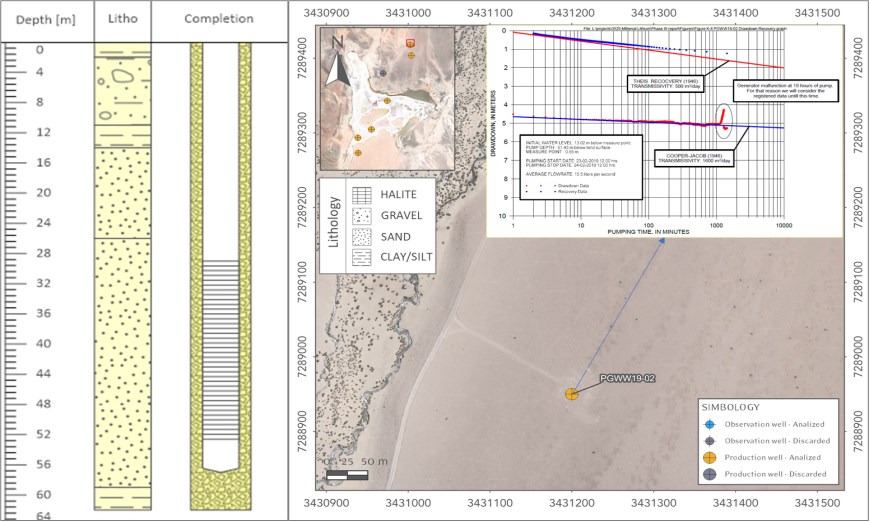
|
Figure 7.11 Location, setup and results of pumping test PGWW19-03
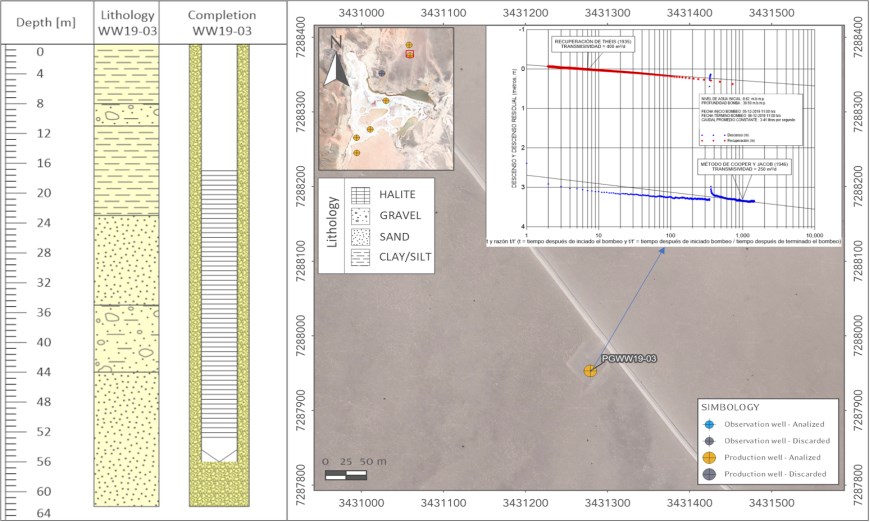
|
Table 7.10 Summary of brine well tests
|
Test |
Well |
Type |
Q |
Duration |
Lithology |
Minimum |
Maximum |
Fit |
T |
K |
Specific |
|
PGPW16-01 (2017) |
PGPW16-01 |
P |
27.7 |
3 |
Mixed halite, sand, silt |
224 |
9.04 |
C&J (1946) |
1.1 |
4.9 |
3.1 |
|
Theis Rec. (1935) |
500 |
2.2 |
- |
||||||||
|
PGMW16-01 |
O |
Mixed halite, sand, silt |
38 |
0.13 |
- |
- |
- |
- |
|||
|
PGMW16-01b |
O |
Mixed halite, sand, silt |
189 |
0.08 |
- |
- |
- |
- |
|||
|
SW03PG-1 |
O |
Mixed halite, sand, silt |
No data |
1.19 |
C&J (1946) |
1.1 |
- |
- |
|||
|
Theis Rec. (1935) |
1 |
- |
- |
||||||||
|
SW03PG-2 |
O |
Mixed halite, sand, silt |
No data |
0.03 |
- |
- |
- |
- |
|||
|
PGPW17-04 |
PGPW17-04 |
P |
15.2 |
23 |
Mixed halite, sand, silt |
329 |
57.11 |
Theis Rec. (1935) |
40 |
0.12 |
0.27 |
|
PGPW17-04b |
O |
Mixed halite, sand, silt |
484 |
3.88 |
- |
- |
- |
- |
|||
|
DW05PG |
O |
Mixed halite, sand, silt |
No data |
0.12 |
- |
- |
- |
- |
|||
|
PGPW18-15 |
PGPW18-15 |
P |
24.1 |
3 |
Mixed halite, sand, silt |
456 |
38.70 |
C&J (1946) |
90 |
0.20 |
0.68 |
|
Theis Rec. (1935) |
70 |
0.15 |
- |
||||||||
|
PGMW18-15 |
O |
Mixed halite, sand, silt |
453 |
6.50 |
Theis (1935) |
100 |
0.22 |
- |
|||
|
PGPW18-17 |
PGPW18-17 |
P |
19.4 |
3 |
Mixed halite, sand, silt |
589 |
30.31 |
C&J (1946) |
130 |
0.22 |
0.64 |
|
Theis Rec. (1935) |
100 |
0.17 |
- |
||||||||
|
PGPW16-01 (2019) |
PGPW16-01 |
P |
23.2 |
15 |
Mixed halite, sand, silt |
224 |
15.15 |
Theis Rec. (1935) |
400 |
1.8 |
1.5 |
|
PGMW16-01 |
O |
Mixed halite, sand, silt |
38 |
0.12 |
- |
- |
- |
- |
|||
|
PGMW16-01b |
O |
Mixed halite, sand, silt |
189 |
0.07 |
- |
- |
- |
- |
|||
|
SW03PG-1 |
O |
Mixed halite, sand, silt |
No data |
1.83 |
- |
- |
- |
- |
|||
|
SW03PG-2 |
O |
Mixed halite, sand, silt |
No data |
0.14 |
- |
- |
- |
- |
|
Table 7.11 Summary of freshwater pumping tests
|
Test |
Well |
Type |
Q |
Duration |
Lithology |
Minimum |
Maximum |
Fit |
T |
K |
Specific |
|
PGWW19-02 |
PGWW19-02 |
P |
15.5 |
0.8 |
Gravels and sands |
24 |
5.32 |
C&J (1946) |
1.6 |
66.6 |
2.9 |
|
Theis rec. (1935) |
500 |
20.8 |
- |
||||||||
|
PGWW19-03 |
PGWW19-03 |
P |
3.1 |
1 |
Gravels and sands |
36 |
3.46 |
C&J (1946) |
250 |
66.6 |
0.9 |
|
Theis rec. (1935) |
400 |
11.1 |
- |
||||||||
|
PGWW18-01 |
PGWW18-01 |
P |
0.85 |
1 |
Gravels and sands |
10.96 |
5.13 |
- |
- |
- |
0.2 |
 |
8 SAMPLE PREPARATION, ANALYSIS, AND SECURITY
8.1 Sampling Methods and Assays
8.1.1 Millennial drainable porosity analysis (2016-2019)
Samples were obtained from 'undisturbed' core during the 2016-2019 Millennial drilling programs and analyzed for drainable porosity by Core Laboratories-Petroleum Services in Houston, Texas ("Corelabs"). In addition, rotary drill cuttings were sent to Geosystems Analysis in Tucson, Arizona ("GSA") for repacking, triaxial testing, and drainable porosity analysis. Both Corelabs and GSA are independent laboratories and have no relationship with LAR,
Both Corelabs and GSA offer advanced petrophysical and geological analysis and interpretation services for core samples. These laboratories operate in compliance with ISO 9001:2008 Certification ensuring that processes and procedures adhere to internationally recognized quality standards. The analytical procedures for determining drainable porosity for each laboratory are further described below.
Corelab drainable porosity analysis are based on centrifuge methodology and involve the following:
1. 38 mm (1.5-inch) diameter cylindrical plugs were cut from the sample material.
2. Samples were frozen with dry ice to maintain their integrity, if required.
3. Sample weight and thickness were measured.
4. The plugs were encapsulated in Teflon and nickel foil as required, and nickel screens were placed on the ends of the plugs. The encapsulated samples were then weighed.
5. Bulk density was calculated as: (Mass of plug before encapsulation) / (Calliper bulk volume).
6. The plugs were placed in brine and saturated under vacuum to ensure full saturation. Corelabs utilized a standard sodium chloride brine with a NaCl concentration of 244,000 ppm with a density of 1.184 gm/cm3.
7. The weight of the saturated cores was recorded.
8. The samples were desaturated in a high-speed centrifuge for 4 hours. Spin rates were calculated to provide a drainage pressure of 1 pound per square inch (psi) for poorly cemented or loose sands and 5 psi for clay and halite.
9. The drainage was collected, and the volume was recorded. The effluent was saved for possible analysis. However, it should be noted that the fluid collected from these cores may not be representative of in situ brines if re-saturation with NaCl was required.
10. Plugs were removed from the centrifuge and weight was recorded. Drained fluid volume was calculated as: (saturated plug weight - drained plug weight) /1.184. Drainable porosity was calculated as (Drained fluid volume) / (Calliper bulk volume).
11. Total porosity was calculated after drying the samples for 5 days at 115.6 degrees Celsius to record dry weight.
|
12. All weight loss is assumed to be water lost from pore space where volume of water loss is calculated as: ((Drained plug weight) - (Oven-dried plug weight))/ (Water density of 1 g/cc).
13. Total porosity is calculated as ((Drained fluid volume) + (Oven drying fluid loss))/ (Calliper bulk volume).
GSA drainable porosity analysis procedures for repacked sediment samples include the following steps:
1. All loose and sandy samples were packed into test cells with moderate effort without prior knowledge of bulk density or other consolidation tests. Additional repacking was performed on some samples with minimum and maximum effort to evaluate the effectiveness and variation of hand-packing at higher and lower densities. Bulk densities approximately 0.1 g/cm3 lower and higher than the initial density were achieved, respectively.
2. The sandy material was packed into a stainless-steel ring in several small lifts. The weight and packing height of the first lift were used to guide the subsequent lifts to ensure consistent density packing. Scales were used to track the equipment, cell, and sample weights throughout the process, and the final packed and assembled core weight was recorded.
3. Plastic air tubing, approximately 6 inches in length, was inserted into the top of each core to monitor saturation and prevent brine solution spillage. The cores were then assembled and saturated slowly from the bottom up using provided brine. A combination of gravity feed and vacuum suction was used to achieve the target saturation. If the target saturation could not be reached using gravity feed alone, vacuum suction was applied. The saturation process lasted for up to 24 hours. Once fully saturated, the cores were closed at the bottom with a hose clamp to prevent brine solution loss and disconnected from the saturation setup.
4. Each cell assembly underwent three pressure steps after being transferred to a test rack. The first step, at 0 mbar pressure, lasted for 24 hours and was applied to remove excess saturation solution. To approximate the release of brine solution at 120 mbar and 1/3 bar of the brine solution, two sequential pressure steps were used at 120 mbar and 1/3 bar, respectively. The 120-mbar pressure step was maintained for 2 days, and the 1/3 bar was continued for another 2 to 4 days. Weight measurements were taken twice a day to determine the loss of brine solution over time. After the final step the cores were disassembled and samples were oven dried to determine total porosity following the procedure described in MOSA, 2002, Part 4 Ch. 2, 2.3.2.1.
5. To estimate the brine solution release volumes at the 120 millibar and 1/3 bar pressure steps, the difference was calculated between the measured total porosity and the moisture retained after the pressure plate measurements as outlined in MOSA (2002), Part 4, Chapter 3, Section 3.3.3.5. The solution's release volume obtained at 1/3 bar was regarded as an approximation of the maximum solution drainage that could occur under gravity or pumping conditions, and hence was used to determine the specific yield.
After completing the tests, the estimated particle density and weight data from core samples at various pressure steps were entered into a spreadsheet. The spreadsheet was programmed to automatically calculate the salt weight left in the sample after drying, estimated porosity, and water content change. Furthermore, particle density was optimized during data processing by utilizing all prior test measurements and using a solver in Microsoft Excel. The laboratory report presented the calculated particle density for each sample.
|
8.1.2 AMSA drainable porosity samples (2021-2022)
36 samples from the AMSA 2021-2022 drilling program were sent to GSA for drainable porosity analysis. All samples were tested using the 'Rapid Brine Release' method (Yao et al., 2018) to measure specific yield (Sy) and total porosity (Pt). Brine release drainable porosity was measured at 120 mbar and 333 mbar of pressure, where:
1. Brine release at 120 mbar represents drainable porosity from sand dominated sediments and rapid brine release from macropores (Nwankwor et al., 1984).
2. Brine release at 333 mbar represents the Sy for intermediate to finer texture sediments (Cassel and Nielsen, 1986).
Brine release values at 120 mbar were provided for reference and 333 mbar values were presented as the estimated Sy (drainable porosity). A subset of paired samples representative of the range in lithology types were selected by AW and GSA for testing using the Relative Brine Release Capacity (RBRC, Stormont et. al., 2011) method by Daniel B. Stephens & Associates, Inc. in Albuquerque, NM (DBSA). The goals of the test work were to provide Sy and Pt values for each sample, summary statistics of Sy and Pt by lithological group, and to compare the Sy and Pt values derived for paired core samples using the RBR and RBRC methods.
Table 8.1 lists the physical properties analyses carried out by GSA. In addition to the RBR testing, physical property tests were run by GSA to assist in lithologic characterization and interpretation of results including bulk density testing (ASTM D2937-17e2) on all RBR samples.
Table 8.1 Summary of laboratory tests conducted by GSA
|
Test Type |
Sample Type and |
Test Method |
Testing Laboratory |
Standard |
|
Physical |
36 core samples |
Bulk density |
GSA Laboratory (Tucson, AZ) |
ASTM D2937-17e2 |
|
36 core samples |
Estimated Particle Density |
GSA Laboratory (Tucson, AZ) |
MOSA Part 4 Ch. 2, 2.2 |
|
|
Hydraulic |
5 core samples |
Relative Brine Release Capacity (RBRC) |
DBS&A (Albuquerque, NM) |
Stormont et. al., 2011 |
|
36 core samples |
Estimated Total Porosity |
GSA Laboratory (Tucson, AZ) |
MOSA Part 4 Ch. 2, 2.3.2.1 |
|
|
Estimated Field Water Capacity |
MOSA Part 4 Ch. 3, 3.3.3.2 |
|||
|
Rapid Brine Release (RBR) |
Modified ASTM D6836-16 |
|||
|
MOSA Part 4 Ch. 3, 3.3.3.5 |
Three packing methods were used to prepare RBR core samples:
|
a) Stainless steel rings were pushed into intact sediment cores to preserve the structure and retain the original bulk density and porosity distribution in the sample.
b) Sediment cores with loose sediment and/or disturbed samples were extruded, and voids were filled in using moderate packing effort to eliminate voids in the test samples.
c) Most solid halite and/or rock cores were cut with a rock saw to fit GSA's RBR test cells and then fit into a 6.35 cm diameter ring and sealed as discussed below.
RBR test cells were prepared by placing a pre-wetted micro-pore membrane (rated 1200 mbar air entry value) into the bottom PVC cap. This membrane maintains a permeable saturated bottom boundary for solution flow and prevents air entry under the target air pressures applied during RBR testing. The PVC caps contain gaskets to create an air-tight test cell that maintains constant air pressure and allows continuous solution outflow through the membrane.
The RBR method is based on the moisture retention characteristic method using the Tempe cell design (Modified ASTM D6836-16), whereby Sy is determined by applying pressures equivalent to gravity drainage to the Test Cell and measuring the amount of brine solution released. Pt is also measured in the RBR method, and is equal to the sum of Sy and Sr.
Each saturated RBR Test Cell was transferred to a test rack for the pressure extraction procedure where no pressure was applied for one day to remove any excess brine solution due to core over-saturation. Two sequential pressure steps were used to approximate brine solution release at 120 mbar and 333 mbar of matric potential (MOSA Part 4 Ch. 3, 3.3.3.2).
The 120-mbar pressure step was maintained for at least two days, and the 333-mbar pressure step was continued for another two to four days. Core assemblies were weighed prior to saturation, after saturation, and then two times daily to determine brine solution loss over time.
All samples were oven dried for three days at 60°C and one day at 105°C after the final step to determine the specific retention (Sr), dry bulk density, and Pt (MOSA Part 4 Ch. 2, 2.3.2.1), where Sr is the volume of water retained by the sample under 333 mbar soil water potential. This drying approach allowed for quantification of the amount of moisture lost due to crystalline water present in gypsum.
Brine solution release volumes at the 120 mbar and at 333 mbar pressure steps were estimated by the weight of brine lost between the initial cell assembly mass and the mass after each pressure plate step divided by the brine specific gravity (Equation 2, MOSA Part 4 Ch3, 3.3.3.5):
![]()
where ws is the saturated weight, w333 mbar is the weight at 333 mbar, A is the sample core area, L is sample length, and Bsg is the specific gravity of the brine solution. The Sy is assumed to approximate the solution release volume from saturation to 333 mbar. Particle density was estimated from the measured porosity and bulk density according to:
|
![]()
8.1.3 Brine samples
Depth-specific brine samples were collected during core and rotary drilling by packer-system, bailing, or drive-point sampling. Bulk (compound) brine samples were obtained during pumping tests on selected exploration wells.
● Depth-specific packer sampling was the primary method used to collect brine samples during the drilling programs for Phase II and III (2016-2020). Most samples were obtained during drilling, although some were also taken after drilling had concluded. Samples were considered acceptable and representative of the depth interval only if they showed no, or minimal traces of drilling mud. The intervals were typically 3 m long and determined by the site geologist after inspecting drill cores or at predetermined depths. However, the interval length may vary depending on the specific circumstances of a given hole or interval, such as borehole stability. To ensure accurate sampling, intervals were flushed out multiple times before collecting the actual sample. The flushed brine was then collected in a barrel, and the time taken to fill the barrel was recorded.
● Drive-point sampling: five brine samples were collected using this method where a drive-point was installed onto BT-sized drill rods after removing the core barrel. The drive-point was then lowered past the drill bit with the help of a drop hammer and an impermeable diaphragm was used to prevent filling of the drill rods during the descent. Once the desired depth was reached, an electric water level sounder was used to confirm that the interior was dry before perforating the diaphragm using a weighted pin lowered with the wireline. This piercing allowed the brine to flow into the drive point and fill the BT rods and collect the samples with the use of a bailer.
● Bailing: the borehole was purged by bailing up to three well volumes of brine from the drill casing as calculated from the water level measurement, prior to collecting the final brine sample from the bottom of the hole. The final brine sample was discharged from the bailer into a 20-liter clean bucket from which one-liter sample bottles were rinsed and filled with brine. Each bottle was taped and marked with the borehole number and depth interval. A small sub-sample from the bucket was used to measure field parameters (density, electric conductivity, pH and temperature) at the wellhead.
● Samples from pumping tests: This method involved collecting samples directly from the discharge pipe at regular intervals during pumping tests. Temperature and density were recorded on internal field sheets.
Regardless of the sampling method, samples were collected in 20-liter containers that were washed with distilled water and rinsed with brine several times prior to filling. The temperature and density were recorded before filling 1-liter sample bottles which were also flushed with brine from the 20-liter container. The sample bottles were then sealed with a secure screw top to prevent leakage and labelled clearly with their identification number. Samples did not undergo any further preparation before being shipped to their respective laboratories.
|
After the sampling process the site geologist would retain possession of the brine samples until they were delivered to the office for shipment to the assay laboratory. Once at the office, duplicates, blanks, and standards were inserted into the assay batches before being sent to the laboratory. Prior to shipment all samples were kept under controlled temperature conditions.
The chemical analysis of brines was conducted by two reputable laboratories: SGS Argentina S.A and Norlab S.R.L, the later partnered with Alex Stewart Assayers (ASA) in 'ASANOA'. The mentioned laboratories have extensive experience analyzing lithium-bearing brines and hold accreditation to ISO 9001 standards and follow the ISO 17025 guidelines. SGS Argentina S.A. and ASANOA are independent laboratories and have no relationship with LAR.
For the primary constituents of interest, including boron, calcium, potassium, lithium, and magnesium, both ASANOA and SGS utilized Inductively Coupled Plasma Analysis (ICP) as the analytical technique, with samples diluted 100:1 prior to analysis. A summary of the analytical methods employed by each laboratory for each physicochemical parameter and analyte is shown in Table 8.2.
Table 8.2 Analytical methods used by ASANOA and SGS for brine assays.
|
Analysis |
ASA Code |
ASA Method |
SGS Code |
SGS Method |
|
Physicochemical Parameters |
||||
|
Alkalinity |
LMFQ167 |
Volumetric |
SM 2320B |
Titration |
|
Conductivity |
LMFQ01 |
Potentiometric |
SM 2510 B |
Resistor Network |
|
Density |
LMFQ19 |
Pycnometer |
ASTM D4052-16 |
Digital Density Meter |
|
Hardness (CaCO3) |
LMFQ13 |
Volumetric |
SM 2320B |
Titration |
|
PH |
LMC128 |
Potentiometric |
SM 4500 H B |
Potentiometric |
|
TDS |
LMFQ08 |
Gravimetric |
SM 2540C |
Gravimetric |
|
Inorganic Parameters |
||||
|
Chlorides (Cl) |
LMC101 |
Argentometric |
SGS.ME.108 |
Ion Chromatography |
|
Sulphates (SO4) |
LMC107 |
Gravimetric |
SGS.ME.108 |
Ion Chromatography |
|
Dissolved Metals |
||||
|
Barium (Ba) |
LMMT03 |
ICP |
SGS.ME.113 |
ICP |
|
Boron (B) |
LMMT03 |
ICP |
SGS.ME.113 |
ICP |
|
Calcium (Ca) |
LMMT03 |
ICP |
SGS.ME.113 |
ICP |
|
Iron (Fe) |
LMMT03 |
ICP |
SGS.ME.113 |
ICP |
|
Lithium (Li) |
LMMT03 |
ICP |
SGS.ME.113 |
ICP |
|
Magnesium (Mg) |
LMMT03 |
ICP |
SGS.ME.113 |
ICP |
|
|
Analysis |
ASA Code |
ASA Method |
SGS Code |
SGS Method |
|
Manganese (Mn) |
LMMT03 |
ICP |
SGS.ME.113 |
ICP |
|
Potassium (K) |
LMMT03 |
ICP |
SGS.ME.113 |
ICP |
|
Sodium (Na) |
LMMT03 |
ICP |
SGS.ME.113 |
ICP |
|
Strontium (Sr) |
LMMT03 |
ICP |
SGS.ME.113 |
ICP |
8.2 Drainable porosity QA/QC
Five duplicate samples were sent to DBSA to serve as check samples to test for accuracy within the drainable porosity analysis. Summary statistics for paired samples by GSA lithologic category for Pt and Sy are provided in Table 8.3 and Table 8.14 respectively. QAQC testing was run on subsamples from the same core, but not on identical samples. Minor differences in material type (sand/silt/clay content) and core physical structure (bulk density, degree of cementation, rock content, macropore content) may result in discrepancies between laboratory measured values. Correlations between GSA and external laboratory measured values of Pt and Sy are provided in Figure 8.1 and Figure 8.2 , respectively.
Variations can likely be attributed to sample heterogeneity within cores which result in subsamples with slightly to significantly different material properties, and differences in laboratory methods such as testing duration. The Sy values measured by GSA were often considerably higher than the Sy values measured by DBSA, particularly for the 333 mbar RBR measurement (Figure 8.2 ). Differences were most pronounced for halite samples due to lithological variability within the group (one crystalline sample with large crystals and one massive to crystalline sample with very scarce matrix). In the absence of sample heterogeneity, differences are likely attributable to testing equilibration time and testing method. DBSA's RBRC method only applied 333 mbar of equivalent pressure for 24 hours and did not use a filter paper to prevent air moving through samples, whereas GSA's RBR testing was run at 120 mb for two days and then 333 mbar for two to four days no air was allowed to move through samples. Therefore, the lower Sy values reported by DBSA may be due to the samples not reaching equilibrium over the testing period. This may be most pronounced in materials with a greater predominance of macropores such as sands. It should be noted that Sy values measured at 120 mbar were generally in better agreement with DBSA's measured Sy values for all sediment lithological groups (Figure 8.3).
Specific gravity was higher for the RBR DD-01 451-451,2 sample (SG = 2.29) compared to the RBRC sample (SG = 2.13). Comparison of average values by lithological group was also limited due to small sample number. Average Pt values measured using the RBRC method (DBSA) were 7% lower for the clastic material group and 129% lower for the halite group. Average Pt values were considerably higher for the clastic group (0.24), with the halite group having a mean Pt value of 0.02.
There was general agreement between the total porosity data (R2 = 0.85). Correlation was slightly lower for the specific yield data (R2 = 0.80). The slope of the line was relatively high, indicating that GSA Sy values were approximately 35% higher than those reported by DBSA. The adjusted correlation coefficient between RBRC Sy and the drainable porosity at 120 mbar was R2 = 0.80.(Figure 8.1)
|
All the samples tested for Sy fell below the 1:1 line indicating that GSA measured Sy values were typically higher than DBSA measured Sy values. In contrast, while three Pt points were scattered below the 1:1 line, two clastic material samples were plotted on the 1:1 line meaning the measured Pt values were similar for both laboratories.
Figure 8.1, Figure 8.2 and Figure 8.3 compare Pt, Sy, and GSA's drainable porosity (at 120 mbar) versus DBSA's Sy (at 333 mbar) respectively, for the 5 check samples. The lithology classification of the plotted data is indicated by color, with green representing clastic material and purple representing halite. The central blue line represents the 1:1 ratio while the two adjacent blue lines indicate the acceptable 33% threshold. The graphs reveal that there is acceptable variation between the laboratories for samples in the clastic material classification, but unacceptable variation for samples in the halite classification.
Table 8.3 Total porosity results for paired samples using GSA lithologic classification.
|
Total Porosity Statistics |
Clastic material |
Halite |
||
|
RBR |
RBRC |
RBR |
RBRC |
|
|
N |
3 |
2 |
||
|
Avg |
0.26 |
0.24 |
0.11 |
0.02 |
|
StdDev |
0.02 |
0.02 |
0.07 |
0.02 |
|
Average Relative Percent Difference10 |
7% |
129% |
||
Table 8.4 Specific yield results for paired samples using GSA lithological classification.
|
Specific Yield Statistics |
Clastic material |
Halite |
||||
|
RBR @ 120 |
RBR @ 333 |
RBRC |
RBR @ 120 |
RBR @ 333 |
RBRC |
|
|
n |
3 |
2 |
||||
|
Avg |
0.10 |
0.14 |
0.10 |
0.02 |
0.07 |
0.00 |
|
StdDev |
0.05 |
0.04 |
0.03 |
0.00 |
0.01 |
0.00 |
|
Average Relative Percent Difference11 |
2% (120 mbar), 29% (333 mbar) |
123% (120 mbar), 177% (333 mbar) |
||||
10 Calculated as 2*absolute value of (RBR-External Lab)/(RBR+External Lab), expressed as a percentage.
11 Calculated as 2*absolute value of (RBR-External Lab)/(RBR+External Lab), expressed as a percentage.
|
Figure 8.1 Pt comparison for check samples DBSA - GSA
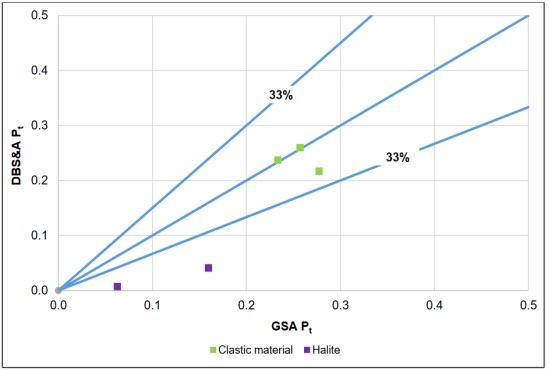
Figure 8.2 Sy comparison for check samples DBSA - GSA
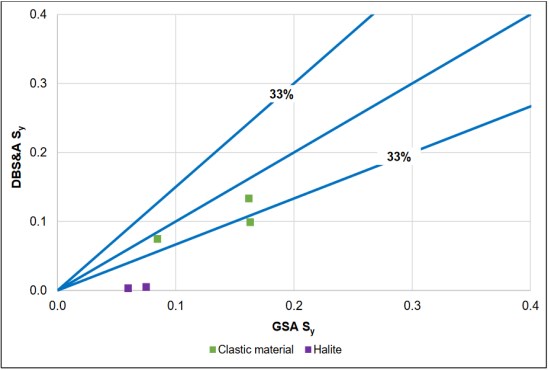
|
Figure 8.3 Sy and RBR comparison for check samples DBSA - GSA
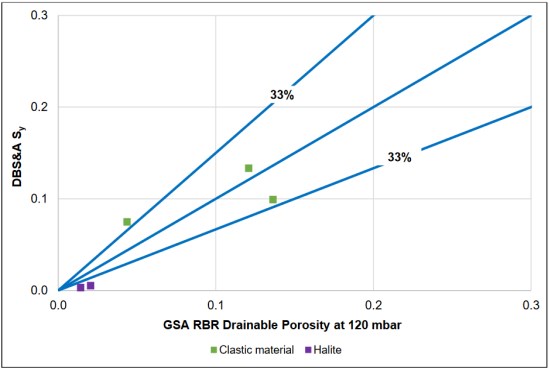
8.3 Brine QA/QC
This section outlines the quality assurance and quality control (QA/QC) procedures implemented for laboratory chemistry analysis of brine samples obtained during drilling and pumping activities. The section is subdivided according to the exploration campaigns carried out by the various companies: Millennial, AMSA, and Centaur. Each QA/QC program involved randomly inserting duplicates, check samples, field blank, and standards, with the following percent of quality control samples for each party: 21% for Millennial, 21% for AMSA and 17% for Centaur. The purpose each QA/QC program was to confirm the accuracy and precision of the analysis, as well as to detect any potential contamination of the samples.
ASANOA was the primary laboratory used by Millennial while SGS was used as the secondary lab for check samples. This arrangement was in place until August 21, 2017 when ASANOA was replaced by SGS as the main laboratory. No registered secondary lab was used for check samples. AMSA used SGS as their primary laboratory throughout the 2021/2 campaign, while ASANOA was used as the main lab for Centaur throughout the 2019/9 campaign. The insertion rates for blanks, check samples, duplicates, and standards for each QA/QC program are detailed in Table 8.5.
|
Table 8.5 Summary of QAQC insertion rates for each campaign
|
Sample Type |
Total N° |
Millennial |
AMSA |
Centaur |
|
Originals |
635 |
452 |
104 |
79 |
|
Duplicates & Checks |
66 |
51 |
9 |
6 |
|
Blanks |
43 |
32 |
6 |
5 |
|
Standards |
56 |
39 |
12 |
5 |
|
Total |
800 |
574 |
131 |
95 |
Accuracy which is the closeness of measurements to the "true" or accepted value was monitored by the random insertion of standards, and the implementation of check samples analyzed by a secondary, independent laboratory. Precision, the ability to consistently reproduce a measurement in similar conditions, was monitored by submitting blind field duplicates to the laboratory, monitoring any variability in the sampling and analytical program. Contamination which is the transference of material from one sample to another was measured by inserting blank samples into the sample stream. By implementing a QA/QC program that monitors these three factors, it is possible to ensure the reliability and accuracy of the laboratory results.
8.3.1 Millennial duplicate brine samples
To ensure the laboratory's precision, duplicate brine samples were submitted to the same facility. Millennial's Phase II and Phase III exploration programs included a total of 51 duplicate samples, some of these also used as check samples. 16 duplicates and their original samples were submitted to ASANOA, while 35 were submitted to SGS. Table 8.6 & Table 8.7 list the main statistics regarding the duplicates versus their original samples for lithium and potassium for each laboratory.
Table 8.6 Statistical analysis of duplicate samples - ASANOA
|
Statistic |
Li (mg/L) |
Duplicate Li (mg/L) |
K (mg/L) |
Duplicate K (mg/L) |
|
Count |
16 |
16 |
16 |
16 |
|
Min |
247.1 |
273.8 |
2783.2 |
3300.5 |
|
Max |
579.4 |
570.7 |
6092.0 |
6367.8 |
|
Mean |
478.5 |
471.8 |
5147.9 |
5047.5 |
|
Std Dev |
92.0 |
85.6 |
926.4 |
817.1 |
|
RPD |
1.4 |
2.0 |
||
|
Table 8.7 Statistical analysis of duplicate samples - SGS
|
Statistic |
Li (mg/L) |
Duplicate Li (mg/L) |
K (mg/L) |
Duplicate K (mg/L) |
|
Count |
35 |
35 |
35 |
35 |
|
Min |
10.0 |
10.0 |
15.0 |
15.0 |
|
Max |
701.0 |
758.0 |
6,660.0 |
7,170.0 |
|
Mean |
415.6 |
416.2 |
4,340.5 |
4,362.1 |
|
Std Dev |
155.4 |
162.1 |
1,574.4 |
1,653.4 |
|
RPD |
0.2 |
0.5 |
||
The assay results for duplicate samples at both ASANOA and SGS laboratories demonstrate a high degree of precision and consistency for key parameters of lithium and potassium. The highest Relative Percent Difference (RPD) is only 2% for ASANOA and 0.5% for SGS. This is significantly lower than the commonly accepted 10% cut-off and suggests that the laboratory's analytical procedures are consistently producing results that are in close agreement with each other.
Max-min plots for each laboratory are displayed from Figure 8.4 to Figure 8.7. These show the maximum versus minimum values for each pair of samples, and the failure line is represented by a hyperbolic function (Y2 = m2X2 + b2), where m is the slope of the asymptote and b the intersection at the y axis. The failure line was calculated based on a 10% relative error allowance.
For each max-min plot, sample pairs (each duplicate and its original) are represented by red circles, while the failure curve is shown in red, and a 45° line is added in green for reference. Additionally, sample pairs that are plotted above the failure line and considered failures are marked in blue circles with an "x" shape in the middle.
The standard threshold for an acceptable number of failures is typically set at 10%. However, given the limited sample size and the observation that there are 2 failures for both lithium and potassium that are marginally beyond the 10% relative error cut-off, a failure rate of 25% is deemed acceptable in this specific instance. If the failures found on the limit of the failure line were deemed to be acceptable, the percentage of failure would change to 6.25% and 12.5% respectively.
Figure 8.6 and Figure 8.7 show the max-min plots for SGS, and duplicate samples are considered acceptable for both lithium and potassium, as the percentage of failures for each element falls below the 10% cut-off. It is noteworthy that three registered failures for lithium are only marginally beyond the 10% threshold, indicating high precision within the SGS laboratory.
|
Figure 8.4 Max-min plot for lithium in duplicates - ASANOA
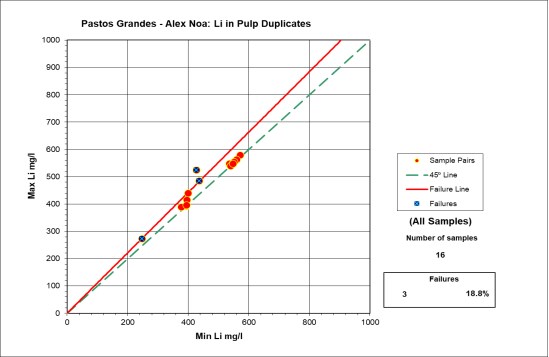
Figure 8.5 Max-min plot for potassium in duplicates - ASANOA
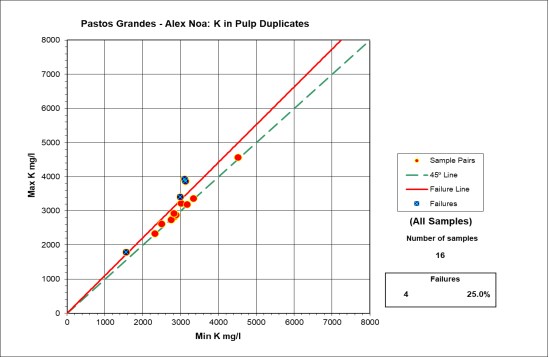
|
Figure 8.6 Max-min plot for lithium in duplicates - SGS
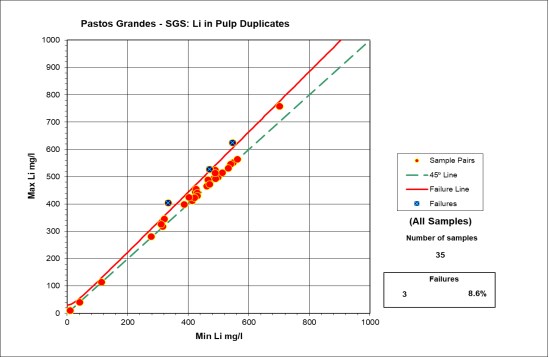
Figure 8.7 Max-min plot for potassium in duplicates - SGS
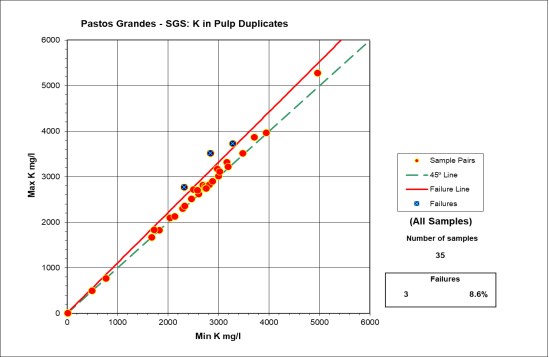
|
8.3.2 Millennial check samples
To test the laboratory's accuracy, samples were randomly selected and analyzed at a secondary and independent laboratory - SGS. It's important to note that this only occurred before August 21, 2017, when SGS replaced ASANOA as the main laboratory. Since that date, no secondary laboratory has been registered for check samples. Millennial's Phase II and III exploration programs included 29 check samples to both primary and secondary labs. The main statistics regarding the check samples for lithium and potassium are listed in Table 8.8.
Table 8.8 Statistical analysis of check samples - ASANOA & SGS
|
Statistic |
ASANOA-Li (mg/L) |
SGS-Li (mg/L) |
ASANOA-K (mg/L) |
SGS-K (mg/L) |
|
Count |
29.0 |
29.0 |
29.0 |
29.0 |
|
Min |
0.5 |
10.0 |
2.5 |
10.0 |
|
Max |
554.4 |
714.0 |
5424.3 |
7740.0 |
|
Mean |
468.8 |
543.9 |
4779.2 |
5916.2 |
|
Std Dev |
104.1 |
123.8 |
970.3 |
1248.8 |
|
RPD |
14.8 |
21.3 |
||
The assay results for check samples between ASANOA and SGS fall within a 20% relative difference for lithium, but slightly over 20% for potassium. A RPD over 20% indicate that there may be an issue with the accuracy of one or both laboratories testing methods, but this cannot be determined solely by the RPD value, and further investigation is needed to identify the cause of the discrepancy. The RPD value for lithium of 14.8% is within the accepted 20% cut-off but still suggests there is some difference between the results obtained by the two labs.
Figure 8.8 and Figure 8.9 present the max-min plots for the check samples of lithium and potassium respectively. Like the duplicate section discussed above, these plots display the maximum versus minimum values for each pair of samples. The failure line is represented by a hyperbolic function (Y2 = m2X2 + b2), where m is the slope of the asymptote and b the intersection at the y axis. The failure line was calculated based on a 20% relative error allowance.
|
Figure 8.8 Max-min plot for lithium in check samples: ASANOA - SGS
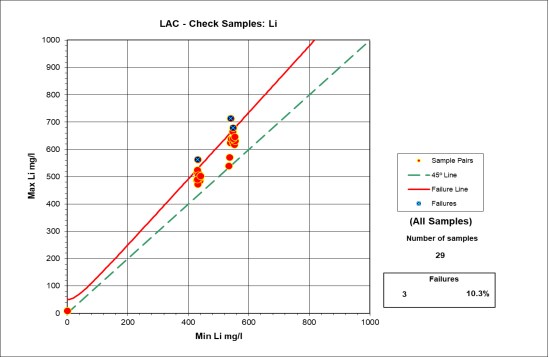
Figure 8.9 Max-min plot for potassium in check samples: ASANOA - SGS
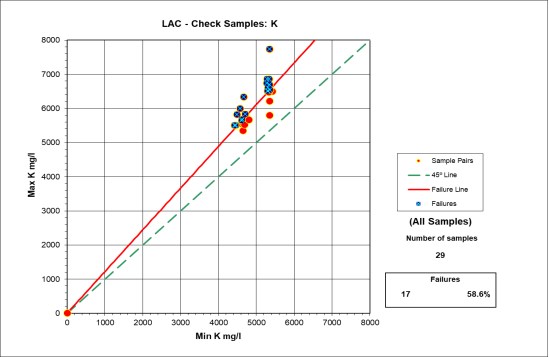
|
For each max-min plot, sample pairs (corresponding duplicates sent to each lab) are represented by red circles, while the failure curve is shown in red, and a 45° line is added in green for reference. Additionally, sample pairs that are plotted above the failure line and considered failures are marked in blue circles with an "x" shape in the middle.
The check samples for both lithium and potassium show a failure rate that exceeds the accepted 10% cut-off. However, one of the three failures for lithium falls only marginally beyond the failure line, which, if considered acceptable, would result in a failure rate of 6.9%. In contrast, the failure rate for potassium is 58.6%, with several samples falling beyond the failure line, indicating an unacceptable level of variation.
8.3.3 Millennial field blanks
To measure potential contamination 32 blank samples consisting of distilled water were inserted into the sample stream and sent to the laboratories for analysis. ASANOA received 10 blanks, while SGS received 22. Neither laboratory detected any lithium in the samples, although traces of potassium were detected by ASANOA. It is important to note that the detected potassium concentrations were below the standard safe limit, which is generally considered to be three times the detection limit.
This data can be visualized with Blank vs Previous graphs where the Y-axis represents the concentrations detected in blanks for each element and the X-axis represents the measured concentration of the same element for the sample assayed just before the blank. Additionally, the graphs feature a regression line for lithium concentrations shown in blue and a red line, representing the safe limit. Figure 8.10 to
Figure 8.13 display these graphs for both lithium and potassium for each lab.
Figure 8.10 Blank vs previous samples for lithium - ASANOA
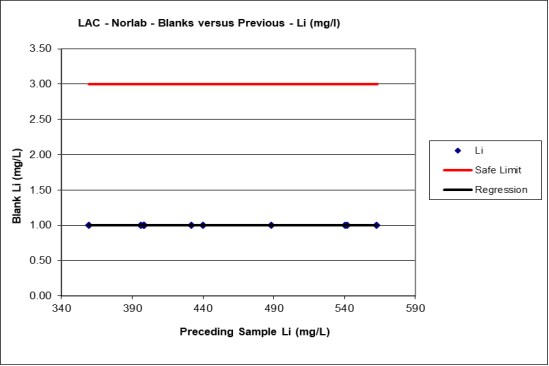
|
Figure 8.11 Blank vs previous samples for potassium - ASANOA
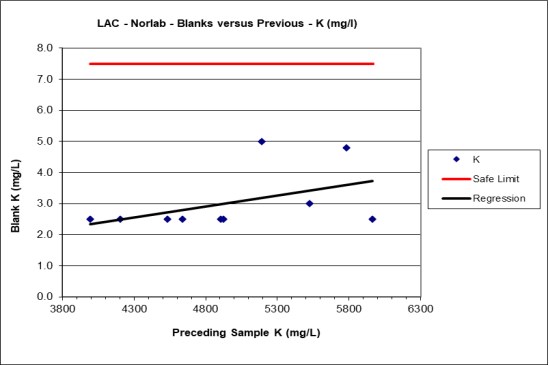
Figure 8.12 Blank vs previous samples for lithium - SGS
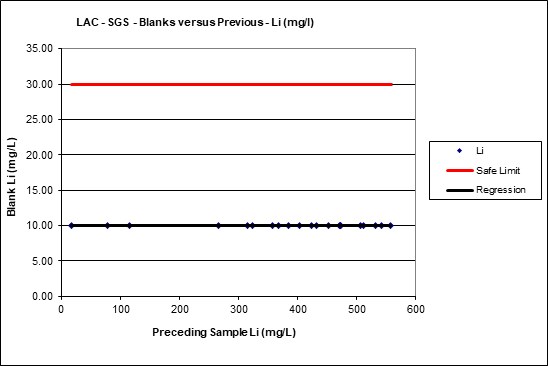
|
Figure 8.13 Blank vs previous samples for potassium - SGS
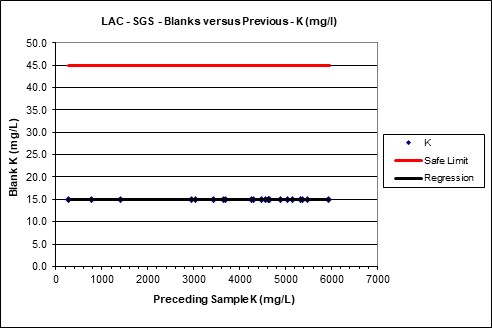
8.3.4 Millennial standard samples
The Millennial sampling program utilized two types of standards. The first standard, 'RR', consisted of a large sample of brine collected from the Salar de Pastos Grandes during testing at well PGPW16-01 with the concentrations being obtained from a round robin style quality control check. 5 RR standards were sent to ASANOA for analysis while 26 samples were sent to SGS. The concentrations (best values) of the standard obtained through the round robin are shown in Table 8.9 .
Table 8.9 Element concentrations (best values) for Standard RR - Millennial
|
Sample |
Li (mg/L) |
Ca (mg/L) |
Mg |
B (mg/L) |
Na (mg/L) |
K (mg/L) |
Density |
EC |
TDS |
|
PGS17153 |
450.2 |
618.8 |
3,033.9 |
774.9 |
107,255.0 |
4,890.0 |
1.2 |
189.0 |
334,800.0 |
The second type of standard, 'INBEMI', consisted of a synthetic solution prepared by the National University of Salta. INBEMI standards were only sent to SGS for analysis, amounting to a total of 6 samples. The concentration values for this standard are reported in Table 8.10.
|
Table 8.10 Element concentrations for Standard INBEMI - Millennial
|
Sample |
Li (mg/L) |
Ca |
Mg (mg/L) |
B (mg/L) |
Na (mg/L) |
K (mg/L) |
SO4 |
Density |
|
PGS17153 |
295.0 |
440.0 |
189.0 |
532.0 |
75,518.0 |
3,188.0 |
189.0 |
1.2 |
Figure 8.14 to Figure 8.19 present a graphical analysis of the assay results for the samples using both the 'RR' and 'INBEMI' standards for both ASANOA and SGS laboratories. All graphs account for a 95% confidence interval of the mean and display the element concentration on the Y-axis and the date of sampling on the X-axis. The reference value (best value) of the element for each standard is shown with a purple line along with a ± 5% acceptable variation represented by a brown and grey line respectively. The actual data is displayed with black outlined squares while the data's moving average is represented in green. The average plus or minus 2 standard deviations are displayed in yellow lines. In general, a total relative bias higher than ±10% is considered unacceptable.
Figure 8.14 Graphical analysis of lithium within 'RR' Standards assayed by ASANOA.
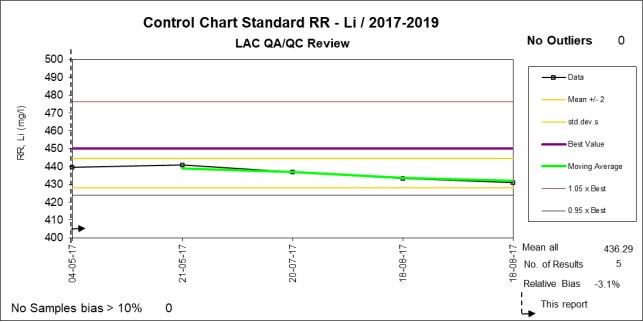
|
Figure 8.15 Graphical analysis of potassium within 'RR' Standards assayed by ASANOA.
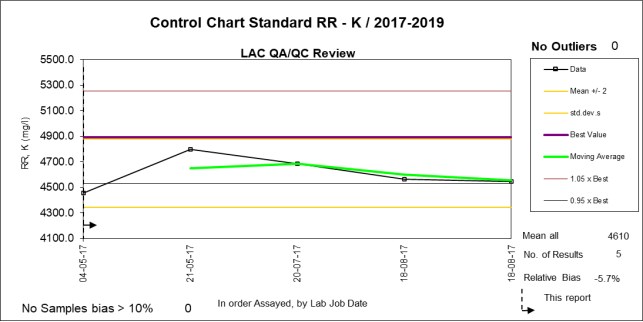
The RR standards analyzed by ASANOA show that none of the lithium nor potassium values fall outside the ± 2 standard deviations from the mean. Additionally, all lithium values fall within the ± 5% range of the reference values while only one potassium value falls outside this range. There were not enough INBEMI standard samples analyzed by ASANOA to conduct a graphical analysis as the moving average does not have enough data.
Notably, a bias check for the assay results revealed a negative bias ranging from -3.1% for Li to -5.7% for potassium indicating that the measured values are consistently lower than the expected or reference values. However, this detected bias is well below the accepted 10% and is not considered to be significant.
The RR standards analyzed by SGS show that 6 out of 26 samples had a bias over the accepted limit of 10% bias lithium with no outliers and a total relative bias of -1.9% which is considered acceptable. Similarly, the potassium samples present 4 out of 26 values over 10% bias with one outlier, and a total relative bias of -3.1%, also deemed acceptable.
Regarding the INBEMI standards analyzed by SGS, 2 out of 6 lithium samples showed a bias over 10% with no outliers and a total relative bias of 0%. For potassium samples show 1 out of a total of 6 had a bias over 10%, with no outliers and a total relative bias of 0%.
In summary, while some individual samples showed a bias beyond the generally accepted 10% limit, the overall bias for both lithium and potassium within the standard samples analyzed by both laboratories is considered acceptable with the highest being -5.7% for lithium within the RR standards assayed by ASANOA.
|
Figure 8.16 Graphical analysis of lithium within 'RR' Standards assayed by SGS.
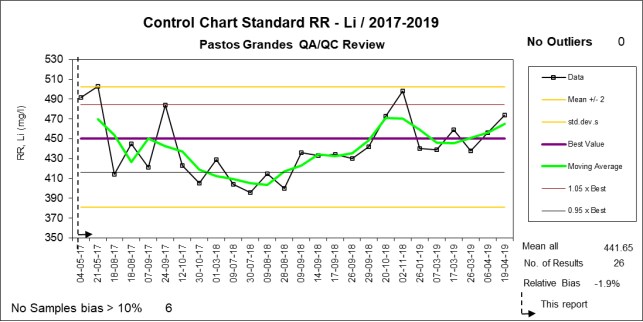
Figure 8.17 Graphical analysis of potassium within 'RR' Standards assayed by SGS.
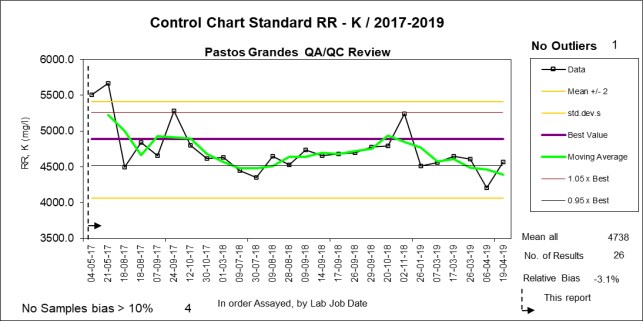
|
Figure 8.18 Graphical analysis of lithium within 'INBEMI' Standards assayed by SGS.
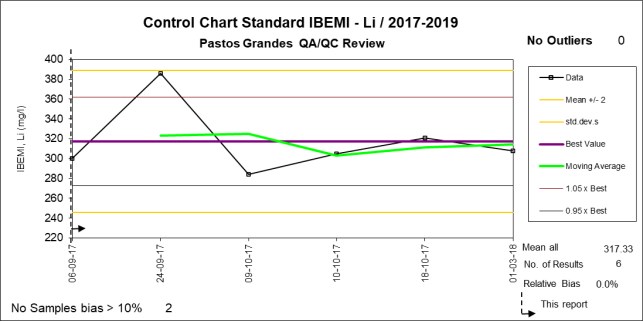
Figure 8.19 Graphical analysis of potassium within 'INBEMI' Standards assayed by SGS.
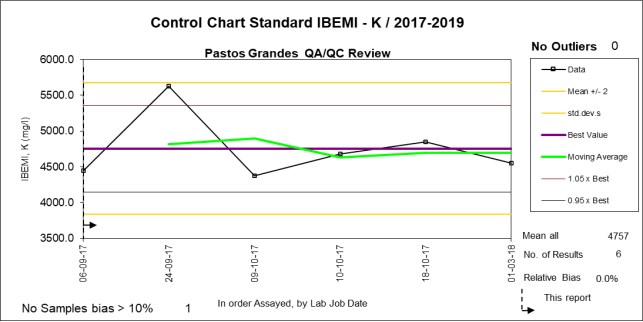
|
8.3.5 AMSA duplicate brine samples
SGS was used as the main assay laboratory by AMSA and to ensure that the precision of the lab was acceptable, a total of 9 duplicate brine samples were submitted. There were no check samples used during the AMSA drilling campaign due to C-19 related issues. Table 8.11 lists the main statistics regarding the duplicates for lithium and potassium.
Table 8.11 Statistical analysis of duplicate samples - SGS
|
Statistic |
Li (mg/L) |
Duplicate Li (mg/L) |
K (mg/L) |
Duplicate K (mg/L) |
|
Count |
9.0 |
9.0 |
9.0 |
9.0 |
|
Min |
33.6 |
31.9 |
197.0 |
177.9 |
|
Max |
658.8 |
657.8 |
6022.9 |
6075.6 |
|
Mean |
419.1 |
413.8 |
3726.1 |
3686.1 |
|
Std Dev |
185.0 |
183.3 |
1788.9 |
1757.4 |
|
RPD |
1.3 |
1.1 |
||
The assay results for duplicate samples at SGS demonstrate a high degree of precision and consistency for key parameters of lithium and potassium. The Relative Percent Difference (RPD) is low, with values of only 1.3% for lithium and 1.1% for potassium. These are significantly lower than the commonly accepted 10% cut-off and suggest that the laboratory's analytical procedures are consistently producing results that are in close agreement with each other.
Figure 8.20 and Figure 8.21 display max-min plots for each laboratory, showing the maximum versus minimum values for each pair of samples and the failure line is represented by a hyperbolic function (![]() , where m is the slope of the asymptote and b the intersection at the y axis. The failure line was calculated based on a 10% relative error allowance.
, where m is the slope of the asymptote and b the intersection at the y axis. The failure line was calculated based on a 10% relative error allowance.
For each max-min plot, sample pairs (each duplicate and its original) are represented by red circles while the failure curve is shown in red and a 45° line is added in green for reference. Additionally, sample pairs that are plotted above the failure line and considered failures are marked in blue circles with an "x" shape in the middle.
There were no failures for neither lithium nor potassium within duplicates analyzed by SGS. The generally accepted threshold for failure rates is 10%, so duplicates are not only considered acceptable, but the lack of failures suggests high precision within the SGS laboratory for the current project.
|
Figure 8.20 Max-min plot for lithium in duplicates - SGS
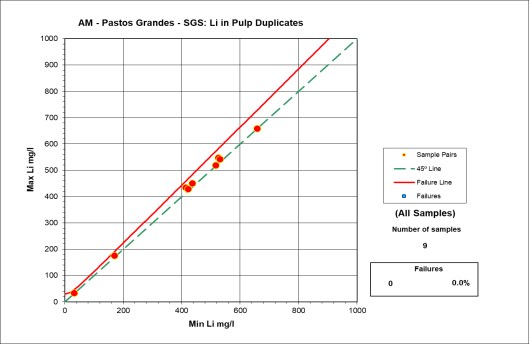
Figure 8.21 Max-min plot for potassium in duplicates - SGS
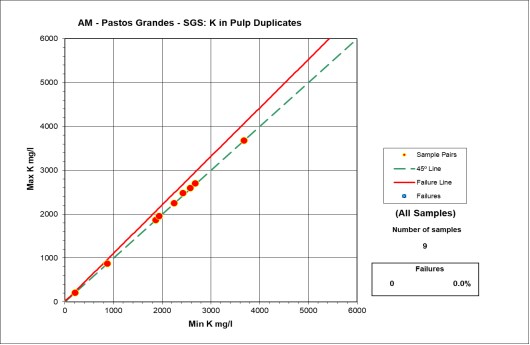
|
8.3.6 AMSA field blanks
To measure potential contamination within the sampling process a total of 6 blank samples consisting of distilled water were inserted into the sample stream and sent to the SGS laboratory for analysis. Neither lithium nor potassium were detected in any samples, therefore all concentrations were below the standard safe limit, which is generally considered to be three times the detection limit.
This data can be visualized with Blank vs Previous graphs, where the Y-axis represents the concentrations detected in blanks for each element, and the X-axis represents the measured concentration of the same element for the sample assayed just before the blank. Additionally, the graphs feature a regression line for lithium concentrations shown in blue and a red line representing the safe limit. Figure 8.22 and Figure 8.23 display these graphs for both lithium and potassium for each lab.
Figure 8.22 Blank vs previous samples for lithium - SGS
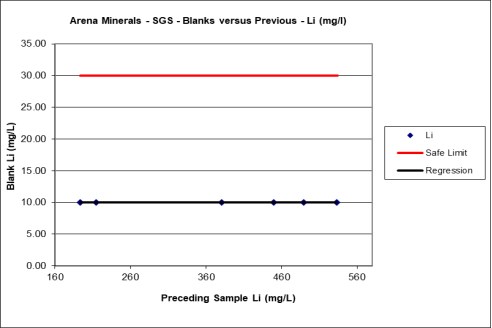
|
Figure 8.23 Blank vs previous samples for potassium - SGS
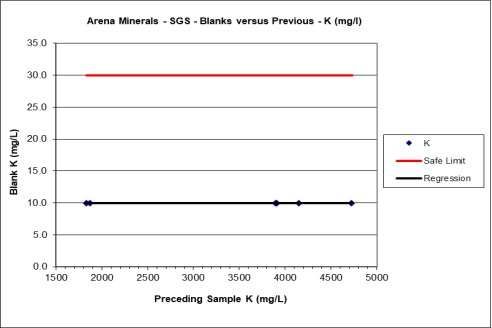
8.3.7 AMSA standard samples
The AMSA sampling program utilized two different standards, both obtained from brine within Salar de Pastos Grandes and named STD-1 and STD-2. Six samples were sent to SGS for analysis for each standard, amounting to a total of 12 standard samples. Their respective concentrations (best values) were obtained from a round robin style quality control check and are shown in Table 8.12.
Table 8.12 Element concentrations (best values) for Standards 1 & 2 - AMSA
|
Sample |
Li (mg/L) |
Mg (mg/L) |
Na (mg/L) |
K (mg/L) |
|
STD-1 |
645.7 |
2,395.5 |
55,435.8 |
6,709.8 |
|
STD-2 |
352.6 |
1,292.0 |
29,825 |
3,682.5 |
Figure 8.24 to Figure 8.27 present a graphical analysis of the assay results for lithium and potassium within the samples using both the STD-1 and STD-2 standards. All graphs account for a 95% confidence interval of the mean and display the element concentration on the Y-axis and the date of sampling on the X-axis. The reference value (best value) of the element for each standard is shown with a purple line, along with a ± 5% variation, represented by a brown and grey line respectively. The actual data is displayed with black outlined squares while the data's moving average is represented in green. Finally, the average ± 2 standard deviations are displayed in yellow lines. In general, a total relative bias higher than ±10% is considered unacceptable.
|
The STD-1 standard has no outliers nor values with a bias higher than 10% for neither lithium nor potassium, which suggests high accuracy and precision. Two lithium values fall outside the ± 5% variation from the reference value which still can be considered acceptable. The total relative bias for lithium is 6.7% and 2.6% for potassium, indicating that the measured values are consistently higher than the reference values, but are both within the acceptable 10% threshold. Finally, no values of lithium nor potassium fall outside the ± 2 standard deviations from the mean.
The STD-2 standard has no outliers but has one value with a bias higher than 10% for both lithium and potassium. Additionally, the same lithium and potassium value falls outside the ± 5% variation from the reference value, although can still be considered acceptable. The total relative bias for lithium is 7.3% and 3.6% for potassium indicating that the measured values are consistently higher than the reference values but are both within the acceptable 10% threshold. Finally, no values of lithium nor potassium fall outside the ± 2 standard deviations from the mean.
In summary, while some individual samples showed a bias beyond the generally accepted 10% limit, the overall bias for both lithium and potassium within the standard samples analyzed by both laboratories is considered acceptable, with the highest being 7.3% for lithium within the STD-2 standard.
Figure 8.24 Graphical analysis of lithium within 'STD-1' Standards assayed by SGS.
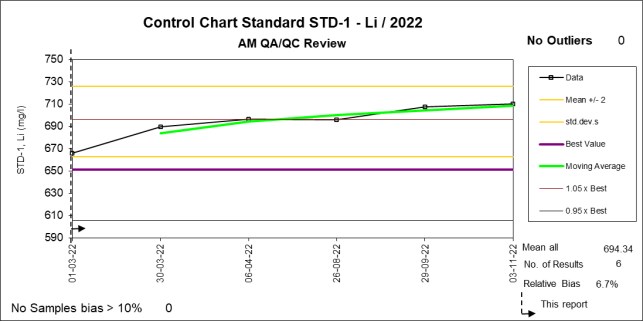
|
Figure 8.25 Graphical analysis of potassium within 'STD-1' Standards assayed by SGS.
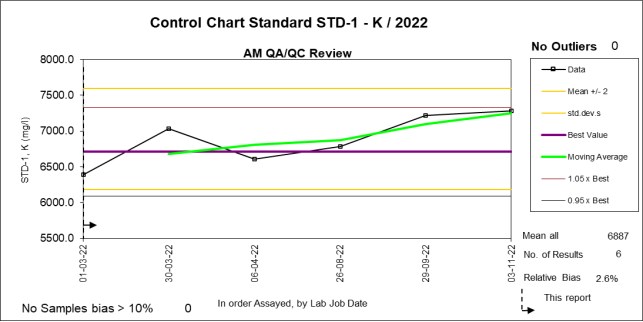
Figure 8.26 Graphical analysis of lithium within 'STD-2' Standards assayed by SGS.
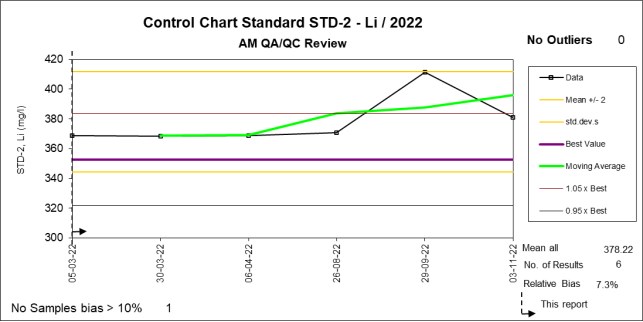
|
Figure 8.27 Graphical analysis of potassium within 'STD-2' Standards assayed by SGS.
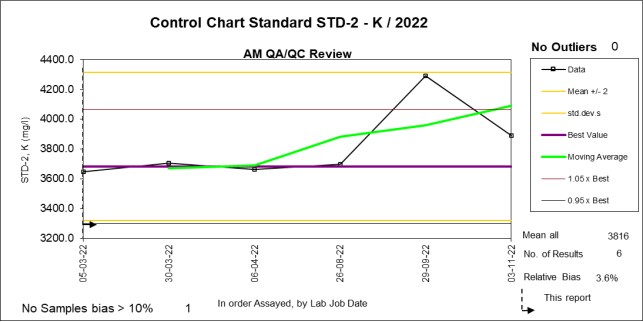
8.3.8 Centaur duplicate brine samples
ASANOA was used as the main laboratory by Centaur and to ensure acceptable precision within the lab, a total of six duplicate brine samples were submitted to the same facility. Table 8.13 lists the main statistics regarding the duplicates for lithium and potassium.
Table 8.13 Statistical analysis of duplicate samples - ASANOA
|
Statistic |
Li (mg/L) |
Duplicate Li (mg/L) |
K (mg/L) |
Duplicate K (mg/L) |
|
Count |
6.0 |
6.0 |
6.0 |
6.0 |
|
Min |
409.6 |
411.5 |
2,894.1 |
2,886.7 |
|
Max |
548.3 |
627.9 |
5,093.1 |
5,213.7 |
|
Mean |
507.3 |
543.2 |
4257.6 |
4617.1 |
|
Std Dev |
52.5 |
65.8 |
880.1 |
824.0 |
|
RPD |
6.8 |
8.1 |
||
The assay results for duplicate samples at ASANOA demonstrate a high degree of precision and consistency for key parameters of lithium and potassium. The Relative Percent Difference (RPD) is below the commonly accepted 10% cut-off for lithium and potassium, with values of 6.8% and 8.1% respectively. This suggests that the laboratory's analytical procedures are consistently producing results that are in close agreement with each other.
|
Figure 8.28 and Figure 8.29 display max-min plots for each laboratory showing the maximum versus minimum values for each pair of samples and the failure line is represented by a hyperbolic function (Y2 = m2X2 + b2), where m is the slope of the asymptote and b the intersection at the y axis. The failure line was calculated based on a 10% relative error allowance.
For each max-min plot, sample pairs (each duplicate and its original) are represented by red circles while the failure curve is shown in red, and a 45° line is added in green for reference. Additionally, sample pairs that are plotted above the failure line and considered failures are marked in blue circles with an "x" shape in the middle.
The max-min plots showed that out of the six duplicates tested, only one failure occurred for lithium while there were no failures for potassium. This translates to a 16.7% failure rate for lithium and 0% for potassium. The generally accepted failure rate threshold is 10% which means that duplicates are considered acceptable for potassium but unacceptable for lithium. However, it's important to note that the sample size taken under Centaur Resources is limited, with only six duplicates assayed. Therefore, in this case, a single failure surpasses the 10% threshold. Taking this into consideration a 16.7% failure rate is deemed to be acceptable.
Figure 8.28 Max-min plot for lithium in duplicates - ASANOA
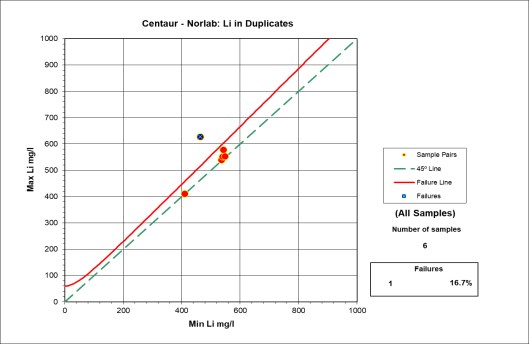
|
Figure 8.29 Max-min plot for potassium in duplicates - ASANOA
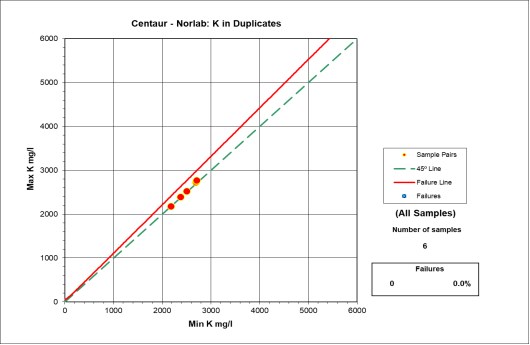
8.3.9 Centaur field blanks
To measure potential contamination a total of five blank samples consisting of distilled water were inserted into the sample stream and sent to ASANOA for analysis. Neither lithium nor potassium were detected in any samples, which means that all concentrations were below the standard safe limit, generally considered to be three times the detection limit.
This data is presented in Blank vs Previous graphs, where the Y-axis represents the concentrations detected in blanks for each element, and the X-axis represents the measured concentration of the same element for the sample assayed just before the blank. Additionally, the graphs feature a regression line for lithium concentrations shown in blue and a red line representing the safe limit. These graphs are displayed for both lithium and potassium in Figure 8.30 and Figure 8.31.
|
Figure 8.30 Blank vs previous samples for lithium - ASANOA
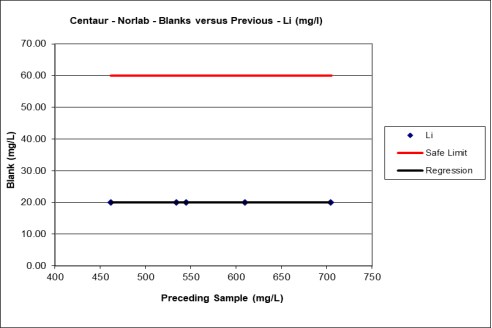
Figure 8.31 Blank vs previous samples for potassium - ASANOA
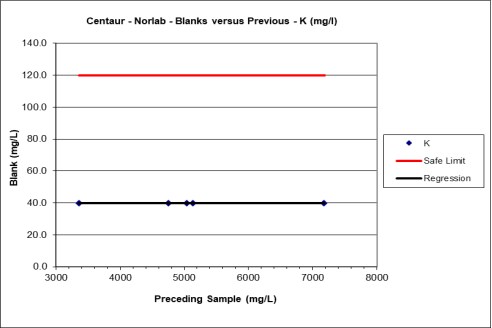
|
8.3.10 Centaur Standard samples
The Centaur sampling program utilized two different standards both obtained from brine within Salar de Pastos Grandes with their respective concentrations obtained from a round robin style quality control check. These standards were named STD-A and STD-B, and three samples of the former were sent to the lab for analysis while only 2 of the latter were assayed. The concentrations (best values) for each standard obtained through the round robin are shown in Table 8.14.
Table 8.14 Element concentrations (best values) for Standards A & B - Centaur
|
Sample |
Li (mg/L) |
Mg (mg/L) |
Na (mg/L) |
K (mg/L) |
|
STD-A |
707.0 |
4,641.9 |
111,699.2 |
7,041.9 |
|
STD-B |
370.5 |
2,444.3 |
58,074.0 |
3,543.1 |
Figure 8.32 Graphical analysis of lithium within 'STD-A' Standards assayed by ASANOA.
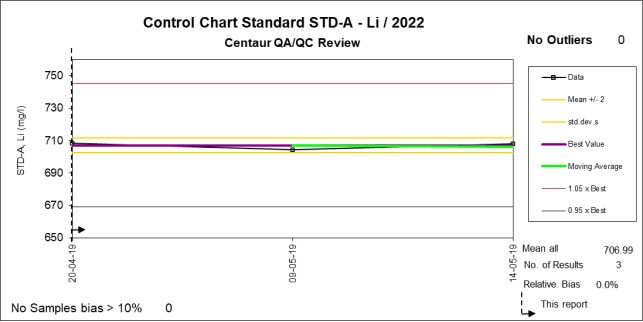
|
Figure 8.33 Graphical analysis of potassium within 'STD-A' Standards assayed by ASANOA.
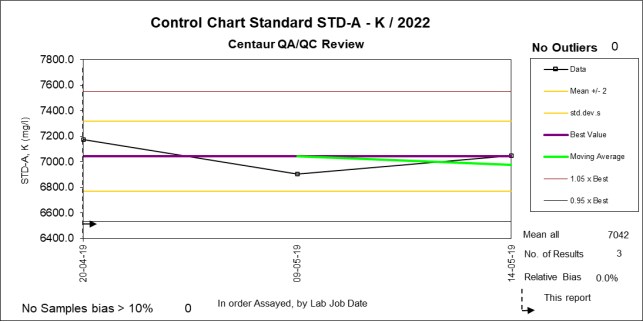
Graphical analysis of the assay results for lithium and potassium for the STD-A standards can be seen in Figure 8.32 and Figure 8.33 while graphical analysis for the STD-B standard was not possible due to a lack of samples. Both graphs account for a 95% confidence interval of the mean and display the element concentration on the Y-axis and the date of sampling on the X-axis. The reference value (best value) of the element for each standard is represented with a purple line, along with a ± 5% variation, represented by a brown and grey line respectively. The actual data is displayed with black outlined squares while the data's moving average is represented in green. Finally, the average ± 2 standard deviations are displayed in yellow lines. In general, a total relative bias higher than ±10% is considered unacceptable.
The STD-A standard has no outliers nor values with a bias higher than 10% for neither lithium nor potassium, which suggests high accuracy and precision. Similarly, no lithium nor potassium values fall outside the ± 5% variation from the reference value, which is also a good indicator of accuracy and precision. The total relative bias for lithium and potassium is 0% indicating that the measured values are in accordance with the reference values. No lithium nor potassium values fall outside the ± 2 standard deviations from the mean.
|
9 DATA VERIFICATION
The author was involved with the planning, execution, and oversight of the 2021-2022 AMSA drilling and testing program in Salar de Pastos Grandes. The author was responsible for developing drilling and sampling methodologies and the implementation of field sampling protocols. The author spent a significant amount of time in the field overlooking the implementation and execution of drilling, testing, and sampling protocols.
The author was responsible for the oversight and analysis of the QA/QC programs related to brine sampling and laboratory brine chemistry analysis as well as the laboratory porosity analysis. A significant amount of QA/QC protocols were implemented for the brine chemistry and drainable porosity analysis programs that allowed continuous verification of the accuracy and reliability of the results obtained. As described in Section 8 no issues were found with the results of the brine and porosity laboratory analysis.
It is the opinion of the author that the information developed and used for the brine resource estimate herein is adequate, accurate and reliable.
|
10 MINERAL PROCESSING AND METALLURGICAL TESTING
No mineral processing or metallurgical testing studies have been prepared for this Resource Estimate.
|
11 BRINE RESOURCE ESTIMATES
11.1 Overview
The essential elements of a brine resource determination for a salar are:
• Definition of the aquifer geometry,
• Determination of the drainable porosity or specific yield (Sy) of the hydrogeological units in the salar
• Determination of the concentration of the elements of interest.
Resources may be defined as the product of the first three parameters. The use of specific yield allows the direct comparison of brine resources from the widest range of environments.
Aquifer geometry is a function of the shape of the aquifer, the internal structure, and the boundary conditions (brine / freshwater interface). Aquifer geometry and boundary conditions can be established by drilling and geophysical methods. Hydrogeological analyses are required to establish catchment characteristics such as ground and surface water inflows, evaporation rates, water chemistry and other factors potentially affecting the brine reservoir volume and composition in-situ. Drilling is required to obtain samples to estimate the salar lithology, specific yield, and grade variations both laterally and vertically.
11.2 Resource model domain and aquifer geometry
The resource model domain is constrained by the following factors:
• Upper Boundary: The upper boundary of the model is determined by the highest elevation samples within the dataset, and/ or the phreatic brine level.
• Lateral Extent: The lateral extent of the resource model covers an area of 56 km2 confined within the boundaries of the PGSA mining claims in the Salar. The Arena Minerals mining claims are not included in this mineral resource estimate. Additionally, the extent can be restricted in some cases by the contact between the Quaternary basin and the underlying basement rock.
• Lower Boundary: The lower boundary of the model domain is set to coincide with the basement from the geological model or the total depth of 650 m when the basement is not present.
11.3 Specific Yield
The specific yield values were derived from 76 valid drainable porosity analyses of undisturbed samples. In comparison to lithium concentration data, which exhibits spatial correlation due to the geological processes that influence its distribution, drainable porosity data shows no such correlation. This is primarily because Sy values are highly dependent on the lithology of the project area, resulting in considerable stochastic variability. After conducting exploratory data analysis, it was concluded that assigning representative values to each geological unit would be more accurate than using interpolation methods like kriging.
|
The variability is shown in Table 11.1 which displays the range of confidence intervals and the standard error for each unit. This underscores the necessity for additional drilling and sample collection to reduce uncertainty and improve understanding of drainable porosity values within these geological units.
Table 11.1 Summary statistics of drainable porosity for geological units
|
Unit |
2019 |
2019 |
2023 |
2023 |
Confidence |
Confidence |
Variance |
Std. |
|
Blanca Lila |
1 |
0.5% |
1 |
0.5% |
|
|
|
|
|
Alluvium |
17 |
14.2% |
27 |
13.9% |
11.0% |
16.7% |
0.5% |
1.4% |
|
Saline Lacustrine |
2 |
5.6% |
20 |
4.1% |
2.9% |
5.4% |
0.1% |
0.6% |
|
Central Clastics |
0 |
|
3 |
5.4% |
-4.1% |
14.9% |
0.1% |
2.2% |
|
Base Gravels |
25 |
12.5% |
25 |
12.5% |
9.0% |
16.1% |
0.7% |
1.7% |
|
All Grps |
45 |
12.6% |
76 |
10.1% |
8.6% |
12.2% |
0.6% |
0.9% |
11.4 Brine Concentrations
The distributions of lithium and potassium concentrations in the model domain are based on a total of 501 brine analyses (not including QA/QC analyses) Table 11.2 shows a summary of the brine chemical composition.
Table 11.2 Summary of brine chemistry composition
|
|
B |
Ca |
Cl |
Li |
Mg |
K |
Na |
SO4 |
Density |
|
Units |
mg/L |
mg/L |
mg/L |
mg/L |
mg/L |
mg/L |
mg/L |
mg/L |
g/cm3 |
|
Maximum |
938.00 |
1,707 |
196,869 |
701.00 |
5,130 |
6,660 |
130,032 |
13,998 |
1.22 |
|
Average |
557.62 |
821 |
169,838 |
391.76 |
2,257 |
3,733 |
102,381 |
7,547 |
1.19 |
|
Minimum |
20.20 |
11.00 |
116.00 |
8.75 |
23.20 |
18.00 |
196.00 |
12.00 |
1.00 |
11.5 Resource category
S-K 1300 Definition Standards adopted December 26, 2018 were applied for the mineral resource categorization:
Inferred Mineral Resource
An Inferred Mineral Resource is that part of a mineral resource for which quantity and grade or quality are estimated on the basis of limited geological evidence and sampling. The level of geological uncertainty associated with an inferred mineral resource is too high to apply relevant technical and economic factors likely to influence the prospects of economic extraction in a manner useful for evaluation of economic viability. Because an inferred mineral resource has the lowest level of geological confidence of all mineral resources, which prevents the application of the modifying factors in a manner useful for evaluation of economic viability, an inferred mineral resource may not be considered when assessing the economic viability of a mining project, and may not be converted to a mineral reserve.
|
Indicated Mineral Resource
An Indicated Mineral Resource is that part of a mineral resource for which quantity and grade or quality are estimated on the basis of adequate geological evidence and sampling. The level of geological certainty associated with an indicated mineral resource is sufficient to allow a qualified person to apply modifying factors in sufficient detail to support mine planning and evaluation of the economic viability of the deposit. Because an indicated mineral resource has a lower level of confidence than the level of confidence of a measured mineral resource, an indicated mineral resource may only be converted to a probable mineral reserve.
Measured Mineral Resource
A Measured Mineral Resource is that part of a mineral resource for which quantity and grade or quality are estimated on the basis of conclusive geological evidence and sampling. The level of geological certainty associated with a measured mineral resource is sufficient to allow a qualified person to apply modifying factors, as defined in this section, in sufficient detail to support detailed mine planning and final evaluation of the economic viability of the deposit. Because a measured mineral resource has a higher level of confidence than the level of confidence of either an indicated mineral resource or an inferred mineral resource, a measured mineral resource may be converted to a proven mineral reserve or to a probable mineral reserve.
The resource classification method used is based on the use of distinct domains, including the unsaturated zone, northern transitional zone, eastern transitional zone, upper zone, central brine zone, lower zone, and central clastic zone.
● The unsaturated zone contains no resources.
● The northern and eastern transitional zones, which show low lithium concentrations and represent the transition between brine and freshwater, were classified as indicated resources. A drill hole spacing of less than 3 km and vertical sampling of about 20 m were used.
● The upper zone has a very limited number of samples, with unsampled intervals of up to 200 m. Because of the lack of systematic sampling, this zone is therefore classified as an inferred resource. It is also worth mentioning that several drillholes have unsampled intervals of up to 300 m.
● The central brine zone has the highest sample density and best characterization and was classified as a measured resource with a borehole spacing of less than 2 km and a vertical sampling of about 20 m.
● The lower zone was incorporated due to lithium samples showing a tendency to improve with depth and was classified as an inferred resource to a depth of 700 m or 3,096 masl.
● The central clastic zone was reclassified to an indicated resource within the central brine zone due to the uncertainty of its drainable porosity values.
The different zones used in this classification are schematically illustrated in Figure 11.1 and Figure 11.2.
|
Figure 11.1 Schematic section illustrating resource categories based on data density for different zones
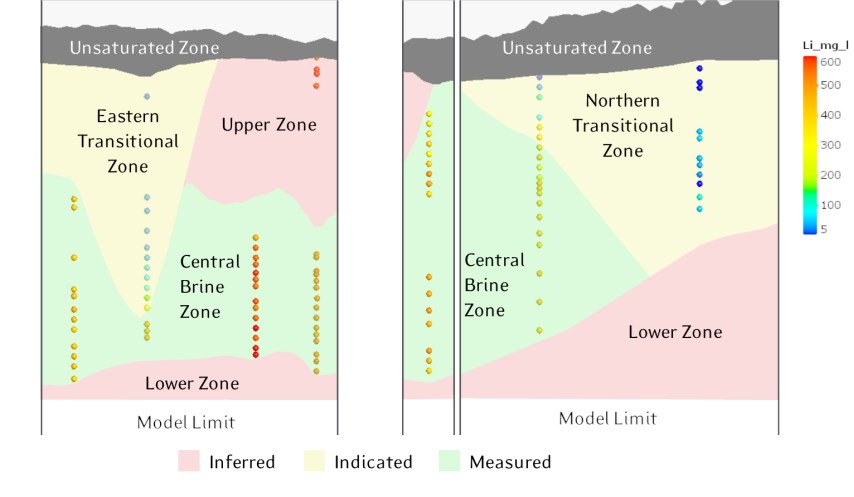
|
Figure 11.2 Spatial distribution of resource classification by depth
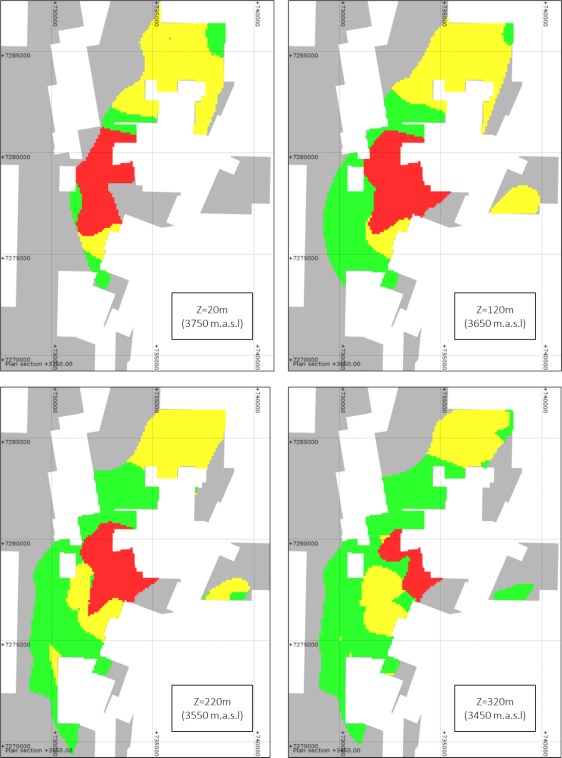
|
11.6 Resource model methodology and construction
The resource estimation for the Project was developed using the Stanford Geostatistical Modeling Software (SGeMS). Brine concentrations showed two clear groups of data spatially distributed in two regions: region I and II. Region I is associated with high concentrations of potassium and lithium, whereas Region II is associated with low concentrations of potassium and lithium. Region II is mostly located close to the boundaries of the reservoir, where brine is affected by mixing with fresh water. The delineation of these two regions was estimated through geostatical indicator kriging. For this the following indicator function is defined:
![]()
The conditional expected value of the indicator function is exactly the probability that the potassium concentration is larger or equal to 2,000 mg/L (or the probability that region I prevails at that location). Given the high correlation between potassium and lithium concentrations (coefficient of correlation of 0.93), one can delineate the probability that region I prevails by considering either potassium or lithium concentrations. That is because the ratio between potassium and lithium concentrations is about 10, similar results will be obtained by considering a lithium cut-off of 200 mg/L. Note that the lithium histogram shows two groups of data with a cut-off of 200 mg/L. By definition, the probability of occurrence of a given region is a continuous variable ranging between 0 and 1. In order to separate the data into regions a cut-off in the estimate of the indicator variable must be developed. Ritzi et al. (1994) has suggested to define the boundary between regions by the isoline Prob{C≥2000} = p, where p is estimated as either the global mean of the indicator values or the empirical relative volumetric fraction of the region. In this case, both conditions yield similar results and p=0.8 was selected which is close to the data volumetric fraction. Once the two regions were defined kriging was applied within each region. Kriging interpolation within each specific region is sequentially performed using the semivariogram model and the closest primary data samples within the region. The following steps were carried out to calculate the lithium and potassium resources.
• Definition of the block model (15,985,800 blocks) and block size (x=100 m, y=100 m, z=20 m). The block size has been chosen for being representative of the geological model.
• Delineate regions of high and low brine concentrations based on geostatistical indicator kriging. Spatial definition of region I with potassium concentrations larger or equal to 2,000 mg/L and region II with potassium concentrations smaller than 2,000 mg/L.
• For each region, generation of histograms, probability plots and box plots for the Exploratory Data Analysis (EDA) for lithium and potassium. No outlier restrictions were applied, as distributions of the different elements do not show anomalously high values. The experimental variograms were calculated with their respective variogram models for lithium and potassium in three orthogonal directions. Variography revealed that the variogram model is axisymmetric with respect to the z coordinate direction; the variogram model is isotropic in the horizontal direction and anisotropic in the vertical.
|
• For each region, lithium and potassium concentrations were interpolated for each block in mg/L using ordinary kriging with the variogram models shown in Figure 11.6 and Figure 11.7.
• Validation using a series of checks including comparison of univariate statistics for global estimation bias, visual inspection against samples on plans and sections in the north, south and vertical directions to detect any spatial bias.
• Calculation of total resources using the average drainable porosity value for each geological unit, based on the boreholes data and results of the laboratory drainable porosity analysis as shown in Table 11.1. The total resources are shown in Table 11.6.
11.6.1 Univariate statistical description
The univariate statistical description of lithium and potassium concentrations are based on histograms, probability plots and box plots. Table 11.3 presents a summary of the univariate statistics of potassium and lithium. As described in the methodology, these statistics contain the information of all geological units. The mean concentration of potassium is about 10 times that of lithium. Both exhibit a similar high degree of variability with coefficients of variation of 2.46 and 2.48 for the potassium and lithium, respectively. The concentrations of potassium range between 18 mg/L and 6,660 mg/L, and the concentrations of lithium range between 9 mg/L and 701 mg/L.
Table 11.3 Summary of univariate statistics of Li and K
|
|
Li mg/L |
K mg/L |
|
Valid N |
501 |
501 |
|
Mean |
392 |
3,733 |
|
Minimum |
9 |
18 |
|
Maximum |
701 |
6,660 |
|
Variance |
26,149 |
2,503,050 |
|
Upper Quartile |
519 |
5070 |
|
Median |
437.8 |
4,471.8 |
|
Lower Quartile |
357 |
3,180 |
|
CV |
2.46 |
2.48 |
Figure 11.3 shows the lithium and potassium distribution and their cumulative distribution. Results show that the data do not strictly follow a normal distribution and that the distribution is markedly bimodal. This suggests two different groups of data that should be treated separately: one defined by potassium concentrations larger or equal to 2,000 mg/L (region I), and another associated with potassium concentrations smaller than 2,000 mg/L (region II). From a physical perspective, the first group is located within and nearby the nucleus of the Salar, whereas the second group is close to the boundaries of the resource. In the latter, brine concentrations are relatively low, reflecting the mixing with freshwater at the salar boundaries. Once data is separated into groups, the corresponding histograms of the potassium and lithium concentrations follow a Gaussian shape (see Figure 11.4). This gives confidence in the kriging estimate of the concentrations, which is known to be the best linear and nonlinear estimator of the concentrations when the data follows a multivariate normal distribution.
|
Figure 11.3 lithium and potassium histograms and cumulative distributions
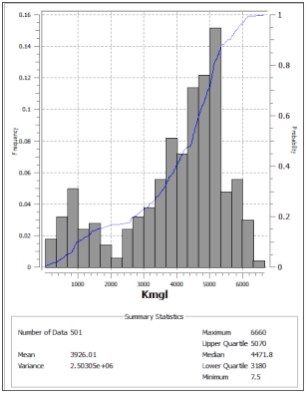
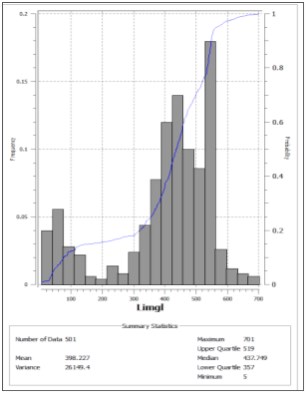
|
Figure 11.4 Lithium and potassium histograms and cumulative distributions for region I
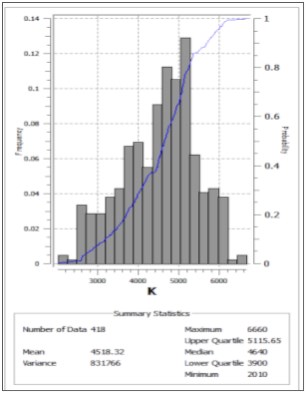
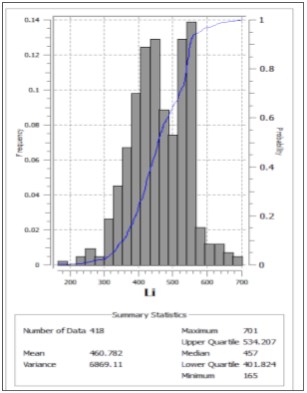
11.6.2 Variography
The spatial correlation for the indicator variable I(x), defined previously to delineate regions of different concentration groups, was reviewed using experimental variograms with the parameters shown in Table 8.4. Variogram models are axisymmetric with a simple exponential structure characterized by a horizontal range ah and a vertical range az. Consequently, the spatial variability was modelled using two experimental directions. The horizontal range is ah=10,200 m and the vertical range is az=1,836 m. The anisotropy ratio is about ah/az=5, which suggest that the indicator variables is only slightly stratified. The variogram ranges obtained for the indicator variable are substantially larger (double) than those obtained for the potassium and lithium concentrations, meaning that the indicator variables are more continuous in space compared with concentrations. The experimental variograms for the indicator variable with their respective variogram models are shown in Figure 11.5 and Figure 11.6.
![]()
|
Table 11.4 Parameters for the calculation of the experimental variograms of the indicator variable
|
Variogram Parameters |
Tolerance |
||||
|
Lag (m) |
Max. No. Of Lags |
Azimuth (°) |
Dip (°) |
Bandwidth (m) |
Angular (°) |
|
600 |
50 |
70 |
0 |
50 |
45 |
|
600 |
50 |
70 |
0 |
50 |
45 |
|
18 |
50 |
0 |
90 |
100 |
45 |
The spatial correlation for the lithium and potassium concentrations for each region were reviewed using experimental variograms with the parameters shown in Table 11.5. Variogram models are axisymmetric with multiple structures characterized by a horizontal range ah and a vertical range az. Consequently, for each region, the spatial variability was modelled using two experimental directions. Lithium and potassium concentrations are expressed in mg/l. The variograms are expressed in mg/l squared. In general, a good correlation was found between the sample concentrations of lithium and potassium in all regions. Consequently, results show that the lithium and potassium concentrations can be represented by the combination of similar fundamental structures.
Table 11.5 Parameters for the calculation of the experimental variograms of the K and Li concentrations
|
Variogram Parameters |
Tolerance |
||||
|
Lag (m) |
Max. No. Of Lags |
Azimuth (°) |
Dip (°) |
Bandwidth (m) |
Angular (°) |
|
400 |
50 |
70 |
0 |
50 |
45 |
|
400 |
50 |
70 |
0 |
50 |
45 |
|
18 |
50 |
0 |
90 |
100 |
45 |
The region I of the formation characterized by higher potassium concentrations not influenced by fresh water were represented by the sum of two exponential variograms with a different vertical range. In this case, two structures are needed to represent the vertical variability of the concentrations. The first exponential variogram describes the short-scale spatial continuity with a vertical range of az=100 m, which contrasts with a range of ah=4,700 m in the horizontal direction. This means that the ratio of anisotropy is ah/az=47, which expresses that the geological system is highly stratified as typically observed in most sedimentary formations. The second structure reflects the appearance of more variability in the vertical direction at larger scales.
|
Variogram models for region I:
![]()
![]()
Variogram models for region II:
![]()
![]()
The region II of the formation characterized by lower potassium concentrations was represented by an anisotropic axisymmetric spherical variogram. The range in the vertical direction is 180 m for potassium and 400 m for lithium which seems to be more continuous in this direction. In the horizontal direction, the range is 5,100 m and 5,700 m for potassium and lithium, respectively. The anisotropy ratio ah/az ranges between 18 and 28, meaning that potassium and lithium is slightly less stratified in region I compared to region II. The variogram contributions are like region I but the vertical variogram model does not reflect multiple structures.
The experimental variograms with their respective variogram models are shown in Figure 11.5 and Figure 11.6.
The lithium and potassium concentrations were estimated within each specific region using the corresponding variogram models and the closest concentration data samples within the region. The interpolation methodology for estimating lithium and potassium was Ordinary Kriging (OK). The estimation was carried out separately for each parameter using their respective variogram models as appropriate.
|
Figure 11.5 Experimental variogram and variogram model for the indicator variable
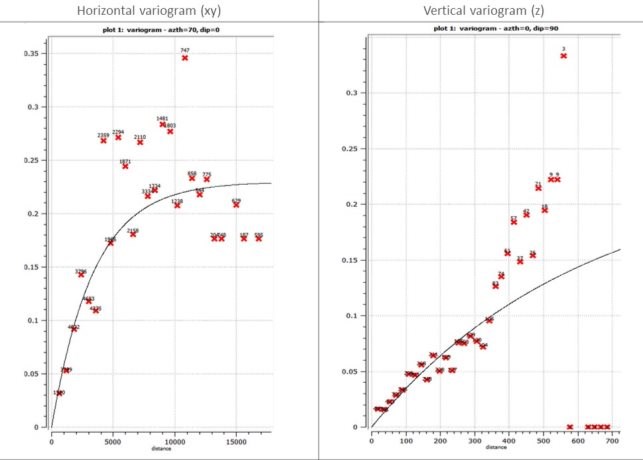
|
Figure 11.6 Experimental variogram and variogram model for potassium and lithium in region I
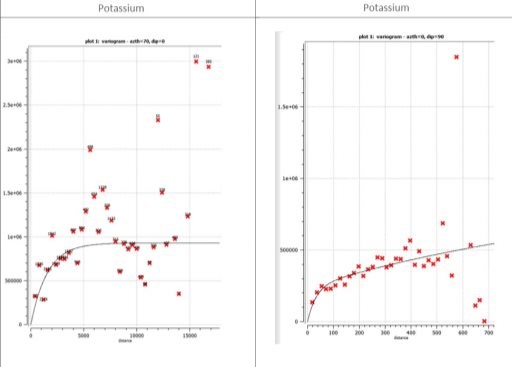
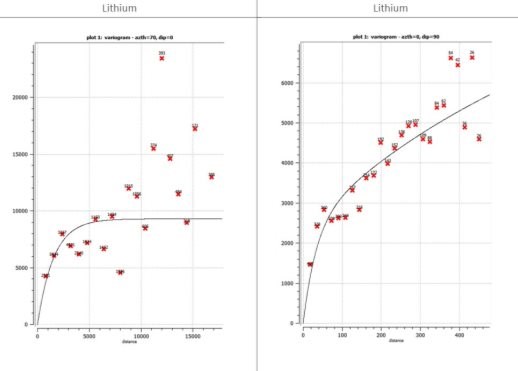
|
11.7 Grade estimate
The grade estimates of lithium and potassium in each block inside the model were calculated applying the following operation:

Where: i is the indice of the block, going from 1 to 15,985,800
Ri: Grade value to be assigned (g/m3)
Ci: Concentration value assigned from the estimation (mg/L)
Syi: Specific yield value assigned from the estimation (%)
Figure 11.7 through Figure 11.9 shows N-S, W-E, and SW-NE sections through the resource model showing lithium grade distributions in g/m3. The resource classification was made within the limits of the block model.
|
Figure 11.7 N-S section through the resource model showing the lithium grade distribution
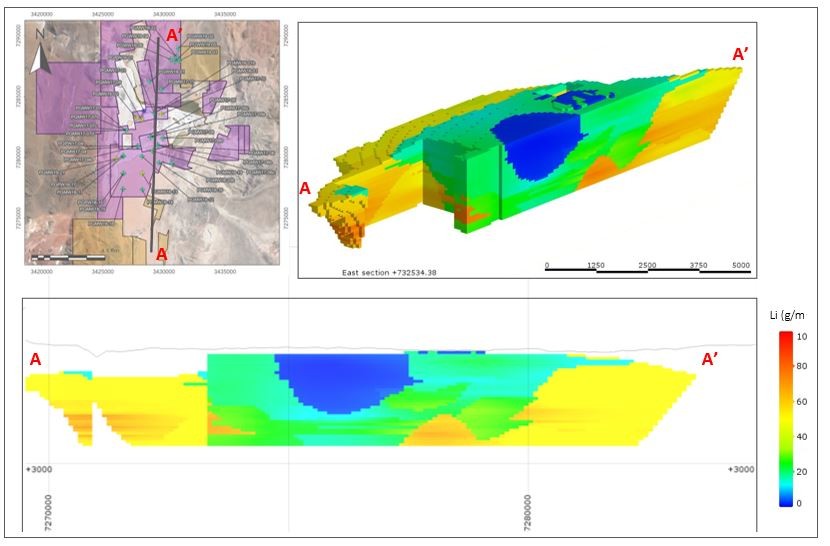
|
Figure 11.8 W-E section through the resource model showing the lithium grade distribution
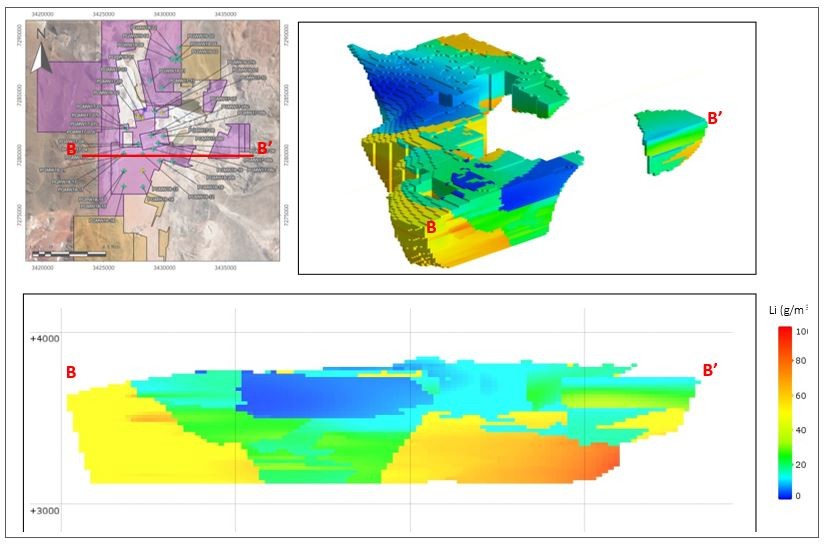
|
Figure 11.9 SW-NE section through the resource model showing the lithium grade distribution
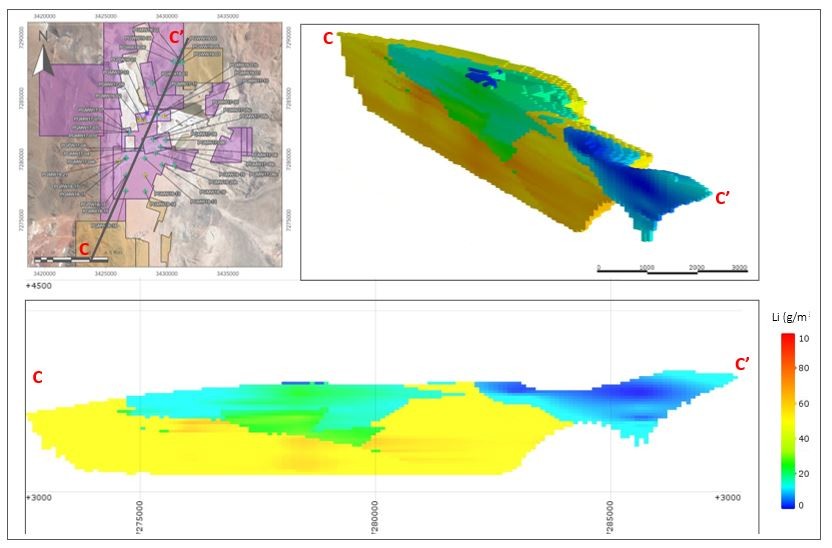
|
11.8 Resource estimate
The resource estimate was prepared in accordance with the requirements of S-K §229.1300 and uses best practice methods specific to brine resources, including a reliance on core drilling and sampling methods that yield depth-specific chemistry and drainable porosity measurements. This resource estimate was previously reported on April 30, 2023 without the application of a cut-off lithium concentration. On request of LAR, a 200 mg/l lithium concentration cut-off was applied to the resource base which results in a 52% decrease in Indicated Resources and an 1% decrease in Inferred resources from those reported previously without the cut-off grade. Figure 11.10 provides the cut-off grade volume curve applied to the Measured and Indicated resources. Table 11.6 summarizes the lithium and potassium brine resources with the 200 mg/l lithium concentration cut-off.
Figure 11.10 Brine volume cut-off grade for Measured and Indicated Resources
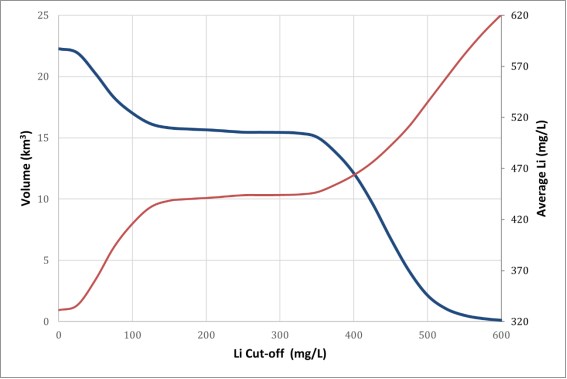
|
Table 11.6 Mineral Resources of the PGSA mining claims of Pastos Grandes Project - Dated December 31, 2024
| Measured (M) | Indicated (I) | M+I | Inferred (I) | |||||
| Li | K | Li | K | Li | K | Li | K | |
| Aquifer volume (km3) | 13.45 | 2.15 | 15.60 | 5.22 | ||||
| Mean specific yield (Sy) | 0.11 | 0.06 | 0.10 | 0.08 | ||||
| Brine volume (km3) | 1.5 | 0.1 | 1.6 | 0.4 | ||||
| Mean grade (g/m3) | 49 | 495 | 26 | 260 | 46 | 462 | 39 | 403 |
| Concentration (mg/l) | 438 | 4419 | 457 | 4,655 | 441 | 4,452 | 460 | 4,794 |
| Resource (tonnes) | 662,000 | 6,660,000 | 57,000 | 570,000 | 719,000 | 7,230,000 | 205,000 | 2,100,000 |
| LAR 85.1% interest (tonnes) | 563,000 | 5,668,000 | 49,000 | 485,000 | 612,000 | 6,153,000 | 174,000 | 1,787,000 |
Notes to the resource estimate (Table 11.6):
1. S-K 1300 definitions were followed for Mineral Resources.
2. The Qualified Person for this Mineral Resource estimate is Frederik Reidel, CPG
3. No Mineral Reserves have been estimated for this updated Mineral Resource Estimate.
4. The Mineral Resource Estimate is reported as lithium contained in brine in-situ.
5. The Mineral Resource Estimate is not a Mineral Reserve Estimate and does not have demonstrated economic viability. There is no certainty that all or any part of the Mineral Resources will be converted to Mineral Reserves. Inferred Resources have great uncertainty as to their existence and whether they can be mined economically.
6. A cut-off grade of 200 mg/l has been applied to the M+I+I resources estimates.
The cutoff grade is based on the various inputs and the formula blow:

Where:
Total Capital Expenditure= USS 1,781 million
Total Operating Expenditure = USS 6,020 million
Cost of Capital = USS 178 million (10 percent of Total Capital)
Total Brine Extracted = 628 Mm3
Conversion from Li to Li2CO3= 5.323
Projected LCE Price = USS 20,00 per metric ton of LCE
Export Duties =4.5%
Royalties= 3.0%
Calculated Recovery= 65%
Resulting in a calculated cut-off grade of 200 mg/l.
Factors that may affect the Brine Resource estimate include: locations of aquifer boundaries; lateral continuity of key aquifer zones; presence of fresh and brackish water which have the potential to dilute the brine in the wellfield area; the uniformity of aquifer parameters within specific aquifer units; commodity price assumptions; changes to hydrogeological, metallurgical recovery, and extraction assumptions; density assignments; and input factors used to assess reasonable prospects for eventual economic extraction. Currently, Mr. F. Reidel (the QP), does not know any environmental, legal, title, taxation, socio-economic, marketing, political, or other factors that would materially affect the current Resource estimate.
7. Numbers may not add due to rounding averaging.
8. The effective date is December 31, 2024.
|
Table 11.7 shows the mineral resources of the Pastos Grandes Project expressed as lithium carbonate equivalent (LCE) and potash (KCl).
Table 11.7 Pastos Grandes Project resources expressed as LCE and KCl
|
|
Measured |
Indicated | ||
|
LCE |
KCl |
LCE | KCL | |
|
Tonnes |
3,522,000 |
12,721,000 |
303,000 | 1,089,000 |
|
LAR 85.1% interest (tonnes) |
2,997,000 |
10,825,000 |
258,000 | 926,000 |
Notes to Table 11.7
1. Lithium is converted to lithium carbonate (Li2CO3) with a conversion factor of 5.32.
2. Potassium is converted to potash with a conversion factor of 1.91.
3. Numbers may not add due to rounding.
It is the opinion of the author that the Salar geometry, brine chemistry composition, and the specific yield of the Salar sediments have been adequately characterized to support the Measured, Indicated, and Inferred Resource estimate for the Project herein.
It is the opinion of the author that the resources estimated and described in the current report meet the requirements of reasonable prospects for eventual economic extraction. The resource described herein has similar lithium concentrations, chemical composition, and hydraulic parameter values (drainable porosity values between 0.05 and 0.11 and hydraulic conductivities values between 0,5 m/d and 300 m/d) to resources currently in commercial production such as those in Salar de Atacama in Chile or Salar de Olaroz located in the Puna region of Northern Argentina. The hydraulic parameters of the resource area determined from the results of the pumping tests suggest that it is reasonable to expect brine extraction by a conventional production wellfield at a commercially viable rate, while the geochemical characteristics of the brine suggest that conventional processing techniques may be employed to produce saleable lithium products in an economically profitable manner. These conventional processing techniques are employed in most lithium brine operations, including the two operations at Salar de Atacama (Chile), one at Salar de Olaroz (Argentina), one at Salar de Cauchari (Argentina), and one at Clayton Valley (USA). The author is not aware of any known environmental, permitting, legal, title, taxation, socio-economic, marketing, political or other relevant factors which could materially affect the mineral resource estimate.
 |
12 MINERAL RESERVE ESTIMATES
No Mineral Reserve Estimates have been prepared as part of this resource estimate.
|
13 MINING METHODS
Based on the results of the pumping tests carried out for the Project (as described in Section 7 above) brine abstraction from the Salar will take place by installing and operating a conventional production wellfield. The production process starts when brine is extracted from the aquifer beneath the Pastos Grandes Salar, it is then pumped from each well to pre-concentration ponds located near the active wells. From these latter ponds brine is pumped to the remaining evaporation ponds and, once concentrated and partially purified, it is sent to the lithium carbonate plant.
Results of the pumping tests for the project indicate that pumping rates of individual brine production wells will be an average of 20 l/s for each well. Therefore, it is planned that an average of 30 production wells will be operative at various flow rates optimized to extract brine from areas of higher lithium grades and higher transmissivity in order to meet the required brine feed rate of 540 l/s, as an average (varying from 480 l/s in Stage 1 to 600 l/s in Stage 2). Seasonal fluctuations in the evaporation rate dictate that the required brine feed rate which will decrease during the winter months and will increase during the summer months. Well completion depths will vary and are still being studied. Brine production wells will be completed with 12-inch diameter stainless steel production casing and equipped with 380 V submersible pumping equipment. Permanent power will be delivered to the wellfield area through a mid-range power line.
The overall wellfield configuration is in process of being defined. Each well is to be completed with a submersible electric pump. These pumps can be powered initially by an adjacent dual-fuel (gas or diesel) generator, and eventually by an electrical distribution system from the centralized power house.
Brine discharged from each wellhead will be piped through 8-inch diameter HDPE feeder pipelines to two central collection/transfer ponds that are located near the well field. Collected brine will then be pumped at a diurnal, seasonal, and at an adjusted, as needed, rate to the evaporation ponds located mainly on the flat Salar surface.
|
14 RECOVERY METHODS
No mineral recovery methods have been described for this Resource Estimate update.
|
15 PROJECT INFRASTRUCTURE
This section describes the infrastructure that will be required by LAR's Pastos Grandes Project.
15.1 Permanent installations
Physical areas that constitute the project are:
• A brine wellfield located on the southern part of the salar
• Evaporation ponds that are located on the salar and on the properties north of the salar
• Facilities area (Liming Plant, Lithium Carbonate Plant, Camp, others), located on the properties north of the salar.
Permanent installations are those required during the operation of the project. Main permanent installations considered for the project are:
• Staff housing
• Medical facilities
• Laboratory
• Brine production wells
• Evaporation ponds
• Pumping stations
• Evaporation ponds internal roads
• Evaporation ponds contour channels
• Process Plant
• Auxiliary installations
Figure 15.1 shows the main permanent installations required for the project. These are described below.
|
Figure 15.1 Project installations
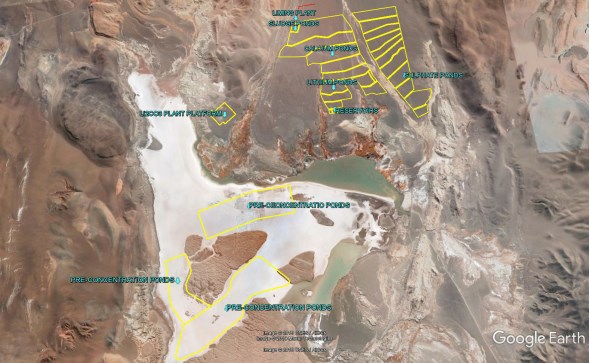
Brine production wells
All the brine wells for the project will be located within the salar. It is estimated that up to an average of 30 production wells will be continuously feeding the project, supplying an average flow of 20 l/s each to the evaporation ponds in Stage 2 production, specifically to the pre-concentration evaporation ponds located above of the salar. Brine wells will feed the evaporation ponds directly, and no transfer ponds will be considered in the project.
Evaporation ponds
The evaporation ponds for the project will be located both on the salar (pre-concentration ponds), as well as on the properties north of the salar (calcium, sulphate and lithium ponds). Brine will be concentrated in these ponds through solar evaporation.
These ponds are constructed by leveling the salar surface, building the pond border walls with material from the leveled area, and waterproofing the base of the ponds with a geomembrane.
There will also be a liming plant in the evaporation ponds area. Brine liming is necessary to increase the precipitation of unwanted elements in the brine. This plant will include equipment required for this task (slaking systems for preparation of milk of lime, storage tanks, reactors and sludge ponds) and will be installed in the same general area of the ponds, in a special purpose building.
|
Pumping stations
Brine will be transferred from one pond to the next through gravity driven flow or the use pumping stations, according to requirements. These stations may consist of a tank and a group of pumps, or of only a group of pumps, depending on the flow requirements (volumetric flow to be pumped, distance to be pumped, type of fluid to be pumped, among others), and will be installed on the top of the berm between each pond, or on an area that is suitable for the installation of the station, if space on the berm is inadequate.
Evaporation ponds internal roads
The berms constructed between ponds will also serve as vehicular roads for vehicle circulation during pond harvesting, and as pedestrian and vehicular lanes for monitoring and maintenance activities.
Evaporation ponds area contour channels
The project considers the construction of contour channels, which will be built surrounding the project, to divert and evacuate any superficial water that may affect the project (rain water). Channels sections were calculated based on the lifespan of the project, as well as on the return periods of the climate events considered for this type of installations.
Process plant
The process plant will be located on the project properties located west of the reservoir ponds. The platform that contains the process plant will also include the following main areas:
• Lithium Carbonate Plant
• Service Facilities
• Control rooms
• Auxiliary installations
|
Figure 15.2 Layout of the Lithium Carbonate Plant
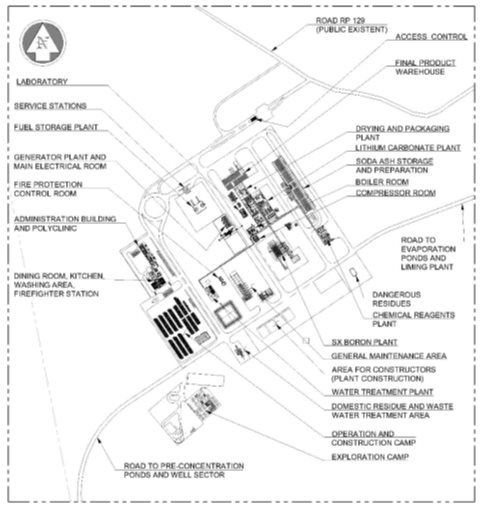
Lithium Carbonate Plant
The facilities included in the lithium carbonate plant are:
• Solvent extraction (SX) building
• Lithium carbonate building (includes wet area, filtering, drying, packaging and product storage)
Service facilities
The following areas are included in the service facilities areas:
• Chemical Reagent Buildings, which include:
1. SX reagent warehouse (diluent and extractant)
|
2. Hydrochloric acid (HCl) reception and storage
3. Caustic soda (NaOH) reception and storage.
• Soda ash (Na2CO3) reception, storage and preparation
• Fuel storage and distribution station
• Natural gas distribution station
• Sulphuric Acid (H2SO4) storage, preparation and distribution
• Compressors room
• Boiler room
• Water Treatment Plant (generation of soft water)
• Maintenance area
Control Rooms
There are 3 control rooms are considered for the project, which will be located in:
• Solvent extraction (SX) building (includes the SX process)
• Lithium carbonate plant (include the lithium carbonate process, from magnesium/calcium removal to lithium carbonate packaging)
• Liming Plant (includes the complete liming plant located near the evaporation ponds)
All control rooms are located in the exterior of the respective industrial building.
Auxiliary installations
The project considers the installation of auxiliary facilities, to support the correct functioning of the plant. Contemplated main auxiliary facilities are:
• Access control checkpoint: main entrance to the plant, which will include admissions and control office, luggage control room, induction room, parking for vehicles and restrooms.
• Administration building: considered for all the offices for the administrative personnel of the plant. This will include a cafeteria for the personnel and a parking area for vehicles by the building. The administration building is projected to have a surface of 553 m2, and its construction will be in accordance with the rest of the buildings in the plant.
• Quality Control Laboratory: building destined for the process quality control and will provide chemical analysis for different samples, particle size analysis, moisture analysis, among others, in order to ensure the correct operation of the process.
• Weighing scale sector: for the vehicles and trucks that enter the plant.
|
• Truck Workshop: destined to provide service to all the trucks and earth moving equipment included in the project, especially, the salt harvesting truck and machinery. This workshop will include storage areas, mechanical and electrical workshops, waste yards and sludge degreasing treatment.
• Waste water treatment plant (WWTP): plant provided to treat all waste water generated in restrooms, bathrooms and camp kitchens, and produce industrial water within the standards for these types of plants.
• Industrial waste yards and warehouses: established yards and warehouses, where waste will be separated and stored according to its specifications (hazardous and non-hazardous), and later on transported to authorized discard centers according to defined regulations for each type of waste.
• Fire protection system: Project definition includes a fire protection system, where industrial water will be stored in tanks that will feed the plant's wet network. This system also considers a pumping system (electric and diesel), which will maintain a constant pressure in the network, guaranteeing water supply, in compliance with NFPA standards.
Workers camp
The workers' camp for the project will be built within a reasonable distance of the Lithium Carbonate Plant. This camp will include several facilities which will be interconnected with pedestrian and vehicular access. All facilities are assumed to be of modular type construction.
The main facilities that will be considered in the mining camp are:
• Bedrooms: dormitories installations will be defined for the construction and the operational stages, with some of the dormitories required in the construction stage being temporary. These bedrooms will have a heating system, power supply, ventilation, sanitary installations, networks and fire detection and extinguishing systems. The dormitories will be in a one (1) level modular system, with simple rooms that have a bathroom, or double rooms that have a shared /common bathroom. Dormitories capacity during the construction stage will be for 1000 people in the dormitories, and during the operational stage capacity will be for 208 people.
• Dining room: will include all the facilities to accommodate and serve the amount of people required in the project during the operational stage. Temporary dining rooms will be considered for the construction stage, which will be removed after the end of this stage. The dining room will have heating and ventilation systems, as well as sanitary installations and fire detection and extinguishing systems according to Argentinian legal requirements.
• Recreational areas: There will be recreational areas for the personnel that live during their shift in the camp, these areas will include a sport field located outdoors.
• Polyclinic: a suitable polyclinic will be considered inside the mining camp, to care for all the personnel of the plant, during both construction and operations. This facility will include a reception room, first aid sector, restrooms, recovery rooms, medical personnel offices, among others. Resuscitation equipment will also be considered in this sector. A parking sector for ambulances and a few vehicles will also be considered.
|
15.2 Services
The main services defined for the project are described below.
Electrical energy
Electrical power required for the Pastos Grandes Project is 7.54 MW. This number includes all power required by all project areas, such as brine extraction wells, evaporation ponds, liming plant, Lithium Carbonate Plant and Worker's Camp, among others.
The power supply alternative considers onsite electrical generators, which will be driven by natural gas engines. Natural gas supply is through a gas pipeline connected to the La Puna gas trunk line. There will also be an area for the installation of a 2 MW photovoltaic plant.
The main electrical room is located on the plant and it composed by five (5) + one (1) stand-by electric generators operated with natural gas engines, each one with a capacity of 1,784 kWe. The Electric Generation Room considers a main switchgear room. The main electrical room will be connected to the plant through an electrical line, which will feed each of the electrical rooms located in each plant. The electrical rooms considered for the project are modular type, and backup generators will also be considered for the project.
The following control rooms are defined for the project:
• Electrical room 1 - General generation room: considers five (5) generators + one (1) stand-by generator. This electrical room considers an integrated control room.
• Electrical room 2 - Lithium Process 1: feeding electrically the primary and secondary carbonation stages, lithium carbonation stage, CO2 Purification and Drying.
• Electrical room 3 - Lithium Process 2: feeding electrically the SX process, soda ash preparation process and HCl preparation process.
• Electrical room 4 - Liming Plant: feeding electrically the liming plant for the evaporation ponds.
• Electrical room 7 - Pumps 1: feeding electrically the transfer pumps for the evaporation ponds.
• Electrical room 8 - Pumps 2: feeding electrically the transfer pumps for the reservoirs.
Natural gas
The gas that will be used in the project will be obtained from a gas pipeline that passes within 30 km of the Pastos Grandes Salar. This high-pressure gas pipeline is called "La Puna" and was designed for a maximum pressure operation of 100 bar. It has a diameter of 6'' and an extension of 186 km. It was designed for a flow of 800,000 m3/d of gas, depending on the pressure conditions of the Atacama gas pipeline which feeds it.
This pipeline starts at the intersection of RN-52 and RP-38, near Susques, in the sector known as the river "Las Burras", where it interconnects with the Atacama gas pipeline. From there it travels parallel to RP-38 to reach the San Antonio de los Cobres village, where it provides gas for the sector. The gas pipeline continues SW for 104 km to reach Pocitos Salar, its final point. In Figure 15.1 the existing La Puna gas pipeline can be seen in yellow.
|
Figure 15.3 Routing for the "La Puna" gas pipeline
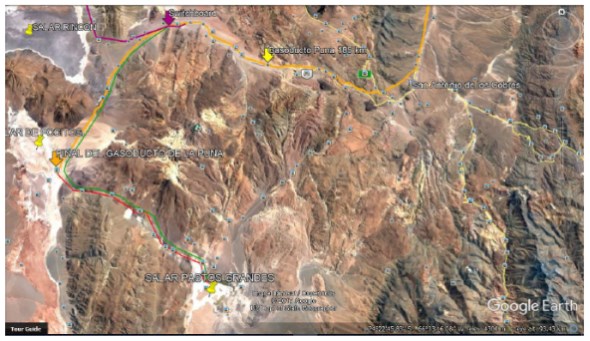
The elevation of the gas pipeline varies between 3.496 m.a.s.l. (connection with the Atacama gas pipeline) and 4.900 m.a.s.l. in Alto Chorrillos, ending at an elevation of 3.700 m.a.s.l. in Pocitos Salar.
The Pastos Grandes Project considers building a new line, connecting Pastos Grandes with the current terminal point of the La Puna gas pipeline. This new gas pipeline will have a length of approximately 37 km and will travel mainly parallel to RP-129. This route can be observed in red in Figure 15.3.
|
Figure 15.4 Routing for the Pastos Grandes gas pipeline
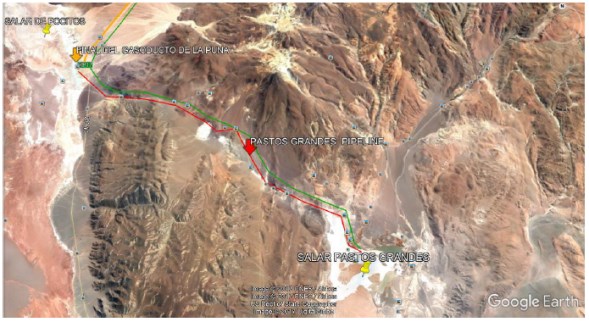
Water
Drinking water
Drinking water for the project will be obtained from authorized potable water sources. It will be transported from the source to the project in tank trucks or in water containers, which will feed the drinking tanks installed in the plant, or the water dispensers located in the mining camp or the offices. This supply will occur periodically, to ensure the provision of drinking water for all personnel.
Industrial Water
Industrial water will be obtained from wells drilled for the project. This water will be used for:
• Moistening of earthwork material for structural fills during construction of ponds and plant platforms (during the construction stage)
• Irrigation and dust control in work fronts (during the construction stage, after which this task will be carried out with the clean water obtained from the WWTP)
• Water dilution for transfer pumps used to transfer brine from on pond to another (during the construction stage of the water treatment plant, after which all the rejection water obtained from this water treatment plant will be used for dilution)
• Feeding the Lithium Carbonate Plant.
The process requires two (2) types of water: industrial water and soft water. The industrial water will be used without treatment from the water well, and soft water will be obtained from a water treatment plan, where through processes of water purification, soft water required by the process will be generated.
|
Diesel fuell
Diesel fuel required by the project will be obtained from the main Diesel tank, which will be fed by the supplier's tanker trucks. These tanks will be refilled on a regular basis, depending on the fuel consumption throughout the project. Main consumption will be centered in the salt harvesting trucks and machinery but will also be required by light vehicles, other trucks, vans and buses that circulate inside the plant during operations.
|
16 MARKET STUDIES AND CONTRACTS
This section provides a summary of the supply and demand of lithium and price forecasts. Material presented in this chapter is primarily from the Lithium Quarterly Market Review October 2024, Benchmark Minerals, iLiMarkets and U.S. Geological Survey, Mineral Commodity Summaries, January 2024.
16.1 Lithium applications
Lithium has unique properties that enables its use in many applications. This metal, the lightest known, combines high electrochemical potential with exceptional heat and electricity conductivity. Its role in the battery industry is critical, as lithium, while just one component, is indispensable for battery functionality.
Lithium-ion batteries are the most suitable technology for energy storage and the most electrochemically mature due to their high energy capacity. The largest applications for lithium chemicals are rechargeable batteries, but lithium chemicals are also used in the glass, lubricating greases, metallurgy, pharmaceutical, and polymer industries.
Lithium-ion batteries are advanced energy storage devices that rely on electrochemical processes to function. Their key components include the anode and cathode, which serve as electrodes where electrochemical reactions take place, and the electrolyte, a medium that facilitates the movement of lithium ions between the anode and cathode during charge and discharge cycles. This design enables efficient energy storage and transfer, making lithium-ion batteries a cornerstone of modern energy solutions.
Among the various types of cathodes used are lithium cobalt oxide (LCO), lithium iron phosphate (LFP), lithium nickel manganese cobalt oxide (NMC), lithium manganese spinel (LMO), lithium nickel cobalt aluminum oxide (NCA), and Lithium Manganese Iron Phosphate (LMFP). Each of these cathode types offers distinct advantages and disadvantages in terms of safety and specific energy.
When comparing LFP and LMFP, LMFP offers improved energy density over LFP, while still maintaining a low-cost structure, making it an attractive option for a range of applications. Currently, LMFP technology is primarily being pioneered in China, although initial variants are not pure LMFP, but a compound combined with NMC. Key optimization decisions being made in the early stages of development focus on refining the production process and selecting the appropriate manganese chemical feedstock to maximize performance and cost-efficiency.
|
Figure 16.1 LFP, LMFP, and NCM comparison (Source: Lithium Quarterly Market Review October 2024 from
iLiMarkets.)
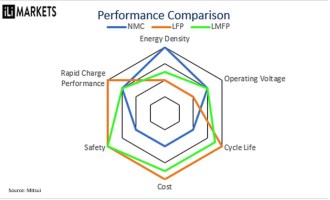
Just as potential improvements in battery cathodes have been studied, efforts have also been dedicated to refining the anode and the electrolyte.
The battery raw materials cost is presented in Figure and Figure . The commercial used of Li anode means that Li intensity will double in the battery.
Figure 16.2 Battery raw materials cost (Source: Lithium Quarterly Market Review October 2024 from
iLiMarkets)
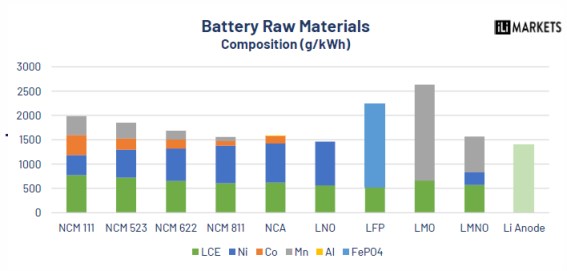
|
Figure 16.3 Battery raw materials cost (Source: Lithium Quarterly Market Review October 2024 from
iLiMarkets.)
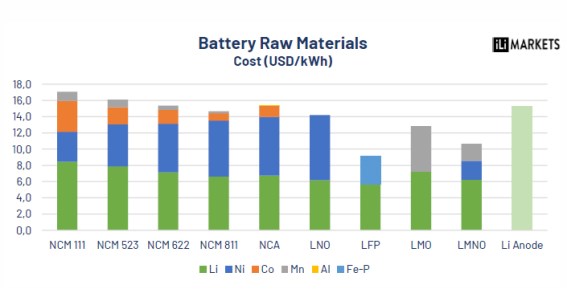
16.2 Lithium demand
Lithium average demand growth through 2030 is expected to be 250-300 kMT/y with a CAGR of 18%. Lithium demand for batteries was projected to reach 3.4 million MT LCE in 2033, electric vehicles (EVs) accounting for 64% of lithium demand and Battery Energy Storage System (BESS) representing 24% (Figure 16.4 ).
Figure 16.4 Lithium Demand in Batteries (2024) (Source: Lithium Quarterly Market Review October 2024
from iLiMarkets.)
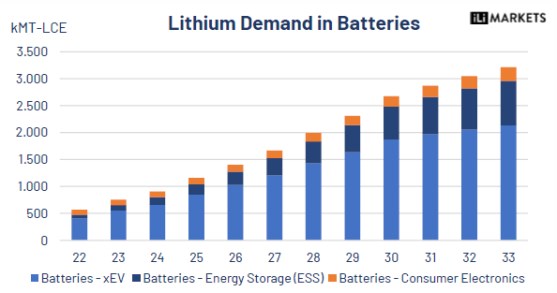
|
The outlook for lithium demand is positive, driven by the development of electromobility and the growing need for batteries in the electronics industry. Lithium has been listed as one of the critical elements by the U.S. Department of Energy based largely on its importance in rechargeable batteries. Lithium-ion battery is the preferred form for high-density applications like EVs and portable electronics. A full-electric EV can require over 50 kg of LCE in the battery. By 2033, it is estimated that energy storage could represent 95% of global lithium demand.
Lithium consumption is expected to increase significantly in the coming years driven by a rapid increase in demand for EVs. According to Lithium Quarterly Market review from iLiMarkets issued on October 2024, EV sales have grown by 3.5 -4.0 million EVs per year over the last three years, which represents between 150-200 kMT-LCE incremental demand year on year. The EV main players in EV battery manufacturing are represented in the following Figure 16.5.
Figure 16.5 Lithium EV main players (Source: Lithium Quarterly Market Review October 2024 from
iLiMarkets.)
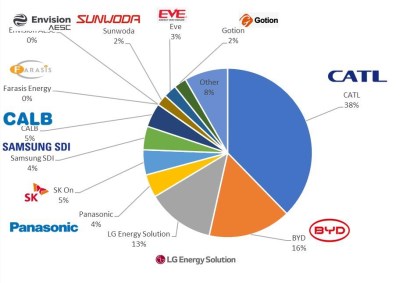
The EV sales forecast for the region is presented in Figure 16.6 and the EV penetration rate forecast is presented in Figure 16.7 .
|
Figure 16.6 EV Sales forecast per region (Source: Lithium Quarterly Market Review October 2024
from iLiMarkets. Horizontal axis label is in years.)
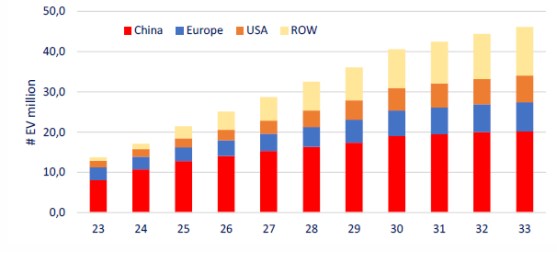
Figure 16.7 EV Penetration rate forecast (Source: Lithium Quarterly Market Review October 2024 from
iLiMarkets.)
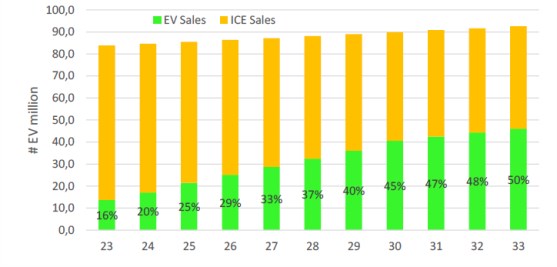
16.3 Lithium supply
Lithium occurs in the structure of pegmatitic minerals, the most important of which is spodumene (hard rock) and due to its solubility as an ion, is also commonly found in brines and clays. Pure lithium does not occur freely in nature, only in compounds. Starting in the 1980s, brine-based lithium chemicals provided most of the supply; however, in recent years' hardrock forms have surpassed brine as the largest feedstock for lithium chemical production.
|
The US Geological Survey estimates global lithium reserves of 147 MT of lithium carbonate equivalent (LCE) (USGS, January 2024).
The world's largest known lithium reserves are in Chile, which accounts for 34% of lithium reserves, followed by Australia with 22%, and Argentina in third place, accounting for 13% of global reserves. Lithium production is summarized in Figure 16.8 .
China is a global leader in lithium refining and battery production, with a highly advanced and integrated supply chain. It imports raw lithium minerals, mainly from Australia and South America, and then processes it into battery-grade lithium compounds, such as lithium hydroxide and lithium carbonate.
Figure 16.8 Lithium Production (2023) by Country (Source: U.S. Geological Survey, Mineral Commodity
Summaries, January 2024. It excludes US production.)
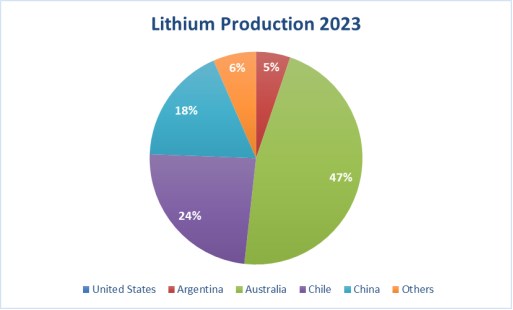
Minerals are expected to play a key role in meeting the growing demand for critical resources in the coming years, contributing the majority of the incremental supply. The global lithium production is largely driven spodumene operations in Australia, brine operations in Chile and Argentina. Over the last 12 months, Australia's lithium exports were approximately 400,000 metric tons of LCE, Chile's lithium exports were about 250,000 metric tons of LCE, and Argentina's lithium mineral exports reached approximately 60,000 metric tons of LCE. The lithium supply forecast per resource type is presented in Figure 16.9 and per country in Figure 16.12.
|
Figure 16.9 Lithium Supply Forecast per Resource Type (Source: Lithium Quarterly Market Review
October 2024 from iLiMarkets.)
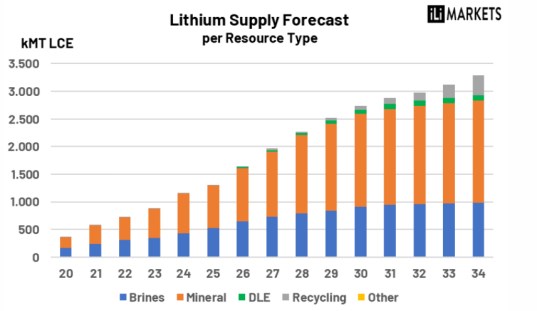
Currently, Argentina has four active lithium projects, collectively exporting approximately 60,000 metric tons of LCE. Production is projected to reach 450,000 metric tons of LCE by 2034, driven by the expansion of existing operations and the development of new projects. This growth highlights Argentina's increasing role in the global lithium market as demand for critical resources continues to rise.
Figure 16.10 Lithium Supply Forecast per Country (Source: Lithium Quarterly Market Review October 2024
from iLiMarkets.)
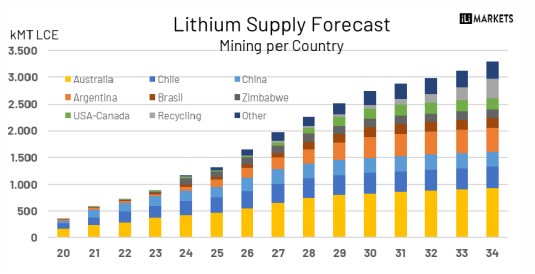
|
16.4 Lithium suppliers leading companies and market share
Figure 16.13 shows the market cap of leading lithium players.
Figure 16.11 Market cap/sum LCE Mined (24-28) (Source: Lithium Quarterly Market Review October 2024
from iLiMarkets.)
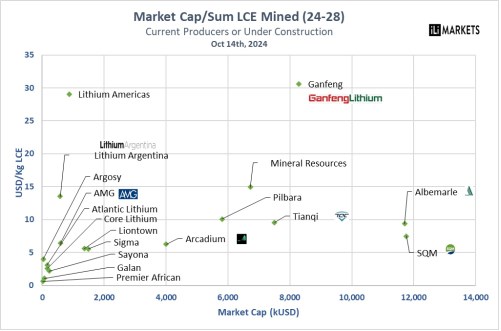
Competitive strategies
Due to the high competitiveness in the market, there are various strategies that lithium suppliers can adopt to differentiate themselves. The main ones are detailed below.
Pricing strategies: In the lithium carbonate market, pricing plays a critical role in maintaining competitiveness. Companies often adopt dynamic pricing models based on production costs, market demand, and competitor benchmarks. Long-term contracts with fixed or indexed pricing provide stability, while spot pricing allows for flexibility in responding to short-term market fluctuations. Competitive pricing is particularly crucial in regions with high production costs or significant logistical challenges.
Innovation as a differentiator: Innovation is a key driver of competitive advantage in the lithium industry. Investments in advanced extraction technologies, such as direct lithium extraction (DLE), enable companies to reduce environmental impact and enhance efficiency. Additionally, breakthroughs in battery technology, including higher energy density and faster charging capabilities, can open new market opportunities and strengthen partnerships with downstream industries. Companies that prioritize research and development are better positioned to adapt to evolving market demands.
|
Sustainability as a core strategy: Sustainability has become a pillar of competitive strategies in the lithium carbonate market. Producers are increasingly focusing on reducing their carbon footprint, optimizing water usage, and adopting renewable energy sources for operations. Transparent reporting on environmental, social, and governance (ESG) metrics appeals to environmentally conscious investors and customers. Companies that integrate sustainability into their operations not only meet regulatory requirements but also build long-term trust and resilience in a rapidly changing market.
Regulations and legal aspects: The lithium carbonate industry operates under a complex framework of regulations and legal requirements that vary across regions. Environmental regulations are particularly stringent, with a focus on minimizing the ecological impact of mining and processing activities. Companies must comply with strict water usage policies, waste management protocols, and carbon emission standards. Non-compliance can lead to hefty fines, operational delays, or loss of permits, posing significant risks to business continuity. Adhering to evolving regulations can also present opportunities. Compliance with high environmental and social standards enhances a company's reputation and can provide a competitive edge in securing contracts with environmentally conscious clients. Additionally, favorable government policies, such as tax incentives or grants for sustainable practices, can reduce operational costs. Companies that proactively engage in legal risk assessment and align with global sustainability frameworks are better positioned to thrive in a highly regulated market.
16.5 Lithium supply demand balance
Whereas in 2010, the world's two largest producers supplied 68% of the global lithium market, by 2024 their share has shrank to 33% and it will continue decreasing. On the demand side, in 2010 the world's two largest consumers accounted for around 5% of global demand. By 2024 their share has grown to 36% and it will continue increasing. With this large market share, the capability to control market dynamics is huge.
Figure 16.12 Lithium Supply & Demand Forecast (Source: Lithium Quarterly Market Review October 2024
from iLiMarkets.)
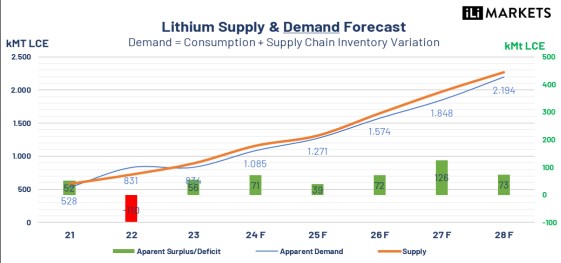
|
Market projections: risk assessment and identification of opportunities
The lithium carbonate market faces various risks that could impact future projections, including fluctuations in raw material availability, regulatory changes, and evolving technological requirements. Environmental concerns and stricter sustainability standards may also pose challenges for producers, requiring significant investment in greener extraction and processing methods. Additionally, the volatility of global demand for electric vehicles and energy storage solutions presents uncertainty, making accurate market forecasting essential.
Despite these risks, the market offers numerous opportunities for growth. Increasing global investments in renewable energy and the transition to electric mobility drive demand for lithium carbonate. Emerging technologies, such as solid-state batteries, could further boost the market, creating opportunities for innovation. Furthermore, the development of localized supply chains and strategic partnerships in key regions may enhance market stability and competitiveness, positioning companies to capitalize on future growth.
Economic factors and price volatility
Lithium carbonate prices are heavily influenced by various economic factors, including supply and demand dynamics, global economic conditions, and the pace of technological advancements in battery and renewable energy sectors. A key driver of price volatility is the cyclical nature of demand from electric vehicle manufacturers and energy storage markets, which can lead to sharp fluctuations. Additionally, geopolitical factors and shifts in production levels in major lithium-producing countries further contribute to market instability.
Impact of logistics and tariff costs
Logistics and tariff costs significantly impact on the final price of lithium carbonate. Transportation challenges, including limited infrastructure in remote mining regions and the rising costs of shipping, add to the overall expenses. Moreover, tariffs and trade restrictions between countries can increase costs for exporters and importers, creating regional price disparities. These factors, combined with exchange rate fluctuations, play a crucial role in shaping the competitiveness and accessibility of lithium carbonate in global markets.
16.6 Price forcast
As the transition towards sustainable energy solutions accelerates, lithium has become a critical raw material. Over the past decade, supply constraints and oversupply at different times have contributed to significant price fluctuations. In recent years, prices saw dramatic increases between 2021 and 2023, peaking for a short period of time at around US$80 per kg, before seeing a significant decline and downward trend continue through 2024.
Investments in lithium extraction technologies, such as direct lithium extraction (DLE), and the expansion of mining capacity could impact the future supply/demand balance and pricing landscape.
Market analysts predict that lithium prices may stabilize in the coming years as supply chains adapt to growing demand and new production methods are developed.
A range of projected prices to 2040 is presented in Figure 16.13.
|
Figure 16.13 Projected Pricing for Battery-Quality Lithium Carbonate Used in Economic Model (Source:
"Lithium Price Forecast," Benchmark Mineral Intelligence, October 2024.)
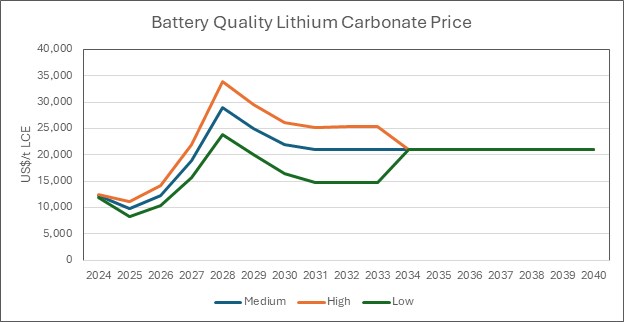
Table 16.2 reflects Benchmark Minerals market price expectations for battery quality lithium, which was presented in the Benchmark Mineral Intelligence Lithium Price Forecast report dated October 2024.
LAR looked at the trailing 3-year and 5-year average spot price of battery grade LCE as support for projected average LCE price over the next 5 to 10 years. The average prices are shown in Table 16.1 below.
Table 16.1 3-year and 5-year average spot price of battery grade LCE
|
LCE Price |
From |
To |
LCE (CNY/T) |
LCE (USD/T) |
|
Average over the last 5 years |
2019-12-31 |
2024-12-31 |
168,705 |
24,270 |
|
Average over the last 3 years |
2021-12-31 |
2024-12-31 |
186,207 |
26,654 |
|
Table 16.2 Benchmark Minerals market price expectations for battery quality lithium
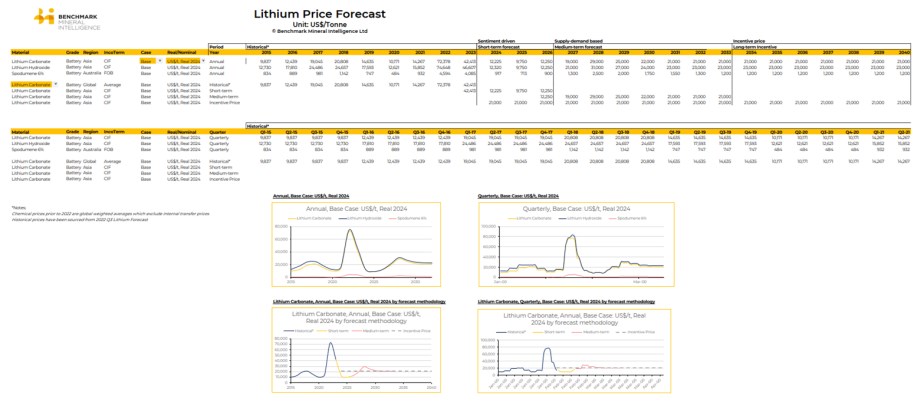
|
17 ENVIROMENTAL STUDIES, PERMITTING AND SOCIAL OR COMMUNITY IMPACT
17.1 Environmental studies
Millennial contracted Ausenco to prepare the initial Environmental Baseline Study for the Project in 2018. This study formed the basis for the Project's Environmental Impact Assessment in 2019. Elisa Cozzi y Asociados (EC) updated the Environmental Baseline report in September 2022 as required by law. Currently regional hydrogeological studies are being carried out by the Universities of Alaska and Massachusetts to refine the quantification of recharge to the Pastos Grandes Basin. A significant surface water and groundwater monitoring network is being implemented throughout the Pastos Grandes and Sijes sub-basins.
17.2 Environmental permits
Applicable Regulatory Framework
The specific regulatory system of the mining activity according to the regulations and criteria of the Argentine Republic and Salta Province, applicable for the construction and operation stages of mining projects, are described as follows:
National Law Nº24,585 stipulates the environmental regulation that must be fulfilled by those who carry out mining activity in the Argentine Republic. This regime of environmental protection and conservation of natural and cultural patrimony reaches all legal persons and legal entities, whether state-owned or private, whether national or foreign, that perform mining activities (exploration and exploitation), derived industrial activities and waste disposal, whether its nature is related directly or indirectly to the mining activity (article 247).
In Salta Province, the Secretary of Mining, through the Department of Mining Environmental Control is determined to be the Application Authority. In this case, the Application Authority
evaluates the Environmental Impact Assessment (EIA) and approves it through a "Declaración de Impacto Ambiental" (DIA), for each of the project stages or from effective implementation.
The EIA presentation, for the different stages, must be carried out and approved through the DIA, previously to the initiation of the activities (Law 7141, article 34 Códigos de Procedimientos Mineros de Salta).
In addition to the law Nº 24,585 in the national and provincial legal code, another complementary environmental law exists to regulate the mining activity at a provincial and national scale. Specific activities covered by the laws include the following:
• Dangerous waste generation and transport
• Water extraction for mining purposes
• Effluent discharges
|
• Soil protection
• Energy production
• Fuel management
• Explosives management and storage
Exploitation Environmental Impact Assessment Permit
Ausenco (2019) authored an Environmental Impact Report for construction and operation of the Project. This report was completed in accordance with the requirements of the Environmental Protection Law for mining activity Nº 24,585 and complementary regulations. The final report was presented to the Salta Province Secretary of Mining in June 2019.
An assessment of environmental impacts was conducted using the methodology proposed by Conesa Fernandez Vítora (1997). Based on detailed natural environment and social description in the Environmental Baseline, environmental factors were identified that are likely to be impacted by construction, operation and mine closure.
The environmental impact assessment was carried out through workshops of experts following the Delphi methodology (Webler et al., 1991), utilizing quasi-quantitative criteria. For the identification of environmental factors, a classification of environment in systems, sub systems, components and environmental/social factors was designed. Every medium was considered unique, consequently, the environmental/social factors are characteristic and representative in each medium in particular. The area of influence was defined for the different factors taking into account the intervention areas and the type of expected effects.
The relevant actions with a potential to cause impact in the surroundings of the project were taken into account. From that starting point, the interactions between environmental factors and the project actions were identified, that is to say, the existence or inexistence of impact from a determined factor, for each stage of the project actions, thus this way generating a Cause-Effect Matrix. Subsequently, an Importance Matrix was constructed, which allowed the obtainment of a qualitative assessment of the importance of the effects.
Based on the elaboration of the matrices for each stage of the project and its latter analysis, it is concluded that the Construction stage has the largest potential for social-environmental impacts - more than twice than what the other two stages generate (Operation Stage and Closure Stage). Therefore, it is necessary to implement adequate measures of environmental management over this stage of construction and its impacts, even if they are for the most part minor and temporary.
The total Environmental Impact (EA) projected for each of the three stages is judged to be minor. The values obtained for each stage were: Construction (-19.4% EA), Operation (-8.9% EA) and Closure (+11.03% EA). Based on these findings, the study concludes that the project is environmentally viable as planned.
From the results obtained in the impact assessment, an Environmental Management Plan (EMP) was prepared, in which different measures were established (protection, mitigation and/or compensation) to attenuate or minimize the possible negative effects of the project and achieve environmental and social sustainability for the activity. A monitoring program was included to comply with previously established regulatory demands regarding concerns for potential future impacts.
|
Finally, the report recommends that all measures and actions established in the EMP must be monitored in order to verify that they are within the expected criteria according to plan. The monitoring and follow up of these measures will ensure that the obtained result, with respect to the different components and factors of the analyzed environment, are within the established standards in the applicable national and international legislation.
LAR has secured all required permits to continue with the exploration activities described hereinafter in Section 23. Further EIA updates will be carried out as required for Project construction and operations.
17.3 Social and community
The closest community to the Project is Santa Rosa de Los Pastos Grandes. The habitants are mostly descendants of Andean Indigenous People (Kollas). Very few people live within the Project area, only five isolated houses have been identified. In the area of influence of the Project, the predominant economic activity is the breeding of llamas and small ruminants that include goats and sheep. LAR has a proactive approach in its relationship with the local communities and other stakeholders. The Company is continuously updating its social management strategy to follow international standards, including Local Employment, Local Suppliers, Grievance Mechanism and Participatory Environmental Monitoring (MAP). The Company has developed a Stakeholders Engagement Plan that promotes numerous activities with the local community.
LAR actively employs people directly from the local communities as well as extends as contract services. The Company participates in the "Coordination Tables" between companies, communities, and the Province for Santa Rosa de los Pastos Grandes and Estacion Salar de Pocitos. LAR has supported the construction of an Integration Center and a freshwater well for the community, amongst other initiatives, in Santa Rosa de los Pastos Grandes.
Argentina joined and ratified the International Agreement concerning Indigenous and Tribal Peoples in Independent Countries of the International Labor Organization (ILO) Convention 169 in March 1992. This Convention calls on governments to develop systematic actions to protect the rights of indigenous and tribal peoples, including their social, economic, and cultural rights, customs, traditions and institutions. LAR is complying with the application of this convention in Argentina.
It is the opinion of the author that LAR is proactively managing the permitting and environmental requirements for the further development of the Project and that LAR has implemented adequate social and community programs
|
18 CAPITAL AND OPERATING COSTS
18.1 Project capital costs
The capital investment for the Pastos Grandes Project, including equipment, materials, indirect costs and contingencies during the construction period is estimated to be US$ 880 million. This total does not include possible capitalized interest expenses that might be incurred during the same period. Out of this, total Direct Project Costs represent US$ 590 million, Indirect Project Costs represent US$ 59 million, and the provision for Contingencies is US$ 81 million. Indirect costs represent 7 % of total project costs, while contingencies are 10 % of the total estimated project costs.
The estimates are expressed in fourth quarter 2024 US dollars. No provision has been included to offset future cost escalation. Accuracy of the estimate is expected to be within a -15% / +15% range.
Project Capital Costs are summarized in Table 18.1.
Table 18.1 Project estimate CAPEX
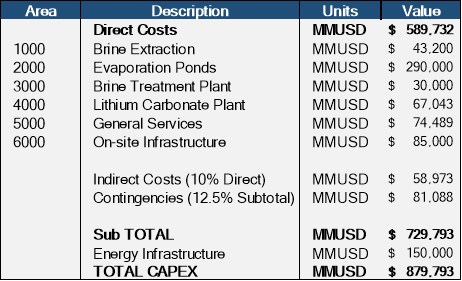
18.2 Project operating costs
This operating cost estimate has been prepared for the production of 24,000 TPY of battery grade (BG) Li2CO3. No production of KCl is considered at this time. The process definition for the project was carried out and delivered by LAR. A Pilot Plant facility was installed in PGSA properties near the salar which will be fed with concentrated brine from pilot plant on the salar. Vendor quotations have been used for reagents costs. Energy prices - mainly natural gas and diesel fuel- and chemicals prices correspond to expected costs at the project's delivery point.
|
Table 18.2 Estimate OPEX
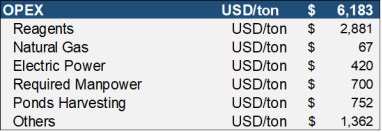
|
19 ECONOMIC ANALYSIS
19.1 Main assumptions
A financial analysis of the project was carried out using a discounted cash flow (DCF) approach. This method of valuation requires projecting yearly cash inflows, or revenues, and subtracting yearly cash outflows, such as operating costs, capital costs, and taxes. The resulting net annual cash flows are discounted back to the date of valuation and totaled to determine the NPV of the project at selected discount rates.
The analysis was prepared using an economic model and assesses both before-tax and after-tax cash flow scenarios. Capital (CAPEX) and Operational (OPEX) Expenditures presented in previous sections have been used in this analysis. The results include Net Present Values (NPV) for 10% discount rate, Internal Rate of Return (IRR) and sensitivity analysis of key inputs.
Cautionary Statement
The results of the economic analysis represent forward-looking information that are subject to a number of known and unknown risks, uncertainties, and other factors that may cause actual results to differ materially from those presented here. Forward-looking information includes Mineral Resource estimates; commodity prices; the production plan; projected recovery rates; use of a process method, infrastructure construction costs and schedule; and assumptions that project environmental approval and permitting.
19.2 Evaluation criteria
The following criteria have been used to develop the economic model:
-
Project life: engineering and construction and life of mine is estimated to be 40 years
-
Pricing for Lithium carbonate of US$20,000 per ton.
-
Final Production for Lithium carbonate is 24,000 TPA reach full operation 3 years after the start, assuming a ramp up rate of 25% for the first year of operation and 75% the second year.
-
The Discounted Cash Flow (DCF) economic evaluation was carried out on a constant money basis so there is no provision for escalation or inflation on costs or revenue.
-
Equity basis: for Project DCF evaluation purposes, it has been assumed that 100% of capital expenditures, including pre-production expenses, are financed with owners' equity.
-
Pre-construction/pre-production costs and not included into DCF analysis.
-
The key inputs to the economic analysis are shown in Table 19.1
-
Duties and VAT included
-
Royalties to third parties not included
|
- Lithium grades and recoveries constant for 40 years, no dilution was applied.
Table 19.1 The key inputs to the economic analysis
|
Economics Overview |
Units |
Phase 1 |
|
LCE Production |
TPA |
24,000 |
|
Mine Life |
years |
40 |
|
Total Capital Cost (CAPEX) |
US$ |
879,792,813 |
|
Operating Cost (OPEX) |
US$/tn |
6,183 |
|
Annual Revenue |
US$ |
480,000,000 |
|
Average Selling Price |
US$/t |
20,000 |
|
Discount Rate |
% |
10 |
19.3 Tax
Taxes & Royalties
The following taxes and royalties have been applied to the economic analysis of the Project.
Provincial Royalty
Argentinian provinces can charge up to 3% of the value of the mineral "mine of mouth" according to the Federal Mining Legislation in place (Act. N° 24196). A rate of 3% of sales is applied to the DCF model.
Export Refund
No export refund is applied for this evaluation.
Mining Licences
The total annual cost of maintaining mining licenses is 0.2 MMUSD per year. The amount paid is a function of the hectares used for the mining operation.
Tax on Debits and Credits Accounts
In Argentina, the tax on debits and credits on bank accounts considers 0.6% on debits, plus another 0.6% on credits. A company is permitted to book 34% of the tax paid on credit accounts as a credit for income tax; thus, the net effective rate on both debit and credit accounts is approximately 0.996%. Due to the insignificant value, this item in not included in the DCF economic model.
|
Aboriginal Programs
The economic model has accounted for anticipated development contributions to local aboriginal groups. The cost of engagement in community programs is considered 0.7 MMUSD annually.
Capital Allowance
Investment made in machinery, equipment, vehicles and facilities depreciated over ten years from the start of operation.
No provision for an accelerated depreciation of assets is included in the DCF.
Corporate Taxes & VAT
The applied corporate tax rate is 35%. VAT rebates are included in the model.
19.4 Capital expenditures
The economic model assumes that all capital investment will occur before start of each production phase. However, the actual Spend Schedule may be done in according to the following exhibit depending on the schedule envisioned:
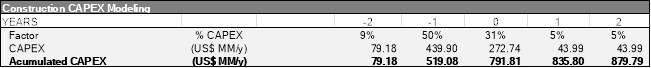
Production starts on year 1
Table 19.2 CAPEX
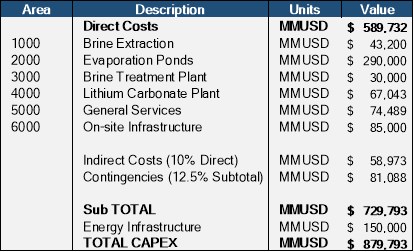
|
19.5 Operating costs
Operating cost are the following:
Table 19.3 OPEX summary
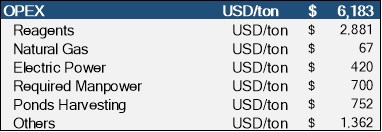
For the financial model, yearly constant operating costs are assumed for the life of mine without regard to potential fluctuations in lithium grades, brine flowrate and recoveries that could change over time and that will impact the operating cost.
It is only considered that in the first year of operation, the OPEX is 30% higher, in the second year it is 15% higher, and by the third year it stabilizes.
19.6 Production revenues
Production revenues have been estimated based on a single price scenario for Lithium carbonate equivalent of 20,000 $/ton irrespective of the actual lithium compound sold.
No attempt has been made to project product pricing beyond the first year. The same gross revenue per year (at design production) has been used for the duration of the project.
19.7 Mine closure
A total amount of -263,937,844 USD is estimated for the mine closing at the end of the mine life.
19.8 Sustaining CAPEX
Sustaining capital expenditures total US$902 M over the 40-year evaluation period of the project.
|
19.9 Cash flow projection
Table 19.4 summarizes the Discounted Cash Flow (DCF) for the assumed Base Case price and production level scenario.
|
Table 19.4 Discounted Cash Flow Summary
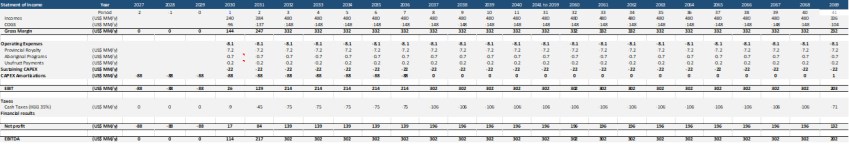
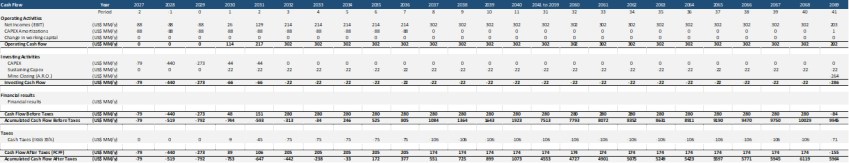
|
19.10 Economic evaluation results
The project is currently estimated to have a payback period of five years. The economic analysis indicates an after-tax Net Present Value (NPV), discounted at 10%, of approximately US$1.3 billion with an Internal Rate of Return (IRR) of approximately 23%.
The Project economics, resulting from the assumed price scenario used in the economic model, are presented in Table 19.5.
Table 19.5 Economic Evaluation
|
Overview |
Units |
Phase 1 |
|
Production (LCE) |
TPA |
24,000 |
|
Capital Cost (CAPEX) |
US$ |
879,792,813 |
|
Operating Cost (OPEX) |
US$/tn |
6,183 |
|
Average Selling Price LCE |
US$/t |
20,000 |
|
Annual Revenue |
US$ |
480,000,000 |
|
Discount Rate % |
% |
10% |
|
Net Present Value (NPV) Pre-Tax |
US$ |
1,291,444,261 |
|
Internal Rate of Return (IRR) Pre-Tax |
% |
23% |
|
Net Present Value (NPV) Post-Tax |
US$ |
630,795,727 |
|
Internal Rate of Return (IRR) Post-Tax |
% |
17% |
19.11 Payback analysis
Simple payback time for the project's base case is 5 years, from the beginning of the initial production of phase 1.
19.12 Sensitivity analysis
A sensitivity analysis was conducted to illustrate the impact of changes in key variables on the Project's NPV and IRR.
|
Table 19.6 Results of sensitivity analysis
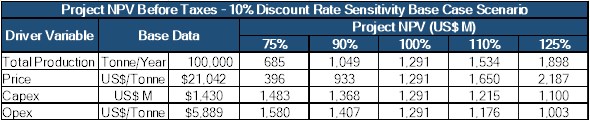
Figure 19.1 Project NPV Before Taxes at 10% Discount Rate-Sensitivity Base Case Scenario
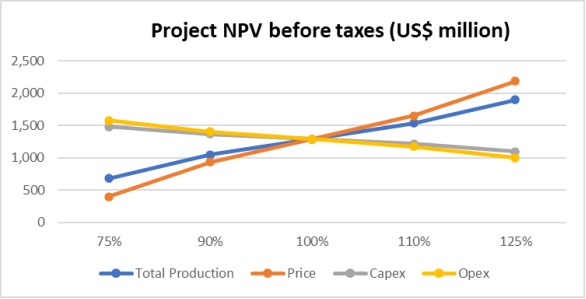
Table 19.7 Results of sensitivity analysis
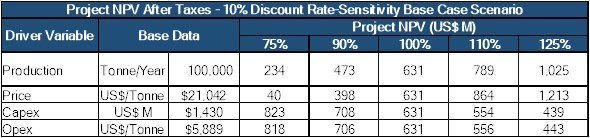
|
Figure 19.2 Diagram for Project NPV After Taxes at 10% Discount Rate-Sensitivity Base Case Scenario
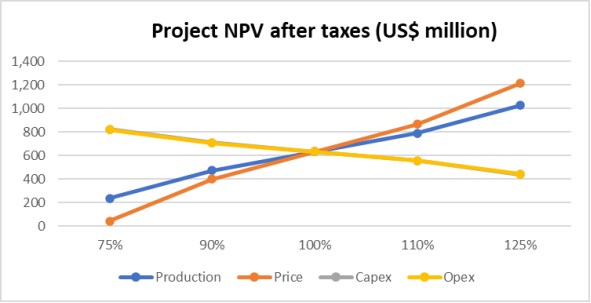
Project economics are most sensitive to variability in product pricing and production. Project results are less sensitive to capital expenditure and total operating costs, but some differences appear when results are measured in terms of NPV. The project is shown to be more sensitive to capital expenditures than to total operating cost.
19.13 Discussions and conclusions
Project economics resulting from assumed price scenario used in the economic model are presented in Table 19.5. A sensitivity analysis was conducted to illustrate the impact of changes in key variables on the Project's NPV and IRR.
CAPEX: Capital investment for the 24,000 tpy LCE Project, including equipment, materials, indirect costs and contingencies during the construction period is estimated to be US$ 879 million. This total excludes interest expense that might be capitalized during the same period but includes owner's cost.
Main CAPEX components are wells and pond construction and the Process plants, representing about 80% of total Project capital expenditures. Pond investment is driven by two variables, namely, evaporation rate, and pond construction unit cost.
OPEX: The operating cost for the 24 KTPA Project is estimated at US$ 148 M annually in full production. This figure includes ponds and plants, chemicals, energy, labour, salt waste removal, maintenance, camp services, and transportation.
Cash flow will be according to production ramp up that will reach 100% in year 5 of the cash flow estimate.
|
Sensitivity Analysis: Sensitivity analysis indicates that the Project is profitable even under very unfavourable market conditions.
Project strengths are as follows:
-
Brine: The Project is based on the exploitation of subsurface brines, which as a lithium source are commercially proven to be more economic than hard rock sources of lithium. Simple and proven evaporative process.
-
Mineral Reserves Size: Identified lithium Mineral Reserves (Proven + Probable) are very substantial, enough to meet the 24,000 tpa production rate over 40 years. In addition, the potential exists for resource expansion.
-
Pricing Estimate: Sensitivity analysis indicates that the project is economically viable even under unfavourable pricing conditions.
-
Location - Transportation: The project site is near on a major international highway connecting Argentina and Chile. This route provides access to ports in Northern Chile, to bring imported capital goods and raw materials for the project, as well as for exports of product to Asia. In addition, the route provides connection to Jujuy, Salta and Buenos Aires and allows convenient transportation of local capital goods, raw materials and personnel.
-
Process. Implementation. The company is specialized to the process for the type of brine in the salar with the same process configuration in other salar.
-
Lesson learned in Process System Design and Supplier Expertise. The design and fabrication of process equipment/facilities for the process and high-altitude location, considering the performance at high elevation and high wind environment, were tested in other plant owned by the company. Test at different vendors and pilot plant were performed.
The following Project weaknesses are also identified:
-
The Project location presents certain challenges. As with most salars, the Project is located above 3,800 masl. This elevation can be difficult for some workers. Location disadvantages have been partially addressed by moving some of the operating facilities to a lower altitude.
-
Brine composition: Relatively high contents of sulphate and magnesium in the brine make it necessary for a chemical treatment with lime to remove these components.
-
Weather. Dependence. Weather variation, including higher than normal raining periods and long winter periods have occurred in recent years that those factors could impact in the performance of the evaporation cycle in the ponds.
-
The project requires energy infrastructure development due to its location.
|
20 ADJACENT PROPERTIES
Third-party ownership of mining properties in the vicinity of the Project are outlined in Table 20.1 and shown in Figure 20.1. Third-party owners include Ganfeng Lithium Co dedicated to lithium production and Borax Argentina S.A. and ULEX S.A focused on borates production. The QP has been unable to verify the information and that the information is not necessarily indicative of the mineralization on the Pastos Grandes property.
Table 20.1 Mining properties in the vicinity of the Pastos Grandes Project
|
Property name |
File |
Property name |
File |
|
Monte Blanco |
1,218 |
Cerrito |
7,544 |
|
San Pablo 6 |
23,322 |
Muñeca Ii |
24,075 |
|
Cz 04 |
734,842 |
Avestruz |
17,517 |
|
Centenario 200 |
20,158 |
La Paz Iii |
1,198 |
|
Doña Pancha |
5,879 |
Quevar Quinta |
19,617 |
|
Aguamarga 44 |
19,512 |
Quevar Novena |
20,215 |
|
Neptali I |
9,606 |
Aguamarga 05 |
19,087 |
|
Santa Rosa |
1,220 |
Centenario 208 |
20,259 |
|
Elsa |
1,219 |
Demasia San Mateo |
23,036 |
|
Santa Rosa |
17,568 |
Bicentenario |
20,450 |
|
Maria Daniela |
17,737 |
Margarita |
5,569 |
|
Santa Elena |
1,217 |
Quebracho |
9,149 |
|
Ppg 05 |
741,363 |
Juan Pablito |
19,769 |
|
Sol De Mañana |
11,961 |
Industria |
1,193 |
|
Aguamarga 14 |
19,096 |
La Intermedia |
18,160 |
|
Tutamanta |
23,583 |
La Gran Ruben |
24,313 |
|
Monte Amarillo |
1,226 |
Monte Azul |
1,221 |
|
San Nicolas 10 |
23,321 |
Eg 04 |
734,837 |
|
Esperanza |
1,230 |
La Rescatada Ii |
17,391 |
|
Quevar Iv |
19,558 |
La Playosa |
18,791 |
|
San Cayetano I |
17,322 |
Shiban |
21,252 |
|
La Fortuna I |
19,308 |
San Mateo |
64,005 |
|
Monte Amarillo |
1,226 |
La Paz |
1,185 |
|
San Pablo 7 |
23,320 |
La Cerrana |
13,676 |
|
Taron Norte |
18,082 |
Centenario 201 |
20,159 |
|
Marisa 10 |
22,996 |
Casandra Iii |
22,797 |
|
Leoncia |
13,533 |
Cattleya |
23,149 |
|
La Pacha I |
18,161 |
Turco |
17,949 |
|
Don Felipe |
17,501 |
Apalacheana |
12,626 |
|
Centenario 8 |
24,187 |
Centenario 4 |
19,478 |
|
Charquito 01 |
22,146 |
Sofia 5 |
18,399 |
|
|
Property name |
File |
Property name |
File |
|
Cresta 2 |
710,411 |
Kratos Xv |
23,133 |
|
Taron Oeste |
18,086 |
Sijes |
1,196 |
|
La Paz |
1,197 |
Santiago Primero |
12,789 |
|
Centenario 3 |
19,477 |
Yacones Viii |
717,774 |
|
Aguamarga 06 |
19,088 |
San Mateo Ii |
13,171 |
|
Cresta 1 |
710,405 |
Santa Barbara I |
22,268 |
|
Casandra V |
22,806 |
Santa Elvira |
1,216 |
|
Gaston Iv |
16,919 |
Casandra Iv |
22,805 |
|
Quevar Vigesimo Cuarto |
21,044 |
Centenario 5 |
19,479 |
|
Bicentenario 303 |
23,011 |
La Paz Iii |
1,198 |
|
Calchin |
18,790 |
Cumbrecita V |
20,026 |
|
Centenario 1 |
19,475 |
Centenario 2 |
19,476 |
|
Norte Incachule |
21,573 |
Sarita |
1,208 |
|
Coronel Vidt |
3,445 |
Ppg 04 |
734,830 |
|
Rio Sijes |
20,605 |
Futuro I |
12,815 |
|
Monte Azul |
1,221 |
Cerrito |
7,544 |
|
Betina |
4,896 |
Graciela |
6,189 |
|
La Buscada |
17,589 |
Doña Pancha |
5,879 |
|
Monte Azul |
1,221 |
Cristal |
5,785 |
|
El Huesito |
17,552 |
Betina |
4,896 |
|
Cita |
1,232 |
Roberta |
23,098 |
|
Quevarita Ii |
746,319 |
Barreal 03 |
22,880 |
|
El Barreal |
21,660 |
Barreal 02 |
22,879 |
|
Muñeca Iv |
24,220 |
Barreal 01 |
22,878 |
|
Casandra Vi |
22,807 |
La Relojera |
22,820 |
|
Ona |
1,268 |
Patovica I |
20,902 |
|
Taron |
17,846 |
Fortuna LI |
20,120 |
|
Amapola 2 |
751,515 |
La Fortuna I |
19,308 |
|
Casandra Ii |
22,794 |
Almafuerte |
18,792 |
|
Pozuelo |
4,959 |
Campamento |
13,886 |
|
Maria Luisa Ii |
17,904 |
La Cerrana |
13,676 |
|
San Mateo Iii |
13,172 |
Sol de Mañana |
11,961 |
|
Quevar Decima Tercera |
20,501 |
Hierro Indio |
1,186 |
Source: Mining cadaster of the Salta Province
|
Figure 20.1 Location map of adjacent properties
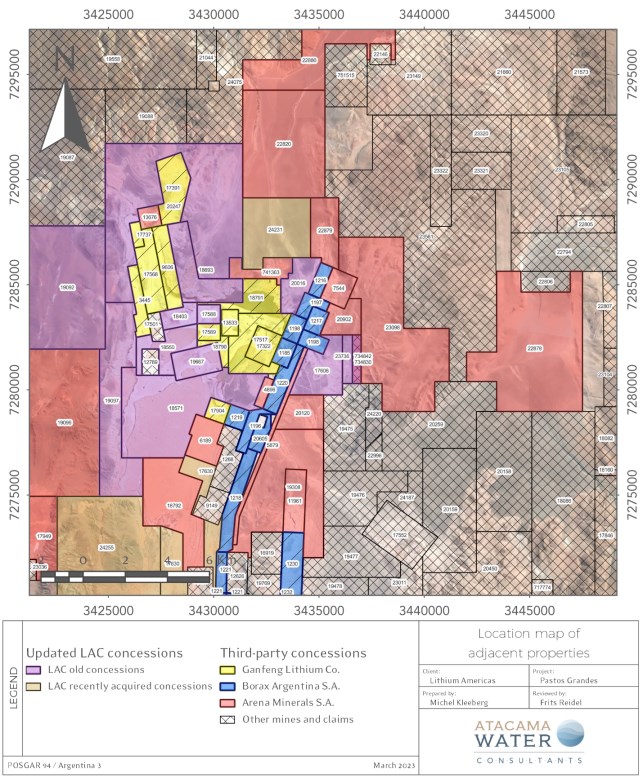
|
21 ADDITIONAL INFORMATION
It should be noted that the resource estimate described for the Pastos Grandes Project in Section 11 above does not include mineral resources contained in the Sal de la Puna properties that were obtained by LAR as part of the AMSA acquisition. A significant amount of work was completed by Centaur and AMSA on the Sal de la Puna Project as described in Sections 7 and 8 above. AMSA commissioned an independent Technical Report on Sal de la Puna dated September 29, 2021, with an inferred resource estimate of 106,000 t of lithium. The additional drilling and test work carried out by AMSA during 2021/2022 will result in an updated resource estimate and resource categorization that could positively affect the Pastos Grandes resources described in Section 11. A three-dimensional groundwater flow and transport model was initiated for the Sal de La Puna Project to evaluate mineral reserves.; LAR is now updating this model to evaluate and estimate combined reserves for a consolidated operation in Salar de Pastos Grandes.
|
22 INTERPRETATION AND CONCLUSIONS
Based on the analyses and interpretation of the exploration work carried out for the Pastos Grandes Project between 2011 and 2023, the following concluding statements are prepared:
• The entire Project area was covered by exploratory drilling between 2011 and 2023 at an approximate borehole density of one exploration borehole per-4 km2; it is the opinion of the author that such borehole density is appropriate for the mineral resource estimate described herein.
• The results of drilling 18 core holes and 30 rotary boreholes and the analysis of 501 primary brine samples (excluding QA/QC samples) identify distinct brine composition and grade at specific depth intervals, showing a relatively uniform distribution of lithium bearing brines throughout the Project to a depth of 635 m. The brine composition for the Project is summarized in Table 22.1.
Table 22.1 Summary of the average brine composition (g/L) and ratios
|
K |
Li |
Mg |
Ca |
SO4 |
B |
Mg/Li |
Ca/Li |
K/Li |
|
3,73 |
0,39 |
2,26 |
0,82 |
7,55 |
0,56 |
5,76 |
9,53 |
3,73 |
• The lithium bearing brine contains sufficient levels of lithium and potassium to be potentially economic for development.
• The geology in the Project consists of a relatively low permeability upper saline lacustrine unit with variable thickness. This upper unit is underlain in most parts by a lower brine aquifer hosted in unconsolidated sediments that consists of alluvial sediments, a clastic unit, and a basal gravel / breccia unit with a variable thickness of over 400 m to a drilled depth of 635 m.
• Pumping tests carried in productions wells completed in this lower brine aquifer supported brine production rates of 25 L/s over 30-day durations indicating favorable hydrogeological conditions and that brine can be commercially produced with conventional wellfield techniques.
• Geophysical surveys and brine exploration drilling carried out within the Project area indicate that the limits of the lower brine aquifer remain open laterally and at depth so that exploration potential exists to significantly increase the lithium resources documented in the report.
• It is the opinion of the author that the Salar geometry, brine chemistry composition, and the specific yield of the Salar sediments have been adequately defined to a depth 640 m to support the Mineral Resource Estimate described in Table 22.2.
|
Table 22.2 Mineral Resources of the PGSA mining claims - Dated December 31, 2024
| Measured (M) | Indicated (I) | M+I | Inferred (I) | |||||
| Li | K | Li | K | Li | K | Li | K | |
| Aquifer volume (km3) | 13.45 | 2.15 | 15.60 | 5.22 | ||||
| Mean specific yield (Sy) | 0.11 | 0.06 | 0.10 | 0.08 | ||||
| Brine volume (km3) | 1.5 | 0.1 | 1.6 | 0.4 | ||||
| Mean grade (g/m3) | 49 | 495 | 26 | 260 | 46 | 462 | 39 | 403 |
| Concentration (mg/l) | 438 | 4419 | 457 | 4,655 | 441 | 4,452 | 460 | 4,794 |
| Resource (tonnes) | 662,000 | 6,660,000 | 57,000 | 570,000 | 719,000 | 7,230,000 | 205,000 | 2,100,000 |
| LAR 85.1% interest (tonnes) | 563,000 | 5,668,000 | 49,000 | 485,000 | 612,000 | 6,153,000 | 174,000 | 1,787,000 |
Notes to Table 22,2
1. S-K 1300 definitions were followed for Mineral Resources.
2. The Qualified Person for this Mineral Resource estimate is Frederik Reidel, CPG
3. No Mineral Reserves have been estimated for this updated Mineral Resource Estimate.
4. The Mineral Resource Estimate is reported as lithium contained in brine in-situ.
5. The Mineral Resource Estimate is not a Mineral Reserve Estimate and does not have demonstrated economic viability. There is no certainty that all or any part of the Mineral Resources will be converted to Mineral Reserves. Inferred Resources have great uncertainty as to their existence and whether they can be mined economically.
6. A cut-off grade of 200 mg/l has been applied to the M+I+I resources estimates.
The cutoff grade is based on the various inputs and the formula blow:

Where:
Total Capital Expenditure= USS 1,781 million
Total Operating Expenditure = USS 6,020 million
Cost of Capital = USS 178 million (10 percent of Total Capital)
Total Brine Extracted = 628 Mm3
Conversion from Li to Li2CO3= 5.323
Projected LCE Price = USS 20,00 per metric ton of LCE
Export Duties =4.5%
Royalties= 3.0%
Calculated Recovery= 65%
Resulting in a calculated cut-off grade of 200 mg/l.
Factors that may affect the Brine Resource estimate include: locations of aquifer boundaries; lateral continuity of key aquifer zones; presence of fresh and brackish water which have the potential to dilute the brine in the wellfield area; the uniformity of aquifer parameters within specific aquifer units; commodity price assumptions; changes to hydrogeological, metallurgical recovery, and extraction assumptions; density assignments; and input factors used to assess reasonable prospects for eventual economic extraction. Currently, Mr. F. Reidel (the QP), does not know any environmental, legal, title, taxation, socio-economic, marketing, political, or other factors that would materially affect the current Resource estimate.
7. Numbers may not add due to rounding averaging.
8. The effective date is December 31, 2024.
|
Table 22.3 shows the mineral resources of the Pastos Grandes Project expressed as lithium carbonate equivalent (LCE) and potash (KCl).
Table 22.3 PGSA resources expressed as LCE and KCl
|
|
Measured |
Indicated | ||
|
LCE |
KCl |
LCE | KCL | |
|
Tonnes |
3,522,000 |
12,721,000 |
303,000 | 1,089,000 |
|
LAR 85.1% interest (tonnes) |
2,997,000 |
10,825,000 |
258,000 | 926,000 |
Notes to Table 22.3
1. Lithium is converted to lithium carbonate (Li2CO3) with a conversion factor of 5.32.
2. Potassium is converted to potash with a conversion factor of 1.91.
3. Numbers may not add due to rounding.
23 RECOMMENDATIONS
The following technical work is recommended to further advance the Project towards construction and into production.
• Incorporate the lithium resources hosted on the AMSA properties into the resource estimate for the Project so that these resources can be properly incorporated in the numerical groundwater flow and transport modeling for final brine production wellfield design, evaluation of potential environmental constraints, and the estimation of updated reserves.
• Carry out additional geophysical surveys on the AMSA properties to improve the understanding of the brine resource in the Salar and the marginal areas.
• Carry out a 30-day pumping test on AMSA production well PW-1 to characterize the southern extent of the lower brine aquifer.
• Carry out 30-day pumping tests in existing brine production wells PGPW18-15 and PGPW18-17 with water level monitoring in the above-mentioned new observations points.
• Carry out 7-day pumping test on water production wells PGMW19-2 and PGPW19-3 along with additional groundwater exploration work to secure future water supply requirements from freshwater resources within the Pastos Grandes and Sijes basins.
• Short-term numerical modelling efforts with the AMSA-developed 3D FEFLOW groundwater flow and transport model for the basin should focus on predictive simulations for the design and layout of the future brine production wellfield, evaluation of potential environmental effects, and the preparation of updated lithium reserves for the Project incorporating AMSA and Ganfeng properties.
|
• Longer term modeling efforts need to include incorporation of the new geological model, updated water balance information, recalibration and new predictive simulations for wellfield layout, updated reserve estimation, and the preliminary evaluation of potential Phase 2 implementation of DLE process technology and associated depleted brine management.
• Based on the results of the predictive model simulations drill and complete three additional brine production wells in the lower brine aquifer.
• Drill 7-10 deep exploration core holes aimed at increasing the lithium resource base of the Project.
• Drill 10-15 piezometers and 3-5 production wells to explore for groundwater resources in the Pastos Grandes and Sijes basins to meet water supply requirements for the future operation of the Project. The results of this groundwater exploration program need to be incorporated in the numerical groundwater flow model.
The estimated budget to complete and implement the above recommendations are shown in Table 23.1.
Table 23.1 Estimated budget for the 2025 brine resource evaluation program
| Item | Cost (USD)12 |
| Pumping tests on existing wells (3) | 360,000 |
| Infill resource drilling (3 holes) | 6,300,000 |
| Resource exploration drilling (7 holes) | 16,800,000 |
| Production drilling (8 holes) | 32,800,000 |
| Hydrogeological monitoring programs | 775,000 |
| Water supply investigation and development | 1,400,000 |
| Resource and reserve modelling and estimation | 500,000 |
| Geophysics (MT+GV+ERT) | 1,100,000 |
| Total | 60,035,000 |
12 Costs are estimated in US dollars Official BNA
|
24 REFERENCES
Allmendinger, R.W., Jordan, T.E., Kay, S.M., and Isacks, B.L., 1997, The Evolution of the Altiplano-Puna Plateau of the Central Andes: Annual Review of Earth and Planetary Science, v. 25, p. 139-174.
Pocitos, Provincia de Salta, República Argentina; Actas 70 Congresso Geológico Chileno, (1): 220-224, Concepción
Alonso, R. N., Viramonte J. G. Y Gutiérrez, R., 1984. Puna Austral. Bases para el Subprovincialismo Geologico de la Puna Argentina. Actas IX Congreso Geológico Argentino. I: 25- 41.
Alonso, R.N, 1986. Ocurrencia, posición estratigráfica y génesis de los depósitos de boratos de la Puna Argentina. Tesis doctoral. Universidad Nacional de Salta, 196 pp.
Alonso, R.N. and Gutierrez, R., 1986. Litoestratigrafía del Neógeno Terminal. Puna sudoriental argentina. Revista del Instituto de Ciencias GeoloÂgicas, 6, pp.29-47.
Alonso, R., Viramonte J., 1987. Geología y Metalogenia de la Puna. Estudios geológicos., 43: 393-407.
Alonso, R.N., Jordan, T.E., Tabbutt, K.T. and Vandervoort, D.S., 1991. Giant evaporite belts of the Neogene central Andes. Geology, 19(4), pp.401-404.
Alonso, R.N., 1992. Estratigrafía del Cenozoico de la cuenca de Pastos Grandes (Puna Salteña) con énfasis en la Formación. Revista de la Asociación Geológica Argentina, 47(2), pp.189-199.
Ausenco, 2018. Proyecto Pastos Grandes, Línea de Base Ambiental y Social, report prepared for Millennial Lithium Corporation, July 2018
Jordan, T.E. and Alonso, R.N., 1987. Cenozoic stratigraphy and basin tectonics of the Andes Mountains, 20-28 south latitude. AAPG Bulletin, 71(1), pp.49-64.
Bianchi, A. R., Yañez, C. E., & Acuña, L. R. 2005. Base de datos mensuales de precipitaciones del Noroeste Argentino. Instituto Nacional de tecnología Agropecuaria. Proyecto Riesgo Agropecuario, Convenio Específico, (3), 41.
Blasco, Graciela; Zappettini, Eduardo O. y Hongn, Fernando, 1996. San Antonio de los Cobres. Programa Nacional de Cartas Geológicas de la República Argentina 1:250.000. Hoja Geológica 2566-I. Provincias de Jujuy y de Salta. Boletín 217. Buenos Aires, Servicio Geológico Minero Argentino. Instituto de Geología y Recursos Minerales.
Bradley, D.C., Munk, L., Jochens, H., Hynek, S. and Labay, K., 2013. A preliminary deposit model for lithium brines. Reston, VA, USA: US Department of the Interior, US Geological Survey.
Cabrera, A.L., 1994. Regiones fitogeográficas argentinas. Enciclopedia Argentina de Agricultura y Jardinería, Tomo II, fascículo 1. Buenos Aires.
Cassel, D.K. and Nielsen, D.R., 1986. Field capacity and available water capacity. Methods of soil analysis: Part 1 Physical and mineralogical methods, 5, pp.901-926.
Cooper, H.H. and C.E. Jacob, 1946. A generalized graphical method for evaluating formation constants and summarizing well field history, Am. Geophys. Union Trans., vol. 27, pp. 526-534.
Custodio, E., & Llamas, M. 1983. Hidrología subterránea.
|
Domenico, P. A., & Schwartz, F. W. 1998. Physical and chemical hydrogeology (Vol. 506). New York: Wiley.
Dworzanowski, Marek, Mike Rosko, and Peter Ehren. 2018. Feasibility Study of the Pastos Grandes Project, Salta Province, Argentina, Technical Report No. 209020-00055-000-GE-TEN-0003 prepared to Canadian Standard NI43-101 for Millennial Lithium.
Eaton, A.D., Clesceri, L.S., Greenberg, A.E. and Franson, M.A.H., 1995. Standard methods for the examination of water and wastewater. American Public Health Association. Inc., Washington, DC.
Freeze, R. A. & Cherry, J. A., 1979. Groundwater. Prentice-Hall, Englewood, Cliffs, New Jersey, 604 pp.
Gorustovich, S.A., Monaldi, C.R. and Salfity, J.A., 2011. Geology and metal ore deposits in the Argentine Puna. Cenozoic geology of the central Andes of Argentina, pp.169-187.
Hains, D.H., Foutie, L.F. Technical Report on Pastos Grandes Project. Prepared for LSC Lithium Corporation. Dated October 25, 2018.
Houston, J. 2006. Evaporation in the Atacama Desert: An empirical study of spatio-temporal variations and their causes. Journal of Hydrology, 330(3-4), 402-412.
Houston, J. Technical Report on the Salinas Grandes-Guayatayoc Project, Jujuy-Salta Provinces, Argentina. NI 43-101 report prepared for Orocobre Ltd, April 30, 2010.
Houston, J. et al., 2011, The Evaluation of Brine Prospects and the Requirement for Modifications to Filing Standards, Economic Geology, 106, 1225-1239.
IANIGLA (Instituto Argentino de Nivología, Glaciología y Ciencias Ambientales). 2018. Inventario Nacional de Glaciares.
Ide, F. 1978. Cubicación del Yacimiento Salar de Atacama. Memoria de Título, Universidad de Chile, Departamento de Minería, 144 p.
Isacks, B., 1988. Uplift of the Central Andes and bending of the Bolivian orocline, Jour. Geophys. Res., 284, 3211-3231.
IUCN (International Union for Conservation of Nature), 2017. Red List of Threatened Species.
IUCN (International Union for Conservation of Nature), 2019. Red List of Threatened Species.
Jordan, T.E. and Alonso, R.N., 1987. Cenozoic stratigraphy and basin tectonics of the Andes Mountains, 20-28 south latitude. AAPG Bulletin, 71(1), pp.49-64.
Jordan, T. E., & Gardewege, M. 1989. Tectonic evolution of the late Cenozoic central Andes (20-33 S). In The Evolution of the Pacific Ocean Margins (pp. 193-207).
Ministerio de Ambiente y Desarrollo Sustentable de Argentina (MAyDS), 2017. Categorización de las Aves de la Argentina (AA). Informe del Ministerio de Ambiente y Desarrollo Sustentable de la Nación y de Aves Argentinas, edición electrónica. C. A. Buenos Aires, Argentina.
MOSA, Methods of Soil Analysis, 2002. American Society of Agronomy, Madison, Wisconsin; Part 4.
Montgomery & Associates (M&A). 2018. Salar de Pastos Grandes Water Balance. Pastos Grandes Project, Salta, Argentina. Prepared for Millennial Lithium Corp.
|
Montgomery & Associates (M&A). 2019. Phase III, Measured, Indicated, and Inferred Lithium and Potassium Resource Estimate, Pastos Grandes Project, Salta Province, Argentina. NI 43-101 report prepared for Millennial Lithium Corporation.
Nicolli, H.B., Suriano, J.M., Kimsa, J.F., and Brodtkorb, A. 1982. Geochemical characteristics of brines in evaporitic basins, Argentinian Puna; Academia Nacional de Ciencias, Miscelanea No. 64, Cordoba, Argentina.
Nwankwor, G.I., Cherry, J.A. and Gillham, R.W., 1984. A comparative study of specific yield determinations for a shallow sand aquifer. Groundwater, 22(6), pp.764-772.
Ojeda, R.A., Chillo V. y Díaz G.B., 2015. Libro Rojo de Mamíferos Amenazados de la Argentina Mamíferos de Argentina. Sistemática y Distribución. Sociedad Argentina para el estudio de los Mamíferos (SAREM) editores. 257 p
Ritzi Jr, R.W., Jayne, D.F., Zahradnik Jr, A.J., Field, A.A. and Fogg, G.E., 1994. Geostatistical modeling of heterogeneity in glaciofluvial, buried‐valley aquifers. Groundwater, 32(4), pp.666-674.
Secretaría de Ambiente y Desarrollo Sustentable (SAyDS), 2013. Resolución N°1055/2013: Clasificación del Estado de Conservación de Especies y Subespecies de Anfibios y Reptiles Nativos.
Seggiaro, R., Hongn F., Castillo A., Pereyra F., Villegas D. y Martínez L., 2006. Hoja Geológica 2769-II, Paso San Francisco. (1:250.000). Programa Nacional de Cartas Geológicas. Instituto de Geología y Recursos Minerales, SEGEMAR. Boletín 294, 54 pp. Buenos Aires.
Stormont, J. C., Hines, J. S., O'Dowd, D. N., Kelsey, J. A., & Eric Pease, R., 2011. A Method to Measure the Relative Brine Release Capacity of Geologic Material. ASTM Geotechnical Testing Journal, 34(5), 406-412.
Theis, C.V., 1935. The relation between the lowering of the piezometric surface and the rate and duration of discharge of a well using groundwater storage, Am. Geophys. Union Trans., vol. 16, pp. 519-524.
Turner, J.M., 1960 Estratigrafía de la Sierra Santa Victoria y adyacencias. Academia Nacional de Ciencias. Boletín 41,2: 163-196.
Turner, J.M., 1964 Descripción Geológica de la Hoja 7C- Nevado de Cachi (Provincia de Salta). Dirección Nacional de Geología y Minería. Boletín 99, 78 p. Buenos Aires.
Turner, J.E., 1972. Puna. Geología Regional Argentina, Tomo 1: 13-56.
Vandervoort, D.S., Jordan, T.E., Zeitler, P.K., Alonso, R.N., 1995. Chronology of internal drainage development and uplift, Southern Puna plateau, Argentine Central Andes. Geology, 23(2), 145-148.
Yao, T.M., Milczarek, M., Reidel, F., Daniel Weber, P.G. and Brooker, M., A New Rapid Brine Release Extraction Method in Support of Lithium Brine Resource Estimation.
|
25. RELIANCE ON INFORMATION SUPPLIED BY REGISTRANT
The QP has relied on information provided by LAR (the registrant), including expert reports, in preparing its findings and conclusions with respect to this report.
The QP considers it reasonable to rely on LAR for this information; LAR has obtained opinions from appropriate experts with regard to such information.
The QP has relied upon the following categories of information derived from LAR and legal experts retained by LAR and have listed the sections of this report where such information was relied upon:
• Ownership of the Project area and any underlying mineral tenure, surface rights, or royalties in Section 3.3, 3.4 and, 3.5.
• All information reqarding project infrastructure requirements reported in Section 15.
• The entire market studies and contracts reported in Section 16.
• Baseline survey data collected related to social and economic impacts in Section 17.1.
• Social and community impacts assessments for the Project in Section 17.3.
• Capital and operating costs reported in Sections 18.1 and 18.2.
• The entire economic analysis presented in Section 19.
|
26. SIGNATURE PAGE
CERTIFICATE OF AUTHOR
I, Frederik Reidel, Geophysician and Hydrologist, Managing Director of Atacama Water SpA do hereby certify that:
1. I am currently employed as Managing Director of Atacama Water SpA located in Balcarce 175 Office 303 Salta, Argentina.
2. This certificate applies to the Technical Report titled "SEC Technical Report Summary, Pastos Grandes Project, Lithium Resource Estimate, Salta Provine, Argentina" the ("Technical Report") prepared for Lithium Argentina Corporation ("the Issuer" or "LAR"), which has an effective date of December 31, 2024.
3. Lithium Argentina Corporation, the registrant, engaged the services of Atacama Water SpA, to prepare the individual Technical Report Summary on their property using data gathered by the Qualified Person ("QP") to the disclosure requirements for mining registrants promulgated by the United States Securities and Exchange Commission (SEC), in accordance with the requirements contained in the S-K §229.1300 to S-K §229.1305 regulations. The property is considered material to Lithium Argentina Corporation.
4. This report has an effective as-of date of December 31, 2024. The valuable material will be mined through brine extraction mining methods by the proprietor.
5. I am a graduate of New Mexico Institute of Mining and Technology. I am a professional in the discipline of Geology and am a Certified Professional Geologist (# 11454) with the American Institute of Professional Geologist (AIPG) and Competent Person (# 390) with the Chilean Mining Commission (CCCRRM), and co-author of "Complementary Guidelines for Mineral Resource and Reserve Estimation in Brines" for Chilean Code CH 20.235. I have practiced my profession continuously since 1987. I have read the definition of ''qualified person'' set out in S-K §229.1300 and certify that by reason of my education, affiliation with a professional association, and past relevant work experience, I fulfill the requirements to be a ''qualified person'' for the purposes of S-K §229.1300 reporting.
6. I completed my most recent personal inspection of the Property during November 2024.
7. I am responsible for all sections of the Technical Report Summary.
8. I am independent of the Issuer and related companies applying all of the sections of the S-K §229.1300.
9. I have had prior involvement with the Pastos Grandes project.
10. As of the effective date of the Technical Report Summary and the date of this certificate, to the best of my knowledge, information, and belief, this Technical Report Summary contains all scientific and technical information that is required to be disclosed to make the Technical Report not misleading.
|
Signing Date: June 24, 2025
________________________________________________________
Frederik Reidel
Managing Director of Atacama Water SpA
American Institute of Professional Geologist (AIPG) - Certified Professional Geologist (# 11454)
Chilean Mining Commission (CCCRRM) - Competent Person (# 390)
CONSENT OF FREDERIK REIDEL
June 27, 2025
VIA EDGAR
United States Securities and Exchange Commission
| Re: | Lithium Argentina AG (the "Company") |
| Amendment No. 1 to the Annual Report on Form 20-F of the Company for the year ended December 31, 2024 (the "Form 20-F/A") |
I, Frederik Reidel, hereby consent to the use of my name in connection with reference to my involvement in the preparation of the following technical report (the "Technical Report"):
- Technical Report titled "SEC Technical Report Summary, Pastos Grandes Project Lithium Resource Estimate, Salta Province, Argentina" with an effective date of December 31, 2024;
and to references to the Technical Report, or portions thereof, included or incorporated by reference in the Form 20-F/A, which is being filed pursuant to the Securities Exchange Act of 1934, as amended, and to the inclusion or incorporation by reference of the information derived from the Technical Report related to me in the Form 20-F/A, including any quotation from or summarization of the Technical Report. This consent extends to any amendments to the Form 20-F/A.
I also hereby consent to the use of my name in connection with reference to my involvement in the preparation of the Technical Report, to references to the Technical Report, or portions thereof, and to the inclusion or incorporation by reference of the information derived from the Technical Report, including any quotation from or summarization of the Technical Report, related to me in the registration statements (No. 333-238142, No. 333-227816, and No. 333-282163) on Form S-8. This consent extends to any amendments to the Form S-8s, including post-effective amendments, and any new Form S-8 registration statement filed by the Company incorporating by reference the Form 20-F/A.
I further consent to the filing of the Technical Report as an exhibit to the Form 20-F/A.
| /s/ Frederik Reidel | ||
| Frederik Reidel, CPG |
CONSENT OF ATACAMA WATER SPA
June 27, 2025
VIA EDGAR
United States Securities and Exchange Commission
| Re: | Lithium Argentina AG (the "Company") |
| Amendment No. 1 to the Annual Report on Form 20-F of the Company for the year ended December 31, 2024 (the "Form 20-F/A") |
Atacama Water SpA hereby consents to the use of its name in connection with reference to its involvement in the preparation of the following technical report (the "Technical Report"):
- Technical Report titled "SEC Technical Report Summary, Pastos Grandes Project Lithium Resource Estimate, Salta Province, Argentina" with an effective date of December 31, 2024;
and to references to the Technical Report, or portions thereof, included or incorporated by reference in the Form 20-F/A, which is being filed pursuant to the Securities Exchange Act of 1934, as amended, and to the inclusion or incorporation by reference of the information derived from the Technical Report related to the undersigned in the Form 20-F/A, including any quotation from or summarization of the Technical Report. This consent extends to any amendments to the Form 20-F/A.
The undersigned also hereby consents to the use of its name in connection with reference to its involvement in the preparation of the Technical Report, to references to the Technical Report, or portions thereof, and to the inclusion or incorporation by reference of the information derived from the Technical Report, including any quotation from or summarization of the Technical Report, related to the undersigned in the registration statements (No. 333-238142, No. 333-227816, and No. 333-282163) on Form S-8. This consent extends to any amendments to the Form S-8s, including post-effective amendments, and any new Form S-8 registration statement filed by the Company incorporating by reference the Form 20-F/A.
The undersigned further consents to the filing of the Technical Report as an exhibit to the Form 20-F/A.
Atacama Water SpA
| /s/ Frederik Reidel | ||
| Name: Frederik Reidel | ||
| Title: Managing Director |

CONSENT OF INDEPENDENT AUDITORS
We hereby consent to the incorporation by reference in the Registration Statement on Form S-8 (No. 333-282163) of Lithium Argentina AG of our report dated June 26, 2025 relating to the financial statements of Minera Exar S.A. which appears in this Form 20-F/A.
| /s/ PRICE WATERHOUSE & CO. S.R.L. | |
| /s/ Raúl Leonardo Viglione | |
| Buenos Aires, Argentina | |
| June 27, 2025 |
Price Waterhouse & Co. S.R.L., Bouchard 557, 8th floor, C1106ABG - Autonomous City of
Buenos Aires, Argentina
T: +(54.11) 4850.0000, www.pwc.com/ar