UNITED STATES
SECURITIES AND EXCHANGE COMMISSION
Washington, D.C. 20549
Form 6-K
REPORT OF FOREIGN PRIVATE ISSUER
PURSUANT TO RULE 13a-16 OR 15d-16
UNDER THE SECURITIES EXCHANGE ACT OF 1934
For the month of: March 2026
Commission file number: 001-38350
Lithium Argentina AG
(Translation of Registrant’s name into English)
Dammstrasse 19, 6300 Zug,
Switzerland
(Address of Principal Executive Office)
900 West Hastings Street, Suite 310,
Vancouver, British Columbia,
Canada V6C 1E5
(North American Mailing Address)
Indicate by check mark whether the registrant files or will file annual reports under cover:
Form 20-F x Form 40-F ¨
SIGNATURE
Pursuant to the requirements of the Securities Exchange Act of 1934, the registrant has duly caused this report to be signed on its behalf by the undersigned, thereunto duly authorized.
| Lithium Argentina AG | ||
| (Registrant) | ||
| By: | “Samuel Pigott” | |
| Name: | Samuel Pigott | |
| Title: | Chief Executive Officer | |
Dated: March 20, 2026
EXHIBIT INDEX
| Exhibit | Description | |
| 99.1 | 2026 Cauchari-Olaroz S-K 1300 Technical Report Jujuy Province, Argentina, dated effective December 31, 2025 |
Exhibit 99.1

2026 Cauchari-Olaroz S-K 1300 Technical Report
Jujuy Province, Argentina
 |
 |
 |
|

Prepared by:
David Burga, P.Geo.
Mark King, PhD, P.Geo., FGC
Anthony Sanford, Pr.Sci.Nat.
Marek Dworzanowski, EUR ING, CEng.
Jonathan Gibson, P.Eng.
Alexander Cushing, PhD, MFin, P.Eng.
Effective Date: February 27, 2026
Filing Date: March 19, 2026
Table of Contents
| Certificates | 1 | ||||
| 1.0 | Executive Summary | 13 | |||
| 1.1 | Introduction | 13 | |||
| 1.2 | Property Description, Location, Access and History | 13 | |||
| 1.3 | Geological Setting and Deposit Types | 15 | |||
| 1.4 | Mineralization | 16 | |||
| 1.5 | Exploration and Drilling | 16 | |||
| 1.6 | Mineral Processing and Metallurgical Testing | 17 | |||
| 1.6.1 | Continuing Work Plan for Supporting the Plant Operations | 18 | |||
| 1.7 | Mineral Resources and Mineral Reserves | 18 | |||
| 1.7.1 | Discussion of Mineral Resource and Mineral Reserve Cut-off Grade | 21 | |||
| 1.8 | Mining Methods | 22 | |||
| 1.8.1 | Brine Processing | 22 | |||
| 1.8.2 | Lithium Carbonate Plant Production | 22 | |||
| 1.9 | Site Infrastructure and Buildings | 24 | |||
| 1.9.1 | Wells | 24 | |||
| 1.9.1.1 | Well Production Equipment Selection | 24 | |||
| 1.9.2 | Evaporation Ponds | 24 | |||
| 1.9.3 | Salt Harvest Equipment | 24 | |||
| 1.9.4 | Site Infrastructure and Support Systems | 25 | |||
| 1.9.4.1 | Natural Gas Pipeline | 25 | |||
| 1.9.4.2 | Power Supply | 25 | |||
| 1.9.4.3 | Permanent Camp | 25 | |||
| 1.9.4.4 | Other Buildings | 26 | |||
| 1.9.4.5 | Security | 26 | |||
| 1.9.4.6 | Access and Site Roads | 26 | |||
| 1.9.4.7 | Fuel Storage | 26 | |||
| 1.9.4.8 | Water Supply | 26 | |||
| 1.9.4.9 | Pond Solid Wastes | 27 | |||
| 1.9.4.10 | Tailings Liquid Disposal | 27 | |||
| 1.10 | Market Studies and Contracts | 27 | |||
| 1.11 | Permitting, Environmental Studies and Social or Community Impact | 27 | |||
| 1.11.1 | Permits and Authorities | 27 | |||
| 1.11.2 | Social or Community Impact | 28 | |||
| 1.11.3 | Environmental Baseline Studies | 28 | |||
| 1.12 | Capital and Operating Cost Estimate | 29 | |||
| 1.12.1 | Capital Cost Estimate | 29 | |||
| 1.12.2 | Exclusions | 30 | |||
| 1.12.3 | Currency | 30 | |||
| 1.12.4 | Operating Cost Estimate | 30 | |||
| 1.12.5 | Sustaining Capital Expenditures (Sustaining CAPEX) | 31 | |||
| 1.13 | Conclusions and Recommendations | 32 | |||
| 1.13.1 | Conclusions | 32 | |||
| 1.13.2 | Recommendations | 33 | |||
| 2.0 | Introduction | 34 | |||
| 2.1 | Terms of Reference | 34 | |||
| 2.2 | Qualified Persons Site Visits | 34 | |||
Lithium Argentina AG., 2026 Cauchari-Olaroz S-K 1300 Technical Report Cauchari-Olaroz Salars, Argentina | Page i |
| 2.3 | Sources of Information | 34 | ||
| 2.4 | Units and Currency | 35 | ||
| 3.0 | Property Description and Location | 41 | ||
| 3.1 | Property Description | 41 | ||
| 3.2 | Property Area | 43 | ||
| 3.3 | SQM Joint Venture | 51 | ||
| 3.4 | Ganfeng Joint Venture | 51 | ||
| 3.4.1 | Los Boros Option Agreement | 51 | ||
| 3.4.2 | Borax Argentina S.A. Agreement | 52 | ||
| 3.4.3 | JEMSE Arrangement | 52 | ||
| 3.4.4 | Corporate History of LAR | 53 | ||
| 3.5 | Type of Mineral Tenure | 53 | ||
| 3.6 | Property Boundaries | 54 | ||
| 3.7 | Environmental Liabilities | 54 | ||
| 3.8 | Permits | 55 | ||
| 3.9 | Neigbouring Communities | 59 | ||
| 4.0 | Accessibility, Climate, Local Resources, Infrastructure, and Physiography | 60 | ||
| 4.1 | Topography | 60 | ||
| 4.2 | Access | 60 | ||
| 4.3 | Population | 60 | ||
| 4.4 | Climate | 62 | ||
| 4.5 | Precipitation | 63 | ||
| 4.6 | Temperature | 65 | ||
| 4.7 | Relative Humidity | 68 | ||
| 4.8 | Atmospheric Pressure | 69 | ||
| 4.9 | Winds | 70 | ||
| 4.10 | Solar Radiation | 77 | ||
| 4.11 | Air Quality | 81 | ||
| 4.12 | Noise | 86 | ||
| 5.0 | History | 90 | ||
| 6.0 | Geological Setting, Mineralization and Deposit | 93 | ||
| 6.1 | Regional Structural and Volcanic Features | 93 | ||
| 6.2 | Regional Geology | 95 | ||
| 6.3 | Geology of the Olaroz and Cauchari Salars | 96 | ||
| 6.3.1 | Conceptual Geology | 96 | ||
| 6.4 | Salar Surface Sediments and Mineralization | 96 | ||
| 6.5 | Salar Lithostratigraphic Units | 98 | ||
| 6.5.1 | Sedimentation Cycles | 100 | ||
| 6.5.2 | Sedimentary Facies Analysis and In-filling History | 100 | ||
| 6.6 | Surface Water | 108 | ||
| 6.7 | Mineralization | 110 | ||
| 6.8 | Deposit Types | 111 | ||
| 7.0 | Exploration | 115 | ||
| 7.1 | Overview | 115 | ||
| 7.2 | Surface Brine Program | 115 | ||
| 7.3 | Seismic Geophysical Program | 116 | ||
| 7.4 | Gravity Survey | 119 | ||
| 7.5 | TEM Survey | 123 | ||
| 7.6 | Vertical Electrical Sounding Survey (VES) | 131 | ||
Lithium Argentina AG., 2026 Cauchari-Olaroz S-K 1300 Technical Report Cauchari-Olaroz Salars, Argentina | Page ii |
| 7.7 | 2019 Vertical Electrical Sounding Survey (VES) | 138 | ||
| 7.8 | 2020 Vertical Electrical Sounding Survey (VES) | 142 | ||
| 7.9 | 2021 Vertical Electrical Sounding Survey (VES) | 146 | ||
| 7.10 | 2024 Vertical Electrical Sounding Survey (VES) | 147 | ||
| 7.11 | Boundary Investigation | 149 | ||
| 7.12 | Surface Water Monitoring Program | 152 | ||
| 7.13 | Brine Level Monitoring Program | 161 | ||
| 7.14 | Pumping Test Program | 167 | ||
| 7.14.1 | Overview | 167 | ||
| 7.15 | Chemistry of Samples Collected During Pump Tests | 169 | ||
| 7.16 | Drilling | 171 | ||
| 7.16.1 | Reverse Circulation (RC) Borehole Program 2009-2010 | 171 | ||
| 7.16.2 | Diamond Drilling (DDH) Borehole Program 2009-2010 | 176 | ||
| 7.16.3 | Diamond Drilling (DDH) Borehole Program 2017-2019 | 177 | ||
| 7.16.4 | Production Well Drilling | 186 | ||
| 7.16.5 | Exploration Diamond Drilling (DDH) Borehole and Production Well Drilling Program 2022-2024 | 193 | ||
| 7.16.6 | Conclusion | 193 | ||
| 8.0 | Sample Preparation, Analyses and Security | 200 | ||
| 8.1 | Sampling Method and Approach | 200 | ||
| 8.2 | Rotary Drilling Sampling Methods | 200 | ||
| 8.3 | Diamond Drilling Borehole Solids Sampling Methods | 201 | ||
| 8.4 | Diamond Drilling Borehole Brine Sampling Methods | 203 | ||
| 8.5 | Sampling Preparation, Analysis and Security | 203 | ||
| 8.5.1 | Brine Samples from the Piezometers | 203 | ||
| 8.5.2 | Brine Samples from the Pumping Test Program | 204 | ||
| 8.6 | Brine Analysis | 205 | ||
| 8.6.1 | Analytical Methods | 205 | ||
| 8.6.2 | Sample Security | 206 | ||
| 8.7 | Sample Preparation Analysis and Security Conclusions and Recommendations | 206 | ||
| 8.8 | Geotechnical Analysis | 206 | ||
| 8.8.1 | Overview | 206 | ||
| 8.9 | Analytical Methods | 207 | ||
| 8.9.1 | Specific Gravity | 207 | ||
| 8.9.2 | Relative Brine Release Capacity (RBRC) | 207 | ||
| 8.9.3 | Particle Size Analysis | 208 | ||
| 8.9.4 | Exar Porosity Test Lab | 208 | ||
| 9.0 | Data Verification | 209 | ||
| 9.1 | Overview | 209 | ||
| 9.2 | Site Visits | 209 | ||
| 9.3 | February 2019 Site Visit and Due Diligence Sampling | 210 | ||
| 9.4 | June 2019 Site Visit and Due Diligence Sampling | 212 | ||
| 9.5 | Quality Assurance/Quality Control Program | 213 | ||
| 9.6 | Performance of Blank Samples | 214 | ||
| 9.7 | Certified Reference Materials | 215 | ||
| 9.8 | Duplicates | 220 | ||
| 9.9 | Check Assays Exar Versus Alex Stewart | 220 | ||
| 9.10 | 2024 QA/QC Procedures | 222 | ||
| 9.11 | Conclusions and Recommendations | 223 | ||
Lithium Argentina AG., 2026 Cauchari-Olaroz S-K 1300 Technical Report Cauchari-Olaroz Salars, Argentina | Page iii |
| 10.0 | Mineral Processing and Metallurgical Testing | 225 | |||
| 10.1 | Pond Tests – Universidad De Antofagasta, Chile | 226 | |||
| 10.2 | Tests – Exar, Cauchari Salar | 228 | |||
| 10.2.1 | Salar de Cauchari Evaporation Pan and Pilot Pond Testing | 228 | |||
| 10.2.1.1 | Pond Pilot Testing | 228 | |||
| 10.2.2 | 2017 Evaporation Tests | 229 | |||
| 10.2.3 | Liming Tests – Exar, Cauchari Salar | 230 | |||
| 10.3 | Solvent Extraction Tests – SGS Minerals and IIT, Universidad de Concepción | 232 | |||
| 10.4 | Carbonation Tests – SGS Minerals (Canada) | 234 | |||
| 10.5 | Pilot Purification Testing – SGS Minerals | 234 | |||
| 10.5.1 | Lithium Carbonate Precipitation | 237 | |||
| 10.6 | Recent Testing Work Performed in the Pilot Plant | 238 | |||
| 10.6.1 | Monitoring the Consumption of Lime Reagent in the Liming Plant | 238 | |||
| 10.6.2 | Lithium Losses in the Secondary Purification Filter Cake | 241 | |||
| 10.6.3 | SO₄²⁻ Adsorption During Li₂CO₃ Precipitation | 242 | |||
| 10.6.4 | Effect of Salinity on Organic Adsorption | 242 | |||
| 10.7 | Recent Work Performed in External Laboratories | 243 | |||
| 10.8 | Continuing Work Plan for Supporting the Plant Operations | 243 | |||
| 11.0 | Mineral Resource Estimates | 245 | |||
| 11.1 | Overview | 245 | |||
| 11.1.1 | Statement for Brine Mineral Prospects and Related Terms | 247 | |||
| 11.2 | Mineral Resource Estimate Methodology | 249 | |||
| 11.2.1 | Most Recent Previous Mineral Resource Estimate (Burga et al., 2025) | 249 | |||
| 11.2.2 | Background of the Current M Hydrostratigraphic Model | 250 | |||
| 11.2.3 | Hydrostratigraphic Units | 252 | |||
| 11.2.4 | Specific Yield | 254 | |||
| 11.2.5 | Lithium Grade | 256 | |||
| 11.2.6 | Mineral Resource Block Model Variography, Methods, and Validation | 255 | |||
| 11.2.7 | Resource Classification | 263 | |||
| 11.3 | 2026 Mineral Resource Statement | 266 | |||
| 11.4 | Reasons for Differences from Previous Estimate (Burga, 2025) | 267 | |||
| 11.5 | Confidence in the Mineral Resource Estimate | 270 | |||
| 12.0 | Mineral Reserve Estimate | 271 | |||
| 12.1 | Background | 271 | |||
| 12.2 | Overview | 272 | |||
| 12.3 | Conceptual Model | 273 | |||
| 12.4 | Numerical Model Construction | 274 | |||
| 12.5 | Numerical Model Mesh | 275 | |||
| 12.6 | Numerical Model Boundary Conditions | 277 | |||
| 12.6.1 | Overview | 277 | |||
| 12.6.2 | Zero flow | 278 | |||
| 12.6.3 | Recharge | 278 | |||
| 12.6.4 | Evaporation | 281 | |||
| 12.6.5 | Archibarca Zone | 283 | |||
| 12.7 | Hydraulic Properties | 285 | |||
| 12.8 | Pre-Development Model Conditions | 288 | |||
| 12.9 | Transient Model Calibration | 292 | |||
Lithium Argentina AG., 2026 Cauchari-Olaroz S-K 1300 Technical Report Cauchari-Olaroz Salars, Argentina | Page iv |
| 12.10 | 2026 Mineral Reserve Estimate Model Results | 297 | |||
| 12.11 | Statement for Lithium Mineral Reserve Estimate | 302 | |||
| 12.12 | Reasons for Differences from Previous Estimate (Burga, 2025) | 304 | |||
| 12.13 | Relative Accuracy in Mineral Reserve Estimate | 305 | |||
| 13.0 | Mining Methods | 307 | |||
| 13.1 | Production Wellfield | 307 | |||
| 13.2 | Brine Production Uncertainties, Limitations, and Risk Assessment | 307 | |||
| 13.3 | Well Utilization | 309 | |||
| 13.3.1 | Well Utilization 2018 to 2025 | 309 | |||
| 14.0 | Processing and Recovery Methods (Brine Processing) | 314 | |||
| 14.1 | General | 314 | |||
| 14.2 | Process Description | 314 | |||
| 14.2.1 | Process Block Diagram | 314 | |||
| 14.3 | Brine Concentration Process Description | 315 | |||
| 14.3.1 | Pond Surface Area | 315 | |||
| 14.3.2 | Pond Design | 316 | |||
| 14.3.3 | Pond Layout | 319 | |||
| 14.3.4 | Pond Transfer System | 319 | |||
| 14.3.5 | Salt Harvesting | 320 | |||
| 14.3.6 | Impurity Reduction-Liming | 320 | |||
| 14.4 | Lithium Plant Process Description | 321 | |||
| 14.4.1 | Solvent Extraction for Boron Removal | 323 | |||
| 14.4.2 | Purification Process | 325 | |||
| 14.4.2.1 | Primary Purification – Magnesium and Sulphate Reduction | 325 | |||
| 14.4.2.2 | Secondary Purification – Calcium and Sulphates Removal | 326 | |||
| 14.4.2.3 | Primary IX | 327 | |||
| 14.4.2.4 | Carbonate Removal | 328 | |||
| 14.4.3 | Evaporation and KCl Crystallization Stage | 329 | |||
| 14.4.3.1 | Secondary IX Polishing | 330 | |||
| 14.4.4 | Lithium Carbonate Crystallization and Recovery | 331 | |||
| 14.4.4.1 | Mother Liquor Handling | 333 | |||
| 14.4.5 | Lithium Carbonate Drying, Micronization and Packaging | 333 | |||
| 14.5 | Reagents | 335 | |||
| 14.6 | Plant Design Basis | 336 | |||
| 14.7 | Process Configuration Update | 337 | |||
| 15.0 | Project Infrastructure | 338 | |||
| 15.1 | Main Facilities Location | 338 | |||
| 15.2 | Brine Extraction | 338 | |||
| 15.2.1 | Brine Extraction Wells | 338 | |||
| 15.2.2 | Well Pumps | 338 | |||
| 15.2.3 | Additional Equipment in the Wellfield | 339 | |||
| 15.2.4 | Wellfield Electric Power Distribution | 339 | |||
| 15.3 | Evaporation Ponds | 339 | |||
| 15.4 | Salt Harvest Equipment | 341 | |||
| 15.5 | Liming Stage | 341 | |||
| 15.5.1 | Quick Lime Reception | 341 | |||
| 15.5.2 | Liming System | 342 | |||
| 15.6 | Lithium Carbonate Plant | 342 | |||
| 15.6.1 | Process Facilities | 342 | |||
Lithium Argentina AG., 2026 Cauchari-Olaroz S-K 1300 Technical Report Cauchari-Olaroz Salars, Argentina | Page v |
| 15.6.1.1 | Boron Removal - Solvent Extraction | 343 | |||
| 15.6.1.2 | Brine Purification | 344 | |||
| 15.6.1.3 | Primary Treatment | 344 | |||
| 15.6.1.4 | Secondary Treatment | 344 | |||
| 15.6.1.5 | Primary IX | 344 | |||
| 15.6.1.6 | Brine Concentration and Na/K Reduction | 345 | |||
| 15.6.1.7 | Feed Preheat | 345 | |||
| 15.6.1.8 | Multiple-Effect Evaporation and Crystallization | 345 | |||
| 15.6.1.9 | Flash-Cooled Crystallization | 345 | |||
| 15.6.1.10 | Process Condensate Collection | 345 | |||
| 15.6.1.11 | Mg/Ca Polishing IX | 345 | |||
| 15.6.2 | Lithium Carbonate Production | 345 | |||
| 15.6.2.1 | Carbonation | 345 | |||
| 15.6.2.2 | Final Product | 346 | |||
| 15.6.3 | Plant Wide Instrumentation | 346 | |||
| 15.7 | Supporting Services | 346 | |||
| 15.7.1 | Fresh Water | 346 | |||
| 15.7.2 | Sanitary Services | 347 | |||
| 15.7.3 | Diesel Fuel | 347 | |||
| 15.8 | Permanent Camp | 347 | |||
| 15.8.1 | Other Buildings | 349 | |||
| 15.8.2 | Security | 349 | |||
| 15.9 | Off-Site Infrastructure and Support Systems | 349 | |||
| 15.9.1 | Natural Gas Pipeline | 349 | |||
| 15.9.2 | Electrical Power Supply | 350 | |||
| 15.9.3 | Water Pipeline | 350 | |||
| 15.9.4 | Control Systems and Instrumentation | 350 | |||
| 15.9.4.1 | Control and Data Building | 350 | |||
| 15.9.4.2 | Telecommunications System | 351 | |||
| 15.9.4.3 | Control System | 351 | |||
| 15.9.4.4 | Other Systems | 352 | |||
| 16.0 | Market Studies | 353 | |||
| 16.1 | Lithium Demand | 353 | |||
| 16.2 | Lithium Supply | 355 | |||
| 16.3 | Price Forecast | 358 | |||
| 16.4 | Offtake Contracts | 359 | |||
| 17.0 | Environmental Studies, Permitting, and Plans, Negotiations, or Agreements with Local Individuals or Groups | 360 | |||
| 17.1 | Executive Summary | 360 | |||
| 17.2 | Introduction | 360 | |||
| 17.3 | Environmental Studies | 361 | |||
| 17.3.1 | Executive Summary | 361 | |||
| 17.3.2 | Objective | 361 | |||
| 17.3.3 | Baseline Studies | 362 | |||
| 17.3.3.1 | Sources of Baseline Data | 362 | |||
| 17.3.3.2 | Methods Used for Data Collection | 362 | |||
| 17.3.4 | Environmental Impacts | 364 | |||
| 17.3.4.1 | Potential Sources of Impacts | 364 | |||
| 17.3.4.2 | Impact Evaluation Framework | 364 | |||
| 17.3.4.3 | Overview of Observed Impacts | 365 | |||
Lithium Argentina AG., 2026 Cauchari-Olaroz S-K 1300 Technical Report Cauchari-Olaroz Salars, Argentina | Page vi |
| 17.3.4.4 | Air Quality Impacts | 365 | |||
| 17.3.4.5 | Noise Impacts | 365 | |||
| 17.3.4.6 | Surface Water Quality Impacts | 365 | |||
| 17.3.4.7 | Groundwater Quality Impacts | 365 | |||
| 17.3.4.8 | Soil Quality Impacts | 365 | |||
| 17.3.4.9 | Biological Environment – Impact Overview | 365 | |||
| 17.3.4.10 | Conclusions | 365 | |||
| 17.3.5 | Monitoring Programs | 365 | |||
| 17.3.6 | Environmental Management Plan | 366 | |||
| 17.3.6.1 | Purpose of the EMP | 366 | |||
| 17.3.6.2 | Key Components of the EMP | 366 | |||
| 17.3.6.3 | Compliance with Regulations and Standards | 367 | |||
| 17.3.6.4 | Monitoring and Reporting | 368 | |||
| 17.3.6.5 | Adaptive Management and Continuous Improvement | 368 | |||
| 17.3.6.6 | Conclusions | 368 | |||
| 17.3.6.7 | Recommendations | 369 | |||
| 17.4 | Permitting | 369 | |||
| 17.4.1 | Executive Summary | 369 | |||
| 17.4.2 | Legal Framework | 370 | |||
| 17.4.2.1 | Permits for Exploration | 370 | |||
| 17.4.2.2 | Permits for Exploitation | 370 | |||
| 17.4.2.3 | Recent Legislation Updates | 370 | |||
| 17.4.3 | Framework Legal Study | 371 | |||
| 17.4.4 | Exploration Phase Permits for Project | 372 | |||
| 17.4.5 | Exploitation Phase Permits for Project | 373 | |||
| 17.4.6 | Water Permits | 375 | |||
| 17.4.7 | Provincial Regulations | 376 | |||
| 17.4.8 | Compliance Documentation | 376 | |||
| 17.4.9 | Permit Risks | 376 | |||
| 17.5 | Social or Community Impact | 377 | |||
| 17.5.1 | Executive Summary | 377 | |||
| 17.5.2 | Social Baseline Context and Re-Characterization – Operations Phase | 377 | |||
| 17.5.3 | Evaluation of Social Impacts – Operations Phase | 377 | |||
| 17.5.3.1 | Employment and Workforce Integration | 378 | |||
| 17.5.3.2 | Local Procurement and Economic Inclusion | 378 | |||
| 17.5.3.3 | Community Relations and Participation | 378 | |||
| 17.5.3.4 | Grievances and Social Risk Management | 379 | |||
| 17.5.3.5 | Cultural and Social Cohesion | 379 | |||
| 17.5.4 | Social Impact Management and Transition to Operations | 379 | |||
| 17.5.5 | Integration of Community Co-Creation Principles and Social Closure | 380 | |||
| 17.5.6 | Conclusions | 380 | |||
| 17.6 | Closure and Reclamation Plans | 380 | |||
| 17.6.1 | Key Closure Requirements and Commitments (Pre-2023) | 381 | |||
| 17.6.1.1 | Closure Objectives | 381 | |||
| 17.6.1.2 | Financial Assurance | 381 | |||
| 17.6.1.3 | Post-Closure Monitoring | 382 | |||
| 17.6.2 | New Requirements (Decree No. 7751-DEyP-2023) | 382 | |||
| 17.6.2.1 | Closure Objectives | 382 | |||
| 17.6.2.2 | Financial Assurance | 382 | |||
Lithium Argentina AG., 2026 Cauchari-Olaroz S-K 1300 Technical Report Cauchari-Olaroz Salars, Argentina | Page vii |
| 17.6.2.3 | Post-Closure Monitoring | 383 | |||
| 18.0 | Capital and Operating Costs | 384 | |||
| 18.1 | Capital Costs (CAPEX) Estimate | 384 | |||
| 18.1.1 | Capital Expenditures CAPEX Definition | 384 | |||
| 18.1.2 | Evaporation Ponds | 385 | |||
| 18.1.3 | Lithium Carbonate Plant | 386 | |||
| 18.1.4 | Reagents Costs | 386 | |||
| 18.1.5 | Offsite Infrastructure Costs | 387 | |||
| 18.1.5.1 | Natural Gas Supply to Plant | 387 | |||
| 18.1.5.2 | Power Supply to Plant | 387 | |||
| 18.1.5.3 | Onsite Infrastructure and General Cost Summary | 387 | |||
| 18.2 | Indirect Costs | 388 | |||
| 18.2.1 | Final CAPEX for Exar 40,000 tpa Plant | 388 | |||
| 18.2.2 | Exclusions | 388 | |||
| 18.2.3 | Currency | 388 | |||
| 18.2.4 | Sustaining Capital | 388 | |||
| 18.3 | Operating Costs Estimate | 389 | |||
| 18.3.1 | Operating Cost Summary | 389 | |||
| 18.3.2 | Pond and Plant Reagents Costs Definition | 390 | |||
| 18.3.3 | Pond Salt Harvesting | 391 | |||
| 18.3.4 | Solid Waste Management (Rises) | 391 | |||
| 18.3.5 | Energy Cost | 391 | |||
| 18.3.6 | Maintenance Cost | 391 | |||
| 18.3.7 | Labour Cost | 391 | |||
| 18.3.8 | Catering, Camp Services Cost, Security and Third-Party Services | 391 | |||
| 18.3.9 | General and Administrative Costs | 392 | |||
| 18.4 | Company Operational Organization | 392 | |||
| 19.0 | Economic Analysis | 394 | |||
| 20.0 | Adjacent Properties | 395 | |||
| 20.1 | Olaroz Project - Arcadium Lithium | 395 | |||
| 20.2 | Cauchari Project - Rio Tinto | 399 | |||
| 21.0 | Other Relevant Data and Information | 401 | |||
| 22.0 | Interpretation and Conclusions | 402 | |||
| 22.1 | Geology and Resources | 402 | |||
| 22.2 | Brine Production | 404 | |||
| 22.3 | Process Information and Design | 404 | |||
| 22.4 | Environmental Studies, Permitting and Social or Community Impact | 404 | |||
| 22.5 | Economic Analysis | 405 | |||
| 22.6 | Project Risks | 405 | |||
| 23.0 | Recommendations | 407 | |||
| 24.0 | References | 409 | |||
| 25.0 | Reliance on Information Provided by the Registrant | 415 | |||
| Appendix 1. Summary Tables of Pumping Test Results for Exploration and Production Wells | 416 | ||||
Lithium Argentina AG., 2026 Cauchari-Olaroz S-K 1300 Technical Report Cauchari-Olaroz Salars, Argentina | Page viii |
List of Tables
| Table 1.1 | Summary of 2026 Lithium Mineral Resource Estimate – Exclusive of Mineral Reserves (1-12) | 19 |
| Table 1.2 | Summary of 2026 Mineral Reserve Estimate (1-14) | 20 |
| Table 1.3 | Lithium Carbonate Plant Design Criteria | 24 |
| Table 1.4 | Capital Costs Summary | 29 |
| Table 1.5 | Operating Costs Summary | 31 |
| Table 1.6 | Sustaining CAPEX Expenditure Schedule | 31 |
| Table 1.7 | Recommendations Budget | 33 |
| Table 2.1 | Abbreviations Table | 35 |
| Table 3.1 | Exar Mineral Claims | 45 |
| Table 3.2 | Annual Royalties and Payments | 53 |
| Table 3.3 | Exploration Permits for Cauchari-Olaroz Exploration Work | 55 |
| Table 3.4 | Exploitation Permits for Cauchari-Olaroz | 58 |
| Table 4.1 | Location Coordinates of the Meteorological Stations of Cauchari-Olaroz | 62 |
| Table 4.2 | Distribution of Wind Frequencies by Direction and Speed from 2023 to 2025 - Davis Weather Station | 70 |
| Table 4.3 | Average Monthly and Average Annual Wind Speed (km/h) from 2023 to 2025 - Davis Weather Station | 73 |
| Table 4.4 | Distribution of Wind Frequencies by Direction and Speed from 2024 to 2025 - Campbell North Weather Station | 74 |
| Table 4.5 | Average Monthly and Average Annual Wind Speed (km/h) Period 2024 to 2025, EM Campbell Norte | 76 |
| Table 4.6 | Air Quality Guideline Levels | 81 |
| Table 4.7 | Air Quality Sampling Points | 82 |
| Table 4.8 | Historical Air Quality Results | 84 |
| Table 4.9 | Comparison Standards for Noise Quality | 86 |
| Table 4.10 | Location of Noise Quality Sampling Points | 87 |
| Table 4.11 | Historical Noise Quality Results and the Thresholds Established by International Standards | 87 |
| Table 5.1 | Summary of 2012 Lithium Mineral Resource for Lithium (1-4) | 89 |
| Table 5.2 | Summary of 2019 Mineral Resource Estimate for Lithium Represented as LCE, Exclusive of Mineral Reserves (1-9) | 90 |
| Table 5.3 | Summary of 2019 Estimated Proven and Probable Mineral Reserves (Without Processing Efficiency) | 91 |
| Table 6.1 | Comparative Chemical Composition of Andean Salt Pans | 113 |
| Table 7.1 | Test Pit Transect Results for TDS and Lithium | 151 |
| Table 7.2 | Test Pit Transect Results for TDS and Lithium with Depths | 152 |
| Table 7.3 | Average Surface Water Flow Rates | 154 |
| Table 7.4 | Static Water Level Measurements for the Period from January 2010 to February 2019 | 161 |
| Table 7.5 | Borehole Drilling Summary for the RC Borehole Program Conducted in 2009 and 2010 | 172 |
| Table 7.6 | Summary of Brine Samples Collected and Submitted for Laboratory Analysis from the RC and DDH Borehole Programs | 173 |
| Table 7.7 | Brine Concentrations (mg/L) and Ratios Averaged Across Selected Depth Intervals for RC Program Boreholes | 174 |
| Table 7.8 | Borehole Drilling Summary for the DDH Program Conducted in 2009 and 2010 | 176 |
| Table 7.9 | Brine Concentrations (mg/L) Averaged Across Selected Depth Intervals for DDH Program Boreholes | 177 |
Lithium Argentina AG., 2026 Cauchari-Olaroz S-K 1300 Technical Report Cauchari-Olaroz Salars, Argentina | Page ix |
| Table 7.10 | Borehole Drilling Summary for the DDH Program Conducted in 2017 and 2019 | 179 |
| Table 7.11 | Brine Concentrations (mg/L) Averaged Across Selected Depth Intervals for DDH Program Boreholes 2017-2019 | 183 |
| Table 7.12 | Production Well Drilling and Construction Details | 189 |
| Table 7.13 | Borehole Drilling Summary for the DDH and Production Well Drilling Program Conducted in 2022 and 2024 | 196 |
| Table 8.1 | Summary Pumping Test Measurement Frequency | 206 |
| Table 8.2 | Summary of Geotechnical Property Analyses | 209 |
| Table 9.1 | Results of Due Diligence Sampling – February 2019 | 212 |
| Table 9.2 | Results of Due Diligence Sampling – June 2019 | 214 |
| Table 9.3 | QA/QC Sampling | 215 |
| Table 9.4 | Results of Due Diligence Sampling | 217 |
| Table 9.5 | Check Assay Sampling | 224 |
| Table 10.1 | Monthly Evaporation Ratio | 233 |
| Table 10.2 | Composition of the Brine Used for Testing SX | 235 |
| Table 10.3 | Reagent Optimization in Primary Purification | 242 |
| Table 11.1 | Hydrostratigraphic Units Assigned in Previous and Current Studies | 254 |
| Table 11.2 | Specific Yield values assigned to the Hydrogeological Units (Mean) | 256 |
| Table 11.3 | ID Interpolation Parameters | 263 |
| Table 11.4 | Key Statics of Datasets Used | 263 |
| Table 11.5 | Drill Platform Density and Preliminary Classification by Elevation Interval | 267 |
| Table 11.6 | Summary of 2026 Lithium Mineral Resource Estimate – Exclusive of Mineral Reserves (1-12) | 269 |
| Table 11.7 | Comparison Between the Current and Previous (Burga et al., 2025) Mineral Resource Estimates | 271 |
| Table 12.1 | Summary of Mountain Front Recharge | 282 |
| Table 12.2 | Definition Points for the Numerical Model Segments | 284 |
| Table 12.3 | Summary of Assigned Aquifer Parameter Estimates | 286 |
| Table 12.4 | Summary of Model Boundary Fluxes | 291 |
| Table 12.5 | Projected Annual Results from 2025 Mineral Reserve Estimate Model | 300 |
| Table 12.6 | Summary of 2026 Mineral Reserve Estimate (1-14) | 302 |
| Table 12.7 | Comparison of Mineral Reserve Estimates - Current and Previous (Burga et al. 2025) | 305 |
| Table 13.1 | Borehole Drilling Summary for Infill Producing Wells Program Conducted in 2024 | 309 |
| Table 13.2 | Volume Pumped per Production Well per Year and Average Flow per Year - Cauchari-Olaroz | 310 |
| Table 15.1 | Production Wells Estimate | 338 |
| Table 16.1 | Average Pricing Scenarios Adopted for the Economic Analysis of the Project | 359 |
| Table 17.1 | Compliance with Regulations and Standards | 367 |
| Table 17.2 | Summary of Key Permitting Milestones | 369 |
| Table 17.3 | Key Aspects of Decree No. 7751-DEyP-2023 | 377 |
| Table 17.4 | Exploration Permits | 372 |
| Table 17.5 | Exploitation Permits | 373 |
| Table 17.6 | Industrial Water Permits and Concessions for Cauchari-Olaroz | 373 |
| Table 18.1 | Lithium Carbonate Plant Capital Costs Summary | 385 |
| Table 18.2 | Production Wells Capital Cost | 385 |
| Table 18.3 | Evaporation and Concentration Ponds Capital Cost | 385 |
| Table 18.4 | Lithium Carbonate Plant Capital Cost Summary | 386 |
| Table 18.5 | Reagent Costs | 386 |
| Table 18.6 | Offsite Infrastructure Costs | 387 |
Lithium Argentina AG., 2026 Cauchari-Olaroz S-K 1300 Technical Report Cauchari-Olaroz Salars, Argentina | Page x |
| Table 18.7 | Onsite Infrastructure and General Capital Cost Summary | 387 |
| Table 18.8 | Project Indirect Costs | 388 |
| Table 18.9 | Operating Costs Summary | 390 |
| Table 20.1 | Production From Rio Tinto’s Olaroz Project – 2021 – 2023* | 396 |
| Table 20.2 | Mineral Resource Estimate for Arcadium’s Olaroz JV Project In Tonnes of Lithium Metal (1-10) | 396 |
| Table 20.3 | Mineral Resource Estimate for Arcadium’s Cauchari JV Project in Tonnes of Lithium Metal (1-7) | 399 |
| Table 20.4 | Mineral Reserve Estimate for Arcadium’s Cauchari JV Project in Tonnes of Lithium Metal (1-7) | 400 |
| Table 23.1 | Recommendations Budget | 407 |
Lithium Argentina AG., 2026 Cauchari-Olaroz S-K 1300 Technical Report Cauchari-Olaroz Salars, Argentina | Page xi |
List of Figures
| Figure 1.1 | Ownership Structure | 15 |
| Figure 1.2 | Overall Process Block Diagram | 23 |
| Figure 3.1 | Location of Cauchari-Olaroz | 42 |
| Figure 3.2 | Exar Property Claims at Cauchari-Olaroz | 44 |
| Figure 4.1 | Regional Topography and Population Centers Near Cauchari-Olaroz | 61 |
| Figure 4.2 | Location of Local Meteorological Stations | 63 |
| Figure 4.3 | Record of Average Monthly Rainfall for the Study Area | 64 |
| Figure 4.4 | Monthly Evapotranspiration | 65 |
| Figure 4.5 | Record of Average Monthly Temperatures - Davis Station | 66 |
| Figure 4.6 | Record of Average Monthly Temperatures - Campbell North Station | 66 |
| Figure 4.7 | Annual Maximum and Minimum Temperatures - Davis Weather Station | 67 |
| Figure 4.8 | Annual Maximum and Minimum Temperatures - Campbell North Weather Station | 68 |
| Figure 4.9 | Average Monthly Relative Humidity for the Study Area | 69 |
| Figure 4.10 | Average Monthly Atmospheric Pressure for the Study Area | 69 |
| Figure 4.11 | Wind Rose Plot – Davis Weather Station | 72 |
| Figure 4.12 | Wind Speeds (km/h) 2023–2025 - Davis Weather Station | 73 |
| Figure 4.13 | Average Wind Speed Records (km/h) – Davis Weather Station | 74 |
| Figure 4.14 | Wind Rose Plot - Campbell North Weather Station | 75 |
| Figure 4.15 | Wind Speeds (km/h) Period 2024 to 2025 - Campbell North Weather Station | 76 |
| Figure 4.16 | Average Wind Speed Records (km/h) - Campbell North Weather Station | 77 |
| Figure 4.17 | Monthly Solar Irradiance (MJ/m2) for the Study Area | 77 |
| Figure 4.18 | Average Annual Daily Solar Irradiance (W/m2) - 2023 – 2025 – Davis Weather Station | 78 |
| Figure 4.19 | Maximum Solar Radiation Recorded (W/m2) - Period 2023 – 2025 – Davis Weather Station | 79 |
| Figure 4.20 | Average Annual Daily Solar Irradiance (W/m2) - Period 2024 to 2025 - Campbell North Weather Station | 80 |
| Figure 4.21 | Maximum Solar Radiation Recorded (W/m2) – 2024 to 2025 - Campbell North Weather Station | 81 |
| Figure 4.22 | Air Quality Sampling Points | 83 |
| Figure 4.23 | Ambient Noise Sampling Points | 87 |
| Figure 4.24 | Historical Noise Quality Results and the Threshold Values Established by International Regulations | 89 |
| Figure 6.1 | Regional Geology in the Vicinity of the Exar Project | 94 |
| Figure 6.2 | Structural Features in the Central Area of the Cauchari Basin | 95 |
| Figure 6.3 | Surficial Geology in the Central Area of the Cauchari Basin | 98 |
| Figure 6.4 | Facies Map of the Lower Salt Cycle Showing Line 1 Crossing a Thick Salt Succession | 101 |
| Figure 6.5 | Isopleth Curves of Salt Percent in the Facies Triangle | 102 |
| Figure 6.6 | Main Salt Sources of the Lower Cycle | 103 |
| Figure 6.7 | Facies Map of the Upper Cycle | 105 |
| Figure 6.8 | Salt Percent Isopleths of the Upper Cycle | 106 |
| Figure 6.9 | Isopleth Map of Sand Percents of the Upper Cycle Sedimentation Stage | 107 |
| Figure 6.10 | Caucharri-Olaroz Watershed | 109 |
| Figure 6.11 | Janecke Classification of Brines | 111 |
| Figure 7.1 | Seismic Tomography Lines – 2009 and 2010 | 117 |
| Figure 7.2 | Seismic Tomography Results for the 12 Survey Lines in Figure 7.1 | 118 |
| Figure 7.3 | Location of Gravity Survey Lines at the Cauchari Salar | 120 |
Lithium Argentina AG., 2026 Cauchari-Olaroz S-K 1300 Technical Report Cauchari-Olaroz Salars, Argentina | Page xii |
| Figure 7.4 | Modeling Results for the Northeast Oriented Gravity Line (Grav 1) Over the Mineral Resource Estimate | 121 |
| Figure 7.5 | Modeling Results for the North-South Gravity Line (Grav 2) Across the Southwest Portion of the Mineral Resource Estimate | 122 |
| Figure 7.6 | Location of TEM Sounding Profiles Conducted at the Cauchari Salar | 124 |
| Figure 7.7 | 2010 Survey Results for Line TEM 1 | 125 |
| Figure 7.8 | 2010 Survey Results for Line TEM 2 | 126 |
| Figure 7.9 | 2010 Survey Results for Line TEM 3 | 127 |
| Figure 7.10 | 2010 Survey Results for Line TEM 4 | 128 |
| Figure 7.11 | 2010 Survey Results for Line TEM 5 | 129 |
| Figure 7.12 | 2017 Survey Results for Line TEM 1 | 130 |
| Figure 7.13 | 2017 Survey Results for Line TEM 2 | 130 |
| Figure 7.14 | 2017 Survey Results for Line TEM 3 | 131 |
| Figure 7.15 | 2010-2011 Map of VES Survey Area | 132 |
| Figure 7.16 | 2010-2011 VES Survey Interpretation on the Archibarca Fan, Along Line VI | 134 |
| Figure 7.17 | 2010-2011 VES Survey Interpretation Along Line 2 | 135 |
| Figure 7.18 | 2010-2011 VES Survey Interpretation Along Line 8 | 136 |
| Figure 7.19 | 2010-2011 VES Survey Interpretation Along Line 20 | 137 |
| Figure 7.20 | 2019 VES Survey Area | 138 |
| Figure 7.21 | 2019 VES Survey Interpretation Along Line A | 139 |
| Figure 7.22 | 2019 VES Survey Interpretation Along Line B | 139 |
| Figure 7.23 | 2019 VES Survey Interpretation Along Line C | 139 |
| Figure 7.24 | 2019 VES Survey Interpretation Along Line D | 140 |
| Figure 7.25 | 2019 VES Survey Interpretation Along Line E | 140 |
| Figure 7.26 | 2019 VES Survey Interpretation Along Line F | 140 |
| Figure 7.27 | 2019 VES Survey Interpretation Along Line G | 141 |
| Figure 7.28 | 2019 VES Survey Interpretation Along Line H | 141 |
| Figure 7.29 | 2019 VES Survey Interpretation Along Line I | 141 |
| Figure 7.30 | 2019 VES Survey Interpretation Along Line J | 142 |
| Figure 7.31 | 2019 VES Survey Interpretation Along Line K | 142 |
| Figure 7.32 | 2020 VES Survey Area | 143 |
| Figure 7.33 | 2020 VES Survey Interpretation Along Line A-A’ | 143 |
| Figure 7.34 | 2020 VES Survey Interpretation Along Line B-B’ | 143 |
| Figure 7.35 | 2020 VES Survey Interpretation Along Line C-C’ | 144 |
| Figure 7.36 | 2020 VES Survey Interpretation Along Line D-D’ | 144 |
| Figure 7.37 | 2020 VES Survey Interpretation Along Line E-E’ | 144 |
| Figure 7.38 | 2020 VES Survey Interpretation Along Line F-F’ | 145 |
| Figure 7.39 | 2020 VES Survey Interpretation Along Line G-G’ | 145 |
| Figure 7.40 | 2021 VES Survey Area | 146 |
| Figure 7.41 | 2021 VES Survey Interpretation Along Line A | 146 |
| Figure 7.42 | 2021 VES Survey Interpretation Along Line B | 147 |
| Figure 7.43 | 2024 VES Survey Area | 148 |
| Figure 7.44 | 2024 VES Survey Interpretation | 149 |
| Figure 7.45 | Boundary Investigation Map Showing Test Pit Transects and Multi-level Monitoring Well Nests | 150 |
| Figure 7.46 | Surface Water Flow Monitoring Sites | 153 |
| Figure 7.47 | Average Depth to Static Water Levels in Shallow Wells (50 m) | 164 |
| Figure 7.48 | Average Depth to Static Water Levels in Intermediate Depth Wells (250 - 300 m) | 165 |
| Figure 7.49 | Average Depth to Static Water Levels in Deep Wells (450 - 600 m) | 166 |
| Figure 7.50 | Production Wells | 168 |
Lithium Argentina AG., 2026 Cauchari-Olaroz S-K 1300 Technical Report Cauchari-Olaroz Salars, Argentina | Page xiii |
| Figure 7.51 | Lithium Concentrations in Samples Collected During Pump Tests | 169 |
| Figure 7.52 | Lithium Concentrations in Pump Test Samples – Cauchari | 170 |
| Figure 7.53 | Lithium Concentrations in Pump Test Samples – Olaroz | 171 |
| Figure 7.54 | Black Sand in DD19D-001 | 181 |
| Figure 7.55 | Borehole Locations and Associated Drilling Platforms | 182 |
| Figure 7.56 | Pumping Well W18-05 | 186 |
| Figure 7.57 | Pumping Wells Location | 192 |
| Figure 7.58 | DD19D-05 Lithological Profile | 195 |
| Figure 7.59 | DD19D-06 Lithological Profile | 195 |
| Figure 7.60 | DD19D-07 Lithological Profile | 196 |
| Figure 7.61 | DD19D-08 Lithological Profile | 196 |
| Figure 7.62 | DD19D-11 Lithological Profile | 197 |
| Figure 7.63 | DD19D-13 Lithological Profile | 197 |
| Figure 7.64 | DD19D-15 Lithological Profile | 198 |
| Figure 7.65 | DD19D-26 BIS Lithological Profile | 198 |
| Figure 7.66 | 2022-2024 Drill Hole Locations | 199 |
| Figure 8.1 | Rock Chip Tray with Dry and Wet Samples | 201 |
| Figure 8.2 | Collecting an Undisturbed Sample | 202 |
| Figure 8.3 | Collecting an Undisturbed Sample from Core | 202 |
| Figure 8.4 | Measuring Sediment in an Imhoff Cone | 204 |
| Figure 9.1 | Due Diligence Sample Results for Lithium: February 2019 | 211 |
| Figure 9.2 | Due Diligence Sample Results for Lithium: June 2019 | 213 |
| Figure 9.3 | Performance of Lithium Blank Samples | 214 |
| Figure 9.4 | Performance of Patron A | 216 |
| Figure 9.5 | Performance of Patron B | 216 |
| Figure 9.6 | Performance of Patron C | 217 |
| Figure 9.7 | Performance of Standard A | 217 |
| Figure 9.8 | Performance of Patron AA | 218 |
| Figure 9.9 | Performance of Patron BB | 218 |
| Figure 9.10 | Performance of Patron CC | 219 |
| Figure 9.11 | Performance of Standard AA | 219 |
| Figure 9.12 | Duplicate Samples – Exar Laboratory | 220 |
| Figure 9.13 | Check Assays – Exar Laboratory Versus ASA Laboratories | 221 |
| Figure 9.14 | Check Assays – Exar Laboratory Versus ASA Laboratories – November 2023 | 222 |
| Figure 9.15 | Lithium Values in Well PB-4 2020-2025 | 223 |
| Figure 10.1 | Evaporation Pans and Lamps | 226 |
| Figure 10.2 | Dry Air Evaporation Tests | 227 |
| Figure 10.3 | Li Concentration Changes in the Brine During the Evaporation Process | 227 |
| Figure 10.4 | Pilot Ponds | 229 |
| Figure 10.5 | Brine Evaporation | 230 |
| Figure 10.6 | Water Evaporation | 230 |
| Figure 10.7 | Sedimentation Rate of Limed Pulps with Different Amounts of Excess Lime | 232 |
| Figure 10.8 | Extraction Isotherm at 20ºC Using Mixed Extractants | 233 |
| Figure 10.9 | Re-extraction Isotherm at 20ºC Using Mixed Extractants | 234 |
| Figure 10.10 | Pilot Plant (SX-Purification-Carbonation-Filtration-Washing Pulp) | 235 |
| Figure 10.11 | SX Process Boron Extraction Efficiency | 236 |
| Figure 10.12 | Ca and Mg Precipitation Efficiency | 237 |
| Figure 10.13 | Li Precipitation Efficiency | 238 |
| Figure 10.14 | Sulphate-Calcium Equilibrium Curve | 239 |
| Figure 10.15 | Example of Economic Optimization Curve | 241 |
Lithium Argentina AG., 2026 Cauchari-Olaroz S-K 1300 Technical Report Cauchari-Olaroz Salars, Argentina | Page xiv |
| Figure 10.16 | Equilibrium Curve of Li2CO3 Versus Ca and CO3 | 242 |
| Figure 10.17 | Graph of Total Organic Carbon Versus Salinity | 243 |
| Figure 11.1 | Location Map for Mineral Resource Estimate | 246 |
| Figure 11.2 | Methodology for Evaluating Brine Mineral Resources and Mineral Reserves | 248 |
| Figure 11.3 | Representative Plan and Section Views of the 2019 Measured, Indicated, and Inferred Mineral Resource Estimate | 250 |
| Figure 11.4 | Vertical Cross Sections and Aerial View Showing the Distribution of the Hydrogeostratigraphic Units | 253 |
| Figure 11.5 | Drill Hole Locations Where Porosity Analyses Were Conducted | 255 |
| Figure 11.6 | Lithium Grade Interpolation for the Current Mineral Resource Estimate | 257 |
| Figure 11.7 | Modelled Variogram for Li and 2-D Variogram and Directional Variograms for the Li-Domain | 258 |
| Figure 11.8 | Swath Plot in X for Li Domain | 261 |
| Figure 11.9 | Swath Plot in Y for Li Domain | 262 |
| Figure 11.10 | Swath Plot in Z for Li Domain | 263 |
| Figure 11.11 | Representative Cross Sections and Aerial View of the 2026 Measured, Indicated, and Inferred Mineral Resource Estimate | 265 |
| Figure 11.12 | Comparison Between the Extension of the Current and Previous (Burga, 2025) Mineral Resource Estimates | 269 |
| Figure 12.1 | Conceptual Model and Model Boundary Conditions | 274 |
| Figure 12.2 | Numerical Model Grid with Inactive Cells | 276 |
| Figure 12.3 | Vertical Discretization of the Geological Model in Leapfrog (top) Versus the Numerical Flow Model in GWV (bottom) | 277 |
| Figure 12.4 | Direct and Lateral Precipitation Recharge Zone in the Numerical Model | 280 |
| Figure 12.5 | Distribution of Evaporation Zones in the Numerical Model | 282 |
| Figure 12.6 | Cells Defined with a Drain Boundary Condition to Represent the Saline Interface and Lagoon Outcrop Zone | 284 |
| Figure 12.7 | Hydraulic Conductivity (m/d) for Each Model Layer | 287 |
| Figure 12.8 | Piezometric Surface of the Pre-Development Model | 289 |
| Figure 12.9 | Distribution of the Residuals | 290 |
| Figure 12-10 | Observed Versus Calculated Residuals with Calibration Statistics for the Pre-development Model | 291 |
| Figure 12.11 | Head Residuals Histogram | 292 |
| Figure 12.12 | Hydraulic Conductivity Comparison Between the Pumping Test Analysis and the Model Calibrated Parameters | 293 |
| Figure 12.13 | Observed Versus Calculated Piezometric Levels for the Transient Model at October 2023 | 294 |
| Figure 12.14 | Distribution of the Residuals for October 2023 | 295 |
| Figure 12.15 | Head Residuals Histogram | 296 |
| Figure 12.16 | Average Lithium Grades from Production Wells Production Wells (2018-2025) | 297 |
| Figure 12.17 | Maximum Drawdown Predicted at the Upper Part of the Aquifer for Year 2060 | 299 |
| Figure 12.18 | Temporal Evolution of the Averaged Lithium Concentration Extracted from the Wellfield | 301 |
| Figure 12.19 | Annual Total LCE Production from the Wellfield | 301 |
| Figure 13.1 | Production Wells – Pumped Volumes per Well per Year | 311 |
| Figure 13.2 | Location of Production Wells | 312 |
| Figure 13.3 | Location of Production Wells Showing 2019 Mineral Resource Area | 313 |
| Figure 14.1 | Process Block Diagram | 315 |
| Figure 14.2 | Evaporation Ponds at Cauchari Salar | 317 |
Lithium Argentina AG., 2026 Cauchari-Olaroz S-K 1300 Technical Report Cauchari-Olaroz Salars, Argentina | Page xv |
| Figure 14.3 | Testing of Berm Material | 318 |
| Figure 14.4 | Evaporation Ponds – Close Up | 318 |
| Figure 14.5 | Evaporation Ponds | 319 |
| Figure 14.6 | Evaporation Ponds – Transfer Pump Station | 320 |
| Figure 14.7 | Lithium Plant Block Diagram | 322 |
| Figure 14.8 | Boron Solvent Extraction | 324 |
| Figure 14.9 | Brine Purification Processing Circuit Diagram | 325 |
| Figure 14.10 | Primary Purification Processing Circuit Diagram | 326 |
| Figure 14.11 | Secondary Purification Processing Circuit Diagram | 327 |
| Figure 14.12 | Primary IX Circuit Diagram | 328 |
| Figure 14.13 | Carbonate Removal Circuit Diagram | 329 |
| Figure 14.14 | Evaporation and KCl Crystallization Diagram | 330 |
| Figure 14.15 | Secondary IX Polishing Diagram | 331 |
| Figure 14.16 | Lithium Carbonate Crystallization Diagram | 332 |
| Figure 14.17 | Lithium Carbonation Reactor Diagram | 333 |
| Figure 14.18 | Mother Liquor Diagram | 333 |
| Figure 14.19 | Lithium Carbonate Drying, Micronization and Packaging Diagram | 335 |
| Figure 15.1 | Aerial View - Main Facilities | 340 |
| Figure 15.2 | Aerial View of Evaporation Ponds | 341 |
| Figure 15.3 | Process Facility Flow Diagram | 343 |
| Figure 15.4 | Project Infrastructure Camp General Layout | 348 |
| Figure 16.1 | Lithium Demand in Batteries (2024) | 353 |
| Figure 16.2 | EV Penetration Rate Forecast | 354 |
| Figure 16.3 | BESS Global Demand Growth | 355 |
| Figure 16.4 | Lithium Production (2024) by Country | 356 |
| Figure 16.5 | Lithium Supply Forecast per Resource Type | 357 |
| Figure 16.6 | Lithium Supply Forecast per Country | 357 |
| Figure 16.7 | Projected Pricing for Battery-Quality Lithium Carbonate Used in Economic Model | 358 |
| Figure 18.1 | Project Organization | 993 |
| Figure 20.1 | Olaroz Project Production – 2016–2021 | 395 |
| Figure 20.2 | Olaroz Project – Evaporation Ponds and Facilities | 397 |
| Figure 20.3 | Adjacent Properties Showing Boundary with the Exar Property | 398 |
Lithium Argentina AG., 2026 Cauchari-Olaroz S-K 1300 Technical Report Cauchari-Olaroz Salars, Argentina | Page xvi |
Certificates
Certificate of Qualified Person
David Burga, P.Geo.
I, David Burga, P. Geo., residing at 3884 Freeman Terrace, Mississauga, Ontario, do hereby certify that:
| 1. | I am an independent geological consultant contracted by Lithium Argentina AG. |
| 2. | This certificate applies to the technical report titled “2026 Cauchari-Olaroz S-K 1300 Technical Report, Jujuy Province, Argentina,” (the “Technical Report”) with an effective date of February 27, 2026. |
| 3. | I am a graduate of the University of Toronto with a Bachelor of Science degree in Geological Sciences (1997). I have worked as a geologist for a total of 22 years since obtaining my B.Sc. degree. I am a geological consultant currently licensed by Professional Geoscientists Ontario (License No 1836). I have read the definition of “qualified person” set out in S-K 1300 and certify that, by reason of my education, affiliation with a professional association and past relevant work experience, I fulfill the requirements to be a “qualified person” for the purposes of S-K 1300. My relevant experience for the purpose of the Technical Report is: |
| Exploration Geologist, Cameco Gold | 1997-1998 |
| Field Geophysicist, Quantec Geoscience | 1998-1999 |
| Geological Consultant, Andeburg Consulting Ltd. | 1999-2003 |
| Geologist, Aeon Egmond Ltd. | 2003-2005 |
| Project Manager, Jacques Whitford | 2005-2008 |
| Exploration Manager – Chile, Red Metal Resources | 2008-2009 |
| Consulting Geologist | 2009-Present |
| 4. | I have visited the Property that is the subject of this Technical Report on January 24, 2017, February 19-21, 2019, June 10-12, 2019, and November 20-21, 2024. |
| 5. | I am responsible for Sections 2, 3.1-3.8, 4-9, 20, 21, 23, 25 and co-author for Sections 22 and 23 of the Technical Report along with those sections of the Summary pertaining thereto. |
| 6. | I have had prior involvement with the Property that is the subject of this Technical Report. That involvement was as an author on the technical report titled “Updated Feasibility Study and Mineral Reserve Estimation to Support 40,000 tpa Lithium Carbonate Production at the Cauchari-Olaroz Salars, Jujuy Province, Argentina”, (the “Technical Report”) with an effective of September 30th, 2020, “Updated Mineral Resource Estimate for the Cauchari-Olaroz Project, Jujuy Province, Argentina” (the “Technical Report”) with an effective of March 1st, 2019, the technical report titled “Updated Feasibility Study and Reserve Estimation and Lithium Carbonate Production at the Cauchari-Olaroz Salars, Jujuy Province, Argentina”, (the “Technical Report”) with an effective of March 29th, 2017, and the technical report titled “Operational Technical Report at the Cauchari-Olaroz Salars, Jujuy Province, Argentina,” (the “Technical Report”) with an effective date of December 31, 2024. |
Lithium Argentina AG., 2026 Cauchari-Olaroz S-K 1300 Technical Report Cauchari-Olaroz Salars, Argentina | Page 1 of 418 |
| 7. | As of the effective date of this technical report, to the best of my knowledge, information and belief, the Technical Report contains all scientific and technical information that is required to be disclosed to make the Technical Report not misleading. |
Effective Date: February 27, 2026
Signing Date: March 19, 2026
{SIGNED AND SEALED}
[David Burga]
_______________________________
David Burga, P.Geo.
Lithium Argentina AG., 2026 Cauchari-Olaroz S-K 1300 Technical Report Cauchari-Olaroz Salars, Argentina | Page 2 of 418 |
Certificate of Qualified Person
Mark King, PhD, P.Geo., FGC
I, Dr. Mark King, P. Geo., do hereby certify that:
| 1. | I am an independent geological consultant contracted by Lithium Argentina AG. I am President and Senior Hydrogeologist with Groundwater Insight Inc., 3 Melvin Road, Halifax, Nova Scotia, B3P 2H5, telephone 902 223 6743, email king@gwinsight.com. |
| 2. | This certificate applies to the technical report titled “2026 Cauchari-Olaroz S-K 1300 Technical Report, Jujuy Province, Argentina,” (the “Technical Report”) with an effective date of February 27, 2026. |
| 3. | I have the following academic and professional qualifications and experience: |
| a. | Academic |
| i. | B.Sc. (Geology), Dalhousie University, Halifax, Nova Scotia, 1982 |
| ii. | M.A.Sc. (Civil Eng.), Technical University of Nova Scotia, 1987 |
| iii. | Ph.D. (Earth Science), University of Waterloo, Waterloo, Ontario, 1997 |
| b. | Professional |
| i. | Registered Professional Geoscientist (PGeo) of Nova Scotia (membership #84); Serving on Admissions Board of the Association for 15+ years |
| ii. | Member of Association of Groundwater Scientists and Engineers (membership #3002241) |
| iii. | Member of Canadian Institute of Mining (CIM) (membership 758876) |
| c. | Experience and Areas of Specialization Relevant to this Technical Report |
| i. | Technical involvement in lithium brine projects for the past 15 years, ranging from NI43-101 Reporting to Due Diligence, 40+ brine projects in Chile, Argentina, Nevada, Utah, California, Mongolia, and Germany |
| ii. | Co-author - CIM Leading Practice Guidelines for Salar-Hosted Lithium Brine MRMR Estimation (Draft, 2025) |
| iii. | Numerical modelling of groundwater flow and solutes in groundwater |
| iv. | Field delineation and monitoring of solutes in groundwater |
| v. | 35 years of experience in groundwater quality and quantity projects |
| 4. | I am a qualified person (“QP”) for the purposes of National Instrument 43-101 – Standards of Disclosure for Mineral Projects (the “Instrument”). |
| 5. | I visited the Property that is the subject of this Technical Report on several occasions, the most recent being in 2012. |
| 6. | I am responsible for Sections 11 and 12, along with those sections of the Summary pertaining thereto. |
| 7. | I am independent of the Issuer applying the test in Section 1.5 of S-K 1300. |
| 8. | I have had prior involvement with the Property that is the subject of this Technical Report. That involvement was as an author on the Technical Reports titled “Feasibility Study Reserve Estimation and Lithium Carbonate and Potash Production at the Cauchari-Olaroz Salars, Jujuy Province, Argentina,” with an effective date of July 11, 2012; “Updated Feasibility Study and Reserve Estimation and Lithium Carbonate Production at the Cauchari-Olaroz Salars, Jujuy Province, Argentina”, (the “Technical Report”) with an effective of March 29th, 2017. |
Lithium Argentina AG., 2026 Cauchari-Olaroz S-K 1300 Technical Report Cauchari-Olaroz Salars, Argentina | Page 3 of 418 |
| 9. | I have read NI 43-101 and Form 43-101F1 and this Technical Report has been prepared in compliance therewith. |
| 10. | As of the Effective Date of this technical report, to the best of my knowledge, information and belief, the Technical Report contains all scientific and technical information that is required to be disclosed to make the Technical Report not misleading. |
Effective Date: February 27, 2026
Signing Date: March 19, 2026
{SIGNED AND SEALED}
[Mark King]
_______________________________
Mark King, P.Geo.
Lithium Argentina AG., 2026 Cauchari-Olaroz S-K 1300 Technical Report Cauchari-Olaroz Salars, Argentina | Page 4 of 418 |
Certificate of Qualified Person
Anthony Sanford, Pr.Sci.Nat
I, Anthony Sanford, BSc. (Hons.), MBA (Mineral Resources Management), Pr.Sci.Nat, residing at Calle Esquilache 371, Piso 6, San Isidro, Lima Perú do hereby certify that:
| 1. | I am an independent geological consultant contracted by Lithium Americas Corporation. |
| 2. | This certificate applies to the technical report titled “2026 Cauchari-Olaroz S-K 1300 Technical Report, Jujuy Province, Argentina,” (the “Technical Report”) with an effective date of February 27,2026. |
| 3. | I graduated with a MBA (Mineral Resources Management) from the University of Dundee, Scotland, Centre for Energy, Petroleum and Mineral Law and Policy, in 1998; with a B.Sc (Hons), Geology from the University of Natal, Durban, South Africa in 1985 and B.Sc. (Geology & Applied Geology) in 1984. I am a geological consultant currently licensed by the South African Council for Natural Scientific Professions (Registration No 400089/03). I have worked in my profession for a total of 35 years since completing my honours degree in 1984 in the fields of geology, and environmental and social science related to the exploration, construction, operation, and closure phases of mine development. My experience includes working in environmental and social issues related to both open pit and underground mining including heap leach and mine waste/tailings disposal, and on the development of regulatory permits including ESIAs and mine closure plans, the last 20 years of which have been in South America. I have read the definition of “Expert” set out for the purposes of contributions to an S-K 1300 Technical Report and certify that by reason of my education, affiliation with a professional association, and past relevant work experience, I fulfill the requirements to be an “Expert” for the purposes of the Technical Report. |
| Principal Consultant, South America, EnviroProTech-t: | 2021 – present |
| Senior Regional Consultant, South America, Ausenco | 2016-2020 |
| Environmental Services and Water Resources Manager. Perú, Ausenco | 2015 - 2016 |
| Environmental Services Manager, Perú, Ausenco | 2008 - 2015 |
| Senior Geologist, Perú, Ausenco | 2004 - 2008 |
| Geologist, Senior Geologist, Anglovaal, South Africa, Zambia | 1985 - 1996 |
| 4. | I have visited the Property that is the subject of this Technical Report during the period 14-15 February 2017 and 23-24 July 2019. |
| 5. | I am responsible for authoring Section 17 and Sections 3.7 through 3.9 and co-authoring Sections 25 and 26 of the Technical Report along with those sections of the Summary pertaining thereto. |
Lithium Argentina AG., 2026 Cauchari-Olaroz S-K 1300 Technical Report Cauchari-Olaroz Salars, Argentina | Page 5 of 418 |
| 6. | I have had prior involvement with the Property that is the subject of this Technical Report. That involvement was as an author on the technical report titled “Updated Feasibility Study and Mineral Reserve Estimation to Support 40,000 tpa Lithium Carbonate Production at the Cauchari-Olaroz Salars, Jujuy Province, Argentina”, (the “Technical Report”) with an effective of September 30th, 2020, “Updated Mineral Resource Estimate for the Cauchari-Olaroz Project, Jujuy Province, Argentina” (the “Technical Report”) with an effective of March 1st, 2019, the technical report titled “Updated Feasibility Study and Reserve Estimation and Lithium Carbonate Production at the Cauchari-Olaroz Salars, Jujuy Province, Argentina”, (the “Technical Report”) with an effective of March 29th, 2017, and the technical report titled “Operational Technical Report at the Cauchari-Olaroz Salars, Jujuy Province, Argentina,” (the “Technical Report”) with an effective date of December 31, 2024. |
| 7. | As of the effective date of this technical report, to the best of my knowledge, information and belief, the Technical Report contains all the scientific and technical information that is required to be disclosed to make the Technical Report not misleading. |
Effective Date: February 27, 2026
Signing Date: March 19, 2026
{SIGNED AND SEALED}
[Anthony Sanford]
______________________________
Anthony Sanford, Pr.Sci.Nat.
Lithium Argentina AG., 2026 Cauchari-Olaroz S-K 1300 Technical Report Cauchari-Olaroz Salars, Argentina | Page 6 of 418 |
Certificate of Qualified Person
Marek Dworzanwski, EUR ING CEng
I, Marek Dworzanowski, EUR ING, CEng, BSc(Hons), FIMMM, HonFSAIMM residing at 25 Rue Paul Doumer, 22950, Tregueux, France, do hereby certify that:
| 1. | I am an independent process consultant contracted by Lithium Americas Argentina Corporation. |
| 2. | This certificate applies to the technical report titled “2026 Cauchari-Olaroz S-K 1300 Technical Report, Jujuy Province, Argentina,” (the “Technical Report”) with an effective date of February 27,2026. |
| 3. | I graduated from the University of Leeds, United Kingdom, with a BSc (Honours) in Mineral Processing in July 1980. In March 2016, I was appointed as a Visiting Adjunct Professor in Metallurgical Engineering, University of Witwatersrand, South Africa. |
| 4. | I became a Fellow of the Southern African Institute of Mining and Metallurgy (SAIMM) in 2006 and my membership number is 19594. I became a Fellow of the Institute of Materials, Minerals and Mining (IMMM) in 2020 and my membership number is 485805. I became a Chartered Engineer (CEng) with the Engineering Council of the United Kingdom in 2020 and my registration number is 357983. I became a European Engineer (EUR ING) in 2022 and my registration number is 34956. |
| 5. | I have read the definition of “qualified person” (QP) set out in S-K 1300 and by reason of my education, affiliation with a professional association and past relevant work experience, I fulfill the requirements to be a QP for the Technical Report. |
| 6. | I have over 40 years of experience in the mining industry during which time I gained a considerable amount of diverse experience in various senior roles within the areas of mineral processing and hydrometallurgy, production, project execution, project studies, technical consulting and research and development. My relevant experience in lithium brine projects for the purpose of the Technical Report includes operational reviews of producing lithium plants, process consulting support and acting as QP for a number of lithium brine projects including: Minera Salar Blanco Maricunga Project PEA and DFS (Chile), Millennial Lithium Pastos Grandes Project PEA and DFS (Argentina), Advantage Lithium Cauchari Project PEA and PFS (Argentina), NeoLithium 3Q Project DFS (Argentina), Standard Lithium Lanxess Smackover Project PEA (USA) and Standard Lithium SWA Project PFS (USA). |
| 7. | I have had prior involvement with the Property that is the subject of this Technical Report. That involvement was as an author on the technical report titled “Updated Feasibility Study and Mineral Reserve Estimation to Support 40,000 tpa Lithium Carbonate Production at the Cauchari-Olaroz Salars, Jujuy Province, Argentina”, (the “Technical Report”) with an effective of September 30th, 2020 and the technical report titled “Operational Technical Report at the Cauchari-Olaroz Salars, Jujuy Province, Argentina,” (the “Technical Report”) with an effective date of December 31, 2024.. |
| 8. | I visited the property that is the subject of the Technical Report on 10 September 2025. |
Lithium Argentina AG., 2026 Cauchari-Olaroz S-K 1300 Technical Report Cauchari-Olaroz Salars, Argentina | Page 7 of 418 |
| 9. | I am responsible for Section 10 and Section 14 of the Technical Report along with those sections of the Summary pertaining thereto. |
| 10. | As of the effective date of this technical report, to the best of my knowledge, information and belief, the Technical Report contains all scientific and technical information that is required to be disclosed to make the Technical Report not misleading. |
Effective Date: February 27, 2026
Signing Date: March 19, 2026
{SIGNED AND SEALED}
[Marek Dworzanowski]
______________________________
Marek Dworzanowski, EUR ING CEng
Lithium Argentina AG., 2026 Cauchari-Olaroz S-K 1300 Technical Report Cauchari-Olaroz Salars, Argentina | Page 8 of 418 |
Certificate of Qualified Person
Jonathan Gibson P.Eng. – Mining Engineer/ QP
I, Jonathan Gibson P.Eng., residing at 1343 Queenston Road, Cambridge, Ontario, do hereby certify that:
| 1. | I am an independent mining and mineral processing engineering consultant contracted by Lithium Argentina AG. |
| 2. | This certificate applies to the technical report titled “2026 Cauchari-Olaroz S-K 1300 Technical Report, Jujuy Province, Argentina,” (the “Technical Report”) with an effective date of February 27, 2026. |
| 3. | I am a graduate of Dalhousie University with a Bachelor of Engineering degree in Mining, Mineral Processing and Oil & Gas (2007). I have worked as a Mining and Mineral Processing Engineer for a total of 18 years since obtaining my B.Eng. degree. I am a professional mining engineer currently licensed by the Professional Engineers of Ontario as well as the Association of Professional Engineers of Nova Scotia (License No 100126726 and 20230175 respectively). I have read the definition of “qualified person set out in S-K 1300 and certify that, by reason of my education, affiliation with a professional association and past relevant work experience, I fulfill the requirements to be a “qualified person” for the purposes of S-K 1300. My relevant experience for the purpose of the Technical Report is: |
| Mining and Mineral Processing Engineer, Vale | 2007-2012 |
| Independent Professional Mining and Mineral Processing Engineer, Optimineral, | 2012-present |
| Consulting Mining and Mineral Processing Engineer, BBA, | 2020-2021 |
| Consulting Mining and Mineral Processing Engineer, CSU Projects, | 2023-present |
I have participated in well over 2 dozen various technical reports (from prefeasibility to FEL 0-4, Multi-Discipline Engineering Reports, Trade-off studies, mineral processing flowsheet adaptations (including the supporting laboratory R&D), Backfill and mine ventilation capital projects to start-up/commissioning of material handling circuits and several mine closure plans) as well as being the QP of record and/or author of over half a dozen SEC reported technical reports (Vale, CSU Projects & BBA).
| 4. | I have not visited site that is subject of the Technical Report. |
| 5. | I am responsible for authoring Sections 15, 19, and co-authoring Sections 22 and 23 of the Technical Report along with those sections of the Summary pertaining thereto. |
| 6. | I have had prior involvement with the Property that is the subject of this Technical Report. I signed off on the 2025 20-F Form. |
| 7. | As of the effective date of this technical report, to the best of my knowledge, information and belief, the Technical Report contains all scientific and technical information that is required to be disclosed to make the Technical Report not misleading. |
Lithium Argentina AG., 2026 Cauchari-Olaroz S-K 1300 Technical Report Cauchari-Olaroz Salars, Argentina | Page 9 of 418 |
Effective Date: February 27, 2026
Signing Date: March 19, 2026
{SIGNED AND SEALED}
[Jonathan Gibson]
______________________________
Jonathan Gibson, P.Eng.
Lithium Argentina AG., 2026 Cauchari-Olaroz S-K 1300 Technical Report Cauchari-Olaroz Salars, Argentina | Page 10 of 418 |
Certificate of Qualified Person
Alexander M. L. Cushing, P.ENG.
I, Alexander Cushing, P. Eng., residing at 243 Albright Road, Hamilton, Ontario, do hereby certify that:
| 1. | I am an independent mineral processing, metallurgical and mineral economics consultant contracted by Lithium Americas (Argentina) Corp. |
| 2. | This certificate applies to the technical report titled “2026 Cauchari-Olaroz S-K 1300 Technical Report, Jujuy Province, Argentina,” (the “Technical Report”) with an effective date of February 27, 2026. |
| 3. | I am a graduate of McMaster University with a Bachelor of Engineering degree in Chemical Engineering (2011), Queen’s University, Kingston with a Master of Applied Science (2014) and Doctorate of Philosophy (2018) in Mining Engineering, and the University of Toronto with a Master of Finance. I have worked as an engineer for over 10 years since obtaining my B.Eng degree. I am an engineering consultant currently licensed by Professional Engineers Ontario (License No 100555075). I have read the definition of “qualified person” set out in S-K 1300 and certify that, by reason of my education, affiliation with a professional association and past relevant work experience, I fulfill the requirements to be a “qualified person” for the purposes of S-K 1300. My relevant experience for the purpose of the Technical Report is: |
| Metallurgist, SGS Lakefield | 2018 - 2020 |
| Consulting Engineer, Ioniq (formerly CSU Projects) | 2020 - 2021 |
| Senior Analyst, Vale Canada | 2021 - 2022 |
| Consulting Engineer, Ioniq (formerly CSU Projects) | 2022 - Present |
| 4. | I have not visited the Property that is the subject of this Technical Report. |
| 5. | I am responsible for Sections 16 and 18 of the Technical Report along with those sections of the Summary pertaining thereto. |
| 6. | I have had prior involvement with the Property that is the subject of this Technical Report. I signed off on the 2025 20-F Form. |
| 7. | As of the effective date of this technical report, to the best of my knowledge, information and belief, the Technical Report contains all scientific and technical information that is required to be disclosed to make the Technical Report not misleading. |
Effective Date: February 27, 2026
Signing Date: March 19, 2026
{SIGNED AND SEALED}
[Alexander Cushing]
_______________________________
Alexander Cushing, P.Eng.
Lithium Argentina AG., 2026 Cauchari-Olaroz S-K 1300 Technical Report Cauchari-Olaroz Salars, Argentina | Page 11 of 418 |
Forward Looking Statements
This Technical Report, including the economics analysis, contains statements or information that constitute forward-looking information (forward-looking statements) within the meaning of applicable Canadian securities laws. Forward looking statements include, but are not limited to project economics, financial and operational parameters such as the timing and amount of future production from the Project, expectations with respect to the NPV and costs of the Project, anticipated mining and processing methods of the Project; proposed infrastructures, anticipated mine life of the Project, expected recoveries and grades, timing of development plans, the estimation of Mineral Resources and Reserves; realization of Mineral Resource and Reserve Estimates; the timing, success and amount of estimated future exploration; costs of future activities; capital and operating expenditures; and success of exploration activities. Generally, forward looking statements can be identified by the use of forward-looking terminology such as “plans”, “expects” or “does not expect”, “is expected”, “budget”, “scheduled”, “estimates”, “forecasts”, “intends”, “continue”, “anticipates” or “does not anticipate”, or “believes”, or variations of such words and phrases or statements that certain actions, events or results “may”, “could”, “would”, “will”, “might” or “will be taken”, “occur” or “be achieved”. Forward looking statements are made based upon certain assumptions and other important facts that, if untrue, could cause the actual results, performance, or achievements of the project to be materially different from future results, performances or achievements expressed or implied by such statements. Such statements and information are based on numerous assumptions, some of which are discussed in this Technical Report. Forward-looking statements are subject to known and unknown risks, uncertainties and other important factors that may cause the actual results, level of activity, performance or achievements of the project to be materially different from those expressed or implied by such forward-looking statements, including but not limited to: there being no assurance that the exploration program or programs for the project will result in expanded Mineral Resources; risks and uncertainties inherent to Mineral Resource and Reserve Estimates; the high degree of uncertainties inherent to economic analysis which are based to a significant extent on various assumptions; variations in gold prices and other metals; exchange rate fluctuations; variations in cost of supplies, labour rates and consumable and equipment costs; receipt of necessary approvals; availability of financing for project development; uncertainties and risks with respect to developing mining projects; general business, economic, competitive, political and social uncertainties; future lithium prices; accidents, labour disputes and shortages; environmental and other risks of the mining industry, including without limitation, risks and uncertainties discussed in the Company’s latest Annual Information Form and other continuous disclosure documents of the Company available under the Company’s profile at www.sedarplus.ca. There may be other factors that cause results not to be as anticipated, estimated or intended. There can be no assurance that such statements will prove to be accurate, as actual results and future events could differ materially from those anticipated in such statements. Accordingly, readers should not place undue reliance on forward looking statements.
Lithium Argentina AG., 2026 Cauchari-Olaroz S-K 1300 Technical Report Cauchari-Olaroz Salars, Argentina | Page 12 of 418 |
| 1.0 | Executive Summary |
| 1.1 | Introduction |
This report titled “2026 Cauchari-Olaroz S-K 1300 Technical Report” (the “Report” or “Technical Report”), was prepared by Deptford Geoscience Inc. (“Deptford”) to provide Lithium Argentina AG, previously Lithium Americas Corp (“LAR” or “Lithium Argentina” or the “Company”) with a Technical Report that is compliant with S-K 1300 regulations (“S-K 1300”) on the Cauchari-Olaroz Salars (“Cauchari-Olaroz” or “Project” or “Property”), located in the Jujuy Province, Argentina.
Lithium Argentina and Ganfeng Lithium Co. Ltd. (“GANFENG” or “Ganfeng Lithium”) own Cauchari-Olaroz through a joint venture company (“JV”), Minera Exar S.A. (“Exar”). On August 26, 2020, GANFENG, LAR and Exar entered into a Share Acquisition Option Execution Agreement with Jujuy Energía y Minería S.E. (“JEMSE”) a Province of Jujuy state company, setting the guidelines of JEMSE acquisition of an 8.5% participating interest in Exar, proportionally diluting GANFENG and LAR participating interest accordingly.
Lithium Argentina is a public company listed on the Toronto Stock Exchange (“TSX”) and New York Stock Exchange (“NYSE”) under the symbol “LAR.” GANFENG trades on the Hong Kong Stock Exchange (“HKEX”) under the stock code 01772. Deptford understands that the Company may use this Report for internal decision-making purposes and will file it as required under applicable securities laws.
The current Mineral Reserve Estimate presented in this Report has been prepared in compliance with the S-K regulations. with an effective date of December 31, 2025.
| 1.2 | Property Description, Location, Access and History |
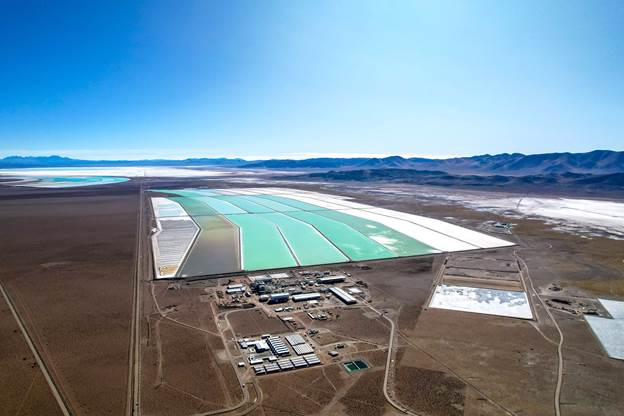
The Cauchari and Olaroz Salars are located in the Department of Susques in the Province of Jujuy in northwestern Argentina, approximately 250 kilometers (“km”) northwest of San Salvador de Jujuy, the provincial capital. The salars extend in a north-south direction from S23°18’ to S24°05’ and in an east-west direction from W66°34’ to W66°51’. The average elevation of the salars is 3,940 meters. The midpoint between the Olaroz and Cauchari Salars is located along National Highway 52, 55 km west of the Town of Susques. The nearest port is Antofagasta (Chile), located 530 km west of the Project by road.
Through its Argentine subsidiary Exar, LAR acquired title to the project through direct staking or entering into exploration and exploitation contracts with third party property owners. The claims are contiguous and cover most of the Caucharí Salar and the eastern portion of the Olaroz Salar. The annual aggregate payment (canon rent) required by Exar to maintain the claims is US$268,346. Under Exar’s usufruct agreement with Borax Argentina S.A., Exar acquired Borax Argentina S.A.’s usufruct rights on properties in the area in exchange for an annual royalty of US$200,000 plus annual canon rent property payments to Jujuy Province. The area that contains the Mineral Resource and Mineral Reserve estimate is covered by mining concessions which grant the holder a perpetual mining right, subject to the payment of a fee and an agreed upon investment in accordance with the principal legislation that regulates the mining industry in Argentina, the Código de Minería.
On March 28, 2016, Exar entered into a purchase option agreement (“Option Agreement”) with Grupo Minero Los Boros (“Los Boros”) for the transfer of title to Exar for certain mining properties that comprised a portion of Cauchari-Olaroz. Under the terms of the Option Agreement, Exar paid US$100,000 upon signing, and obtained a right to exercise the purchase option at any time within 30 months for the total consideration of US$12 M payable in sixty quarterly installments of US$200,000.
Lithium Argentina AG., 2026 Cauchari-Olaroz S-K 1300 Technical Report Cauchari-Olaroz Salars, Argentina | Page 13 of 418 |
On November 12, 2018, Exar exercised the purchase option; as a result, the following royalties became payable to Los Boros:
| · | US$300,000 was paid on November 27, 2018 because the commercial plant construction started (purchase option established payment within 10 days of the commercial plant construction start date); and |
| · | 3% net profit interest for 40 years, to be paid annually in Argentine pesos, within 10 business days after calendar year end. |
Exar can cancel the first 20 years of net profit interest in exchange for a one-time payment of US$7M and the second 20-year period for an additional US$7M.
On March 28, 2016, SQM and Exar executed a Shareholders Agreement that established the terms by which the parties planned to develop Cauchari-Olaroz.
On October 31, 2018, the Company closed a transaction with Ganfeng Lithium and SQM. Ganfeng Lithium agreed to purchase SQM’s interest in Cauchari-Olaroz. LAR increased its interest in the Project from 50% to 62.5% with Ganfeng holding the remaining 37.5% interest and the parties entered into a shareholder agreement to govern their ownership and business operations of Exar. Ganfeng Lithium also provided the Company with a US$100 million unsecured, limited recourse subordinated loan facility as part of funding its 62.5% share of the project expenditures.
On August 19, 2019, LAR and Ganfeng completed a transaction whereby Ganfeng contributed US$160 million in Exar and increased its participating interest in Exar to 50%. At such transaction closing, LAR and GANFENG each owned a 50% equity interest in Exar. The parties made certain consequential amendments to the shareholders agreement governing their relationship to refer to the new equity ownership structure in Exar. LAR and GANFENG authorized Exar to undertake a feasibility study on a development plan to increase the initial production capacity from 25,000 tpa to 40,000 tpa of lithium carbonate, as well as certain permitting and development work in advance of a decision to increase the project production rate.
On August 27, 2020, LAR and Ganfeng closed a transaction whereby Ganfeng increased its participating interest in Exar to 51% by completion of US$16 million capital contribution in Exar. At such transaction closing, GANFENG owned a 51% equity interest in Exar and LAR a 49%. The parties made certain consequential amendments to the shareholders agreement governing their relationship to refer to the new equity ownership structure in Exar.
On August 26, 2020, GANFENG, LAR and Exar entered into a Share Acquisition Option Execution Agreement with JEMSE, setting the guidelines of JEMSE acquisition of an 8.5% participating interest in Exar, proportionally diluting GANFENG and LAR participating interest accordingly. JEMSE incorporation was completed in 2020. JEMSE acquired the Exar shares for a consideration of US$1 plus an amount equal to 8.5% of the capital contributions in Exar. JEMSE paid for this amount to the shareholders through the assignment of one-third of the dividends to be received by JEMSE from Exar after taxes. In accordance with the agreement, for future equity contributions GANFENG and LAR are obliged to loan to JEMSE 8.5% of the contributions necessary for JEMSE to avoid dilution, which loans also would be repayable from the same one-third dividends assignment, after taxes.
Lithium Argentina AG., 2026 Cauchari-Olaroz S-K 1300 Technical Report Cauchari-Olaroz Salars, Argentina | Page 14 of 418 |
On October 3, 2023, LAR separated into two independent public companies, Lithium Americas (Argentina) Corp. and a new Lithium Americas Corp. LAR retained Cauchari-Olaroz as well as the Pastos Grandes and Sal de la Puna projects in Argentina.
Current ownership of the Project is summarized in Figure 1.1.
Figure 1.1 Ownership Structure
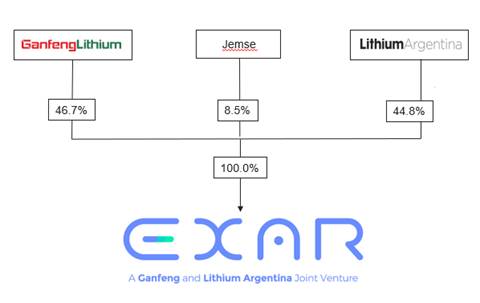
| 1.3 | Geological Setting and Deposit Types |
There are two dominant structural features in the region of the Cauchari and Olaroz Salars: north-south trending faults and northwest-southeast trending lineaments. The high-angle north-south trending faults form narrow and deep basins, which are accumulation sites for numerous salars, including Olaroz and Cauchari. Basement rock in this area is composed of Lower Ordovician turbidites (shale and sandstone) that are intruded by Late Ordovician granitoids. Bedrock is exposed to the east, west and south of the two salars, and generally along the eastern boundary of the Puna Region.
The salars are in-filled with flat-lying sedimentary deposits, including the following five primary informal lithological units that have been identified in drill cores:
| · | Red silts with minor clay and sand; |
| · | Banded halite beds with clay, silt and minor sand; |
| · | Fine sands with minor silt and salt beds; |
| · | Massive halite and banded halite beds with minor sand; and |
| · | Medium and fine sands. |
Lithium Argentina AG., 2026 Cauchari-Olaroz S-K 1300 Technical Report Cauchari-Olaroz Salars, Argentina | Page 15 of 418 |
Alluvial deposits intrude into these salar deposits to varying degrees, depending on location. The alluvium surfaces slope into the salar from outside the basin perimeter. Raised bedrock exposures occur outside the salar basin. The most extensive intrusion of alluvium into the basin is the Archibarca Fan, which partially separates the Olaroz and Cauchari Salars. National Highway 52 is constructed across this alluvial fan. In addition to this major fan, much of the perimeter zone of both salars exhibits encroachments of alluvial material associated with fans of varying sizes.
| 1.4 | Mineralization |
The brines from Cauchari are saturated in sodium chloride with total dissolved solids (TDS) on the order of 27% (324 to 335 grams per litre) and an average density of about 1.215 grams per cubic centimeter. The other primary components of these brines include potassium, lithium, magnesium, calcium, sulphate, HCO3, and boron as borates and free H3BO3. Since the brine is saturated in NaCl, halite is expected to precipitate during evaporation. In addition, the Cauchari brine is predicted to initially precipitate halite (NaCl) and ternadite (Na2SO4) as well as a wide range of secondary salts that could include: astrakanite (Na2Mg(SO4)2·4H2O), schoenite (K2Mg(SO4)2·6H2O), leonite (K2Mg(SO4)2·4H2O), kainite (MgSO4·KCl·3H2O), carnalite (MgCl2·KCl·6H2O), epsomite (MgSO4·7H2O) and bischofite (MgCl2·6H2O).
| 1.5 | Exploration and Drilling |
The following exploration programs were conducted between 2009 and 2024 on behalf of LAR to evaluate the lithium development potential of the Project area:
| · | Surface Brine Program – 55 brine samples were collected from shallow pits throughout the salars to obtain a preliminary indication of lithium occurrence and distribution. |
| · | Seismic Geophysical Program – Seismic surveying was conducted to support delineation of basin geometry, mapping of basin-fill sequences, and siting borehole locations. |
| · | Gravity Survey - A limited gravity test survey was completed to evaluate the utility of this method for determining depths to basement rock. |
| · | Time Domain Electromagnetic (TEM) Survey – TEM surveying was conducted to attempt to define freshwater and brine interfaces within the salar. |
| · | Air Lift Testing Program – Testing was conducted within individual boreholes as a preliminary step in estimating aquifer properties related to brine recovery. |
| · | Vertical Electrical Sounding (VES) Survey – A VES survey was conducted to attempt to identify freshwater and brine interfaces and surrounding freshwater occurrences. Surveys were conducted in 2010-2011, 2019-2021 and 2024. |
| · | Surface Water Sampling Program – A program was conducted to monitor the flow and chemistry of surface water entering the salars. |
| · | Pumping Test Program 2011-2019 – Pumping wells were installed at eleven locations, to estimate aquifer parameters related to brine recovery. One of the locations was used to estimate the capacity of freshwater supply. Some tests were carried out using multiple wells on the same platform in order to estimate three-dimensional aquifer parameters. |
Lithium Argentina AG., 2026 Cauchari-Olaroz S-K 1300 Technical Report Cauchari-Olaroz Salars, Argentina | Page 16 of 418 |
| · | Boundary Investigation –A test pitting and borehole program was conducted to assess the configuration of the freshwater/brine interface at the salar surface and at depth, at selected locations on the salar perimeter. |
| · | Reverse Circulation (RC) Borehole Program – Dual-tube, reverse circulation drilling was conducted to develop vertical profiles of brine chemistry at depth in the salars and to provide geological and hydrogeological data. The program included installation of 24 boreholes and collection of 1,487 field brine samples (and additional Quality Control samples). |
| · | Diamond Drilling (“DD”) Borehole Program 2009-2010 – A drilling and sampling program was conducted to collect continuous cores for geotechnical testing (relative brine release capacity (“RBRC”), grain size and density) and geological characterization. The program included 29 boreholes and collection of 127 field brine samples. |
| · | Diamond Drilling (DD) Borehole Program 2017-2019 – A drilling and sampling program included a total of 49 boreholes and 9,703 meters of cores recovered. In 2019, 58 additional samples were sent for RBRC testing at Daniel B. Stephens & Associates, Inc. (samples from DD19D-001 and DD19D-PE09; this program also included a total of 1,006 samples sent to the laboratory for brine characterization, including QAQC samples). |
| · | Borehole Drilling Program 2022-2024 – A drilling and sampling program included a total of 8 boreholes and 2,125 meters of cores recovered. |
| · | Since 2011 a total of 43 production wells have been drilled on the Property. |
| 1.6 | Mineral Processing and Metallurgical Testing |
Since 2019, the pilot plant has worked to provide process support and monitor efficiency improvements in the lithium carbonate production process.
In the liming plant, important work has been carried out monitoring the consumption of lime reagent. A 50% reduction in the consumption required by design was obtained. This improvement not only reduced the operating expenditure (“OPEX”) but also enhanced downstream performance in the purification process.
Other studies conducted in the pilot plant also allowed for the optimization of reagent consumption in the purification stages. In purification, lime consumption was reduced from a molar ratio of 300% relative to the incoming magnesium to 250%, representing a 16.7% decrease in consumption.
Lithium Argentina AG., 2026 Cauchari-Olaroz S-K 1300 Technical Report Cauchari-Olaroz Salars, Argentina | Page 17 of 418 |
| 1.6.1 | Continuing Work Plan for Supporting the Plant Operations |
Homologation Tests for Inputs Used in Lithium Carbonate Production:
| · | Testing and evaluation of new inputs in different areas. |
Evaluation of Suppliers for Various Production Inputs:
| · | Procedure for evaluating new suppliers. |
| · | Tests required for evaluation. |
Work Required According to Plant Needs for Process Optimization, Operational Problem Resolution, or Development of Alternatives:
| · | Solvent extraction tests to reduce organic traces in the ouput streams. |
| · | Support for the analysis of new scenarios arising from new specifications across different areas. |
| · | Studying the use of process water and mother liquors in the liming process. |
| · | Pilot Plant IX tests to evaluate resins. |
| · | Implement a process support program for ensuring that product quality is achieved more consistently. |
| · | Implementation of mathematical tools/models to predict plant operating conditions |
| 1.7 | Mineral Resources and Mineral Reserves |
The lithium Mineral Resources and Mineral Reserves described in this report occur in subsurface brine. The brine is contained within the pore space of alluvial, lacustrine, and evaporite deposits that have accumulated as a multi-layer aquifer in the structural basin of the salars.
The Mineral Resource Estimate reported in this Section 14 was completed using a new Leapfrog Hydrogeological Model model that incorporates a new description of the hydrostratigraphic (HSU) units based on the salar lithistratigraphic units. This new model is based on the full basin model developed by Aquatec. The Mineral Reserve Estimate, documented in Section 12.0, uses the same HSU framework.
The results of drilling, exploration, and production carried out in recent years have enabled an updated resource evaluation. Based on this new information, a significant portion of the Mineral Resources previously classified as Inferred in the Burga et al (2019) estimate has been reclassified to Indicated and Measured Mineral Resources. This reclassification is due to an increase in the spatial and temporal continuity of the supporting data.
This resulted in the latest 2026 Mineral Resource Estimate for the Project with an effective date of December 31, 2025.
The 2026 Mineral Resource Estimate at the Measured, Indicated, and Inferred Mineral Resource classification (CIM, 2014) for lithium is based on the total amount of lithium in brine that is theoretically drainable from the bulk aquifer volume. The Mineral Resource Estimate is computed as the overall product of the Resource Evaluation Area and aquifer thickness resulting in an aquifer volume, lithium concentration dissolved in the brine, and specific yield of the resource aquifer volume. This framework is based on an expanded and updated hydrostratigraphic model incorporating bulk aquifer volume lithologies and specific yield estimates for block modeling of the Mineral Resource Estimate. Radial basis function was performed as the main lithium distribution methodology using variogram modeling techniques; the interpolation method was verified with ordinary kriging. The Mineral Resource block model was validated by means of visual inspection, checks of composite versus model statistics and swath plots. No areas of significant bias were noted.
Lithium Argentina AG., 2026 Cauchari-Olaroz S-K 1300 Technical Report Cauchari-Olaroz Salars, Argentina | Page 18 of 418 |
The Mineral Resource Estimate is summarized in Table 1.1 at the Measured, Indicated, and Inferred confidence level classes. As is accepted in standard practice for lithium brine Mineral Resource Estimates, Table 1.1 also provides lithium represented as Li2CO3, or Lithium Carbonate Equivalent (“LCE”), at the Measured, Indicated, and Inferred level classes.
| Table 1.1 Summary of 2026 Lithium Mineral Resource Estimate – Exclusive of Mineral Reserves (1-12) | ||||||
| Mineral Resource Classification |
Aquifer Volume (m3) |
Brine Drainable Volume (m3) |
Average Li Concentration (mg/L) |
Li (t) |
LCE (t) |
LCE LAR’s 44.8% Portion (t) |
| Measured | 5.94E+10 | 5.89E+09 | 557 | 2,742,686 | 14,599,317 | 6,540,494 |
| Indicated | 3.87E+10 | 3.82E+09 | 571 | 2,122,708 | 11,299,172 | 5,062,029 |
| Measured + Indicated | 9.81E+10 | 9.71E+09 | 562 | 4,865,393 | 25,898,489 | 11,602,523 |
| Inferred | 2.77E+10 | 3.24E+09 | 567 | 1,806,125 | 9,614,004 | 4,307,073 |
| Notes: |
| 1. | S-K 1300 definitions were followed for Mineral Resources and Mineral Reserves. |
| 2. | The independent Qualified Person for the 2026 Mineral Resource Estimate is Mark King, PhD. PGeo, FGC. |
| 3. | Mineral Resources are also expressed in the industry standard Lithium Carbonate Equivalent (LCE = Lithium × 5.323). |
| 4. | The mass of lithium produced from 2018–2025 period (52,786 t = 280,982 t LCE) has been removed from the Mineral Resource. |
| 5. | The Effective Date of the Mineral Resource Estimate is December 31st, 2025. |
| 6. | The Mineral Resource Estimate is not a Mineral Reserve Estimate and does not have demonstrated economic viability. There is no certainty that all or any part of the Mineral Resources will be converted to Mineral Reserves. |
| 7. | Calculated brine volumes only include Measured, Indicated, and Inferred Mineral Resource volumes above cut-off grade. |
| 8. | Comparisons of values may not add due to rounding of numbers and the differences caused by use of averaging methods. |
| 9. | A lithium grade cutoff of 300 mg/L is used to define the Mineral Resource. |
| 10. | The Mineral Resources Estimates are net of Mineral Reserves (421,854 t Li) without Process efficiency that has been removed from the Estimated Measured Resources |
| 11. | The commodity price of $18,000 / tonne for lithium carbonate (2025) for the life of the project was used to assess the economic viability for the mineral estimates, as described below. |
The 2026 Mineral Reserve Estimate for lithium incorporates additional drilling and testing through an effective date of December 31, 2025. The current Resource Estimate has benefited from an extended period (ramping up since 2018) of production pumping which represents an exceptionally long period of brine grade and production confirmation. Since 2018, a total of 38 production wells were progressively brought online in the current resource exploitation area (Cauchari-Olaroz). During the 2018–2025 period, a total of 82,847,494 m³ of brine has been extracted, equivalent to 280,982 t of LCE or 52,786 t of lithium.
Lithium Argentina AG., 2026 Cauchari-Olaroz S-K 1300 Technical Report Cauchari-Olaroz Salars, Argentina | Page 19 of 418 |
The Proven and Probable Mineral Reserve Estimate is summarized in Table 1.2 using a 63% of LCE process efficiency (pre-processing). Mineral Reserves correspond total amount of lithium enriched brine estimated to be available within the aquifer that can be extracted under the proposed pumping schedule and wellfield configuration. The average of the lithium concentration after 35 years of simulated mine life was significantly above of the 300 mg/L cut-off.
| Table 1.2 Summary of 2026 Mineral Reserve Estimate (1-14) | ||||||
| Mineral Reserve Classification |
Production Period (Years) |
Brine Pumped (m3) |
Average Lithium Concentration (mg/L) |
Lithium Metal (t) |
LCE (t) |
LCE LAR’s 44.8% Portion (t) |
| Proven | 2026 – 2035 (0 to 10 yr) |
227,782,565 | 588.26 | 75,315 | 400,886 | 179,597 |
| Probable | 2036 – 2060 (11 to 35) |
526,320,091 | 572.18 | 190,463 | 1,013,796 | 454,181 |
| Total | 35 years | 754,102,655 | 580 | 265,779 | 1,414,682 | 633,778 |
| Notes: |
| 1. | S-K 1300 definitions were followed for Mineral Resources and Mineral Reserves. |
| 2. | The Mineral Reserve Estimate has an effective date of December 31, 2025. |
| 3. | Reserves are estimated using 63.0 % of process efficiency |
| 4. | Lithium carbonate equivalent (“LCE”) is calculated using mass of LCE = 5.322785 multiplied by the mass of Lithium Metal. |
| 5. | The values in the columns for “Lithium Metal” and “LCE” above are expressed as total contained metals. |
| 6. | The Production Period is inclusive of the start of Year 0, 2026. |
| 7. | The average lithium concentration is weighted by per well simulated extraction rates. |
| 8. | Values may not sum exactly, due to rounding of numbers and the differences caused by use of averaging methods. |
| 9. | The commodity price of $18,000 / tonne for lithium carbonate (2025) for the life of the project was used to assess the economic viability for the mineral estimates, as described below . |
| 10. | A lithium grade cutoff of 300 mg/L is used to define the Mineral Reserve Estimate. |
| 11. | The independent Qualified Person for the 2026 Mineral Resource Estimate is Mark King, PhD. PGeo, FGC. |
| 12. | The estimate of Mineral Reserves may be materially affected by legal, political, environmental, or other risks. |
| 13. | The point of reference is brine pumped from the wellfield to the evaporation ponds. |
The relative accuracy and confidence in the Mineral Reserve Estimate is a function of the accuracy and confidence demonstrated in sampling and analytical methods, development and understanding of the conceptual hydrogeologic system, and construction and calibration of the numerical groundwater flow model. As has been demonstrated in this report, input data and analytical results via sample duplication, the use of multiple methods to determine brine grade, and to obtain aquifer parameters from pumping tests have been verified and used as a basis for the Mineral Reserve Estimate model. The current evaluation has benefitted significantly from the accumulated and lengthening period of proven production.
Lithium Argentina AG., 2026 Cauchari-Olaroz S-K 1300 Technical Report Cauchari-Olaroz Salars, Argentina | Page 20 of 418 |
Using standard methods, a conceptual geological and hydrogeologic model consistent with the geologic, hydrogeologic, and chemistry data obtained during the field exploration phases of the Project was prepared. The conceptual model was then used to prepare the numerical groundwater flow model. In addition, the calibration of the numerical model iteratively provided support for the conceptual hydrogeologic model. After review and verification of model projections and brine production to date, the authors have a reasonably high level of confidence that the salar system can yield the quantities and grade of brine calculated in the current Reserve Estimate.
To support the updated Mineral Reserve Estimate Aquatec developed a new hydrostratigraphic framework and numerical model and the expanded dataset. Following calibration with the historical operation and production data, the updated numerical model simulated the current production wellfield to evaluate the ability of the brine aquifer to sustain a minimum target of 40,000 tonnes per year (tpa) LCE over a 35-year operational period which is reported as reserves, starting January 1 2026 and extending through the end of year 2060.
Following the verification that the current production wellfield is capable of delivering sufficient brine to sustain the minimum Stage 1 target production rate of 40,000 tpa of LCE, ongoing updates to the calibrated numerical model are being undertaken to evaluate the maximum production rate from the entire Salar basin.
These modeling efforts are designed to support the estimation of a Total Mineral Reserve to allow for a Stage 2 expansion reaching a total production of more than 80,000 tpa over a 40-year operating life. Stage 2 will be incorporating a new DLE technology that will help increase the Lithium recovery, reduce the land footprint and accelerate the Project schedule.
| 1.7.1 | Discussion of Mineral Resource and Mineral Reserve Cut-off Grade |
A lithium cut-off concentration grade of 300 mg/L was conservatively applied for the 2026 Mineral Resource and Reserve Estimate. For comparison of the utilized cut-off grade to a breakeven cut-off grade calculation, the following analytical formula can be used based on the controlling inputs as quantified for LOM:
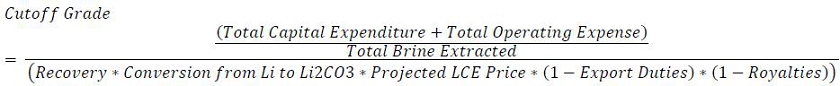
Where:
| · | Total Capital Expenditure= US$ 1,950 million |
| · | Total Operating Expenditure = US$ 8,766 million |
| · | Cost of Capital = US$ 195 million (10 percent of Total Capital) |
| · | Total Brine Extracted = 859 Mm3 |
| · | Conversion from Li to Li2CO3 (LCE) = 5.323 |
| · | Projected LCE Price = US$ 18,00 per metric ton of LCE |
| · | Export Duties =4.31% |
| · | Royalties= 1.6% |
| · | Calculated Recovery= 63%. |
Resulting in a calculated breakeven cut-off grade of approximately 224 mg/L.
Lithium Argentina AG., 2026 Cauchari-Olaroz S-K 1300 Technical Report Cauchari-Olaroz Salars, Argentina | Page 21 of 418 |
Considering the economic value of the brine relative to production costs, the applied cut-off grade of 300 mg/L is considered conservative with respect to the overall estimated resource. Resource model domains with lithium concentrations below this threshold were excluded from the estimate. Under these assumptions, a reasonable basis has been established to support the prospect of eventual economic extraction. Moreover, the selected cut-off grade is consistent with values used in other projects at a similar study level and employing comparable processing methodologies.
The applied 300 mg/L cut-off grade, which is more conservative than the breakeven cut-off grade of 224 mg/L, provides a margin of precaution considering potential lithium price volatility. Despite this conservative estimate, the cut-off remains well below the average lithium grade of the Measured and Indicated Resources (535 mg/L). The average grade of the Proven and Probable Reserves is even higher at 580 mg/L, representing a flux-weighted composite of brine routed to the evaporation ponds. Lithium concentrations from individual production wells and the overall reserve average substantially exceed the applied cut-off, reinforcing the economic viability of the project.
Key factors that may influence the resource and reserve estimates include: the position and extent of aquifer boundaries; the lateral continuity of principal aquifer zones; potential dilution from fresh and brackish water sources within the wellfield; variability in aquifer parameters within specific hydrostratigraphic units; assumptions regarding commodity prices, hydrogeologic and metallurgical performance, and extraction efficiency; as well as the methods used to assign brine densities and assess reasonable prospects for eventual economic extraction.
| 1.8 | Mining Methods |
| 1.8.1 | Brine Processing |
In 2019, Exar implemented a Feasibility Study based on new tests work and the 2012 Feasibility Study. With additional test information, Exar developed a process for converting brine to high-purity lithium carbonate. The proposed process follows industry standards: pumping brine from the salar, concentrating the brine through evaporation ponds, and taking the brine concentrate through a hydrometallurgical facility to produce high-grade lithium carbonate. While the 2012 process model employed proprietary, state-of-the-art physiochemical estimation methods and process simulation techniques for electrolyte phase equilibrium, the 2019 model uses a process model that has been further refined using the results of lab scale and pilot scale testing from Exar, Ganfeng Lithium, and equipment suppliers, the results of which are reflected in the 2019 Feasibility Study and implemented in the detail engineering of the facilities. The basis of the process methods has been tested and supported by laboratory test work, pilot testing facilities, and equipment vendor testing and design to support equipment guarantees.
| 1.8.2 | Lithium Carbonate Plant Production |
The process route simulated for the production of lithium carbonate from Cauchari brines resembles the flowsheet presented in Figure 1.2 Overall Process Block Diagram.
Primary process inputs include concentrated brine, water, lime, soda ash, SX organic, HCl, NaOH, CaCl2 and BaCl2. The evaporation ponds produce salt tailings composed of Na, Ca, K, sulphate and borate salts. The brine concentrate from the terminal evaporation pond is further processed, through a series of polishing and impurity removal steps. Soda ash is then reacted with the purified brine concentrate to produce lithium carbonate that is dried and packaged for shipping.
Lithium Argentina AG., 2026 Cauchari-Olaroz S-K 1300 Technical Report Cauchari-Olaroz Salars, Argentina | Page 22 of 418 |
Figure 1.2 Overall Process Block Diagram
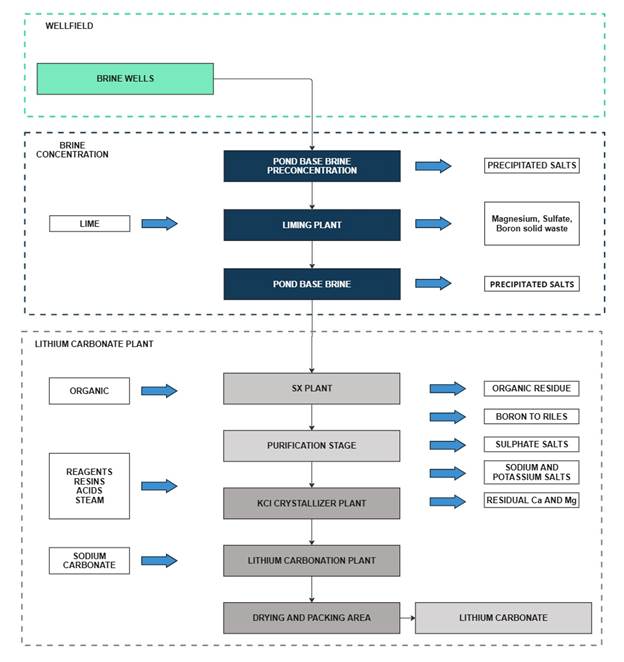
Lithium Argentina AG., 2026 Cauchari-Olaroz S-K 1300 Technical Report Cauchari-Olaroz Salars, Argentina | Page 23 of 418 |
Design criteria for the Lithium Carbonate plant is presented in Table 1.3.
| Table 1.3 Lithium Carbonate Plant Design Criteria | ||
| Description | Unit | Value |
| Li2CO3 production | tonnes per year | 40,000 |
| Annual operation days | days | 292 |
| Annual operation hours | hours | 7008 |
| Availability | % | 80 |
| Utilization (22 h/d) | % | 91.7 |
| Plant Overall Efficiency (lithium recovery) | % | 53.7 |
Overall lithium recovery increased from 53.7% (plant design efficiency) in 2024 to 63% in 2025.
| 1.9 | Site Infrastructure and Buildings |
| 1.9.1 | Wells |
| 1.9.1.1 | Well Production Equipment Selection |
Screened wells target the largest lithium brine aquifers. Submersible electric pumps are used for brine pumping. These pumps send the brine to evaporation ponds through a network of pipelines and mixing pools.
| 1.9.2 | Evaporation Ponds |
An average water evaporation rate of 6.26 mm per day was used as criterion to design the pond system. This rate corresponds to measured evaporation rates observed at the site where the ponds are located.
Assuming the above-mentioned evaporation rate, the total evaporation area required for the production of 40,000 tpa of lithium carbonate is 1,200 ha when including consideration for harvesting of salt deposited in the ponds. The ponds are lined with multi-layer liner consisting of a polymer-based material and engineered granular bedding. The ponds configuration includes provision for uninterrupted production during salt harvesting and maintenance work.
Brine is transferred between the successive evaporation ponds using self-priming pumps.
| 1.9.3 | Salt Harvest Equipment |
In order to recover pond volume taken up by precipitated salt and recover lithium values entrapped with the brine; salt is harvested. Harvesting began after the third year of ponds operation.
The harvesting operation consists of draining the free brine from the pond, scraping the salt to a minimum depth, and making drainage trenches before removing salt.
Lithium Argentina AG., 2026 Cauchari-Olaroz S-K 1300 Technical Report Cauchari-Olaroz Salars, Argentina | Page 24 of 418 |
| 1.9.4 | Site Infrastructure and Support Systems |
| 1.9.4.1 | Natural Gas Pipeline |
Natural gas is obtained from the Rosario gas compression station, which is on the Gas Atacama pipeline, 52 km north of the Project site.
Capital costs for this pipeline were US$7.2M. This pipeline can supply natural gas at capacities that are sufficient for a 40,000 tpa LCE facility.
| 1.9.4.2 | Power Supply |
Electricity is provided by a new 33 kV transmission line that interconnects with an existing 345 kV transmission line located approximately 60 km south of the Project. The interconnection consists of a sub-station with a voltage transformer (345/33 kV) and associated switchgear.
A stepdown 33/13.2 kV substation at the Project site, consist of two voltage transformers (33/13,2 kV, 15-20 MVA), one (1) 33 kV electrical room and one (1) 13.2 kV electrical room with suitable switchgears and auxiliary equipment for the 13.2 kV local distribution system.
The 13.2 kV local electrical distribution system provides power to the plant, camp, intermediate brine accumulation and homogenizing pools/lime pumps, wells, and evaporation ponds. In general, all the distribution is based on overhead lines, unless there are major restrictions then the underground distribution is adopted.
The estimated average load for the Project is around 16.4 MW or 123,461 MWh/y, assuming a plant and periphery utilization factor of 0.86. The power line has sufficient capacity for this load plus the existing users. The installed power energy is 16 MW.
The whole electrical system is designed for the maximum load condition plus a safety factor of 1.2.
A stand-by diesel generating station, located close to main substation, power selected equipment during outages. Also, the project has 2 UPS to sustain energy for a period and to stabilize power.
| 1.9.4.3 | Permanent Camp |
The permanent camp (called Operations Camp), and the Construction Camp are located 8,000 m south of National Highway 52. The Operations Camp is a complete housing and administrative complex to support all activities of the operation with a capacity of 762 people.
The Operations Camp includes office buildings, bedrooms, dining facilities, medical room, and recreation areas, consisting of a gym, an indoor sports center, a recreation room and an outdoor soccer field.
In the Construction Camp there are eight housing modules with a total capacity of 392 people, of which only three modules are currently in use. In addition, this camp includes the pilot plant facilities, water treatment plants and contractor workshops.
Lithium Argentina AG., 2026 Cauchari-Olaroz S-K 1300 Technical Report Cauchari-Olaroz Salars, Argentina | Page 25 of 418 |
| 1.9.4.4 | Other Buildings |
Other buildings include:
| · | A warehouse for spare parts and consumables; |
| · | A steel building for the storage of soda ash; |
| · | A steel building for the storage of solvent extraction plant chemicals designed with appropriate ventilation, safety, and security features; |
| · | Operating facilities for sheltering operators, electrical equipment, and central control rooms; and, |
| · | Product storage facility designed for protecting the product against contamination and staging it for shipment. |
| 1.9.4.5 | Security |
At the main entrance of the plant, there is a barrier and a security booth to grant access to the facilities. There is a second access control point upon reaching the main module of the camp. There, individuals’ entry is registered again using facial and fingerprint recognition.
Given the remote location of the facilities, it is not necessary to enclose the plant with a metallic perimeter fence. The plant is illuminated to allow night work and improve security.
| 1.9.4.6 | Access and Site Roads |
Access to the plant site is via paved National Highways 9 and 52, which connect the site to San Salvador de Jujuy and Salta in Argentina. In addition, National Highway 52 connects to Paso Jama to the west, a national border crossing between Chile and Argentina, and provides connection to Chilean Route 27 and convenient access to Antofagasta.
Access within the site is possible through Route 70, a gravel road, which skirts the west side of the salars. This road is approximately 1 km from the plant site. Access roads to ponds, wells, and other infrastructure were part of the overall construction.
| 1.9.4.7 | Fuel Storage |
The plant includes a diesel storage and dispensing station for mobile equipment and transport vehicles. Diesel fuel can also be used in stand-by generators and back up for dryers in the plant. The main fuel for equipment operation will be natural gas.
| 1.9.4.8 | Water Supply |
A 53 km long water pipeline parallel to the gas pipeline was constructed to transport 105 L/s to the lithium plant.
Water for industrial use is supplied by groundwater wells adjacent to the salar and a water pipeline from the north. The actual water consumption is 70-80 L/s.
Lithium Argentina AG., 2026 Cauchari-Olaroz S-K 1300 Technical Report Cauchari-Olaroz Salars, Argentina | Page 26 of 418 |
| 1.9.4.9 | Pond Solid Wastes |
The pond evaporation process leaves considerable amounts of salts on the bottom of the ponds. These salt piles may reach up to 15 m in height. It is estimated that approximately 740 ha of salt piles will be built over a 40-year period and these piles are built near the pond areas.
These discarded salts are classified as inert waste. The salts are generated from brines and do not introduce foreign compounds. It is estimated that sodium chloride and sulphate make up over 87% of this waste.
| 1.9.4.10 | Tailings Liquid Disposal |
Several possible sites for liquid industrial waste evaporation ponds were analyzed. These ponds are similar to the evaporation ponds, complete with liner. A 50 ha parcel located close to the plant was selected for the industrial waste evaporation ponds and presents no risks to distant populated areas.
| 1.10 | Market Studies and Contracts |
The outlook for lithium demand is positive, driven by the development of electromobility and the growing need for batteries in the electronics industry. Lithium consumption is expected to increase significantly in the coming years driven by a rapid increase in demand for EVs.
The global lithium mineral production is largely driven by spodumene operations in Australia, brine operations in Chile and Argentina and lithium chemical conversion in China.
A market review was performed to establish three pricing scenarios for lithium carbonate (per ton) used in the economic analysis.
Both Lithium Argentina and Ganfeng Lithium are entitled to a share of offtake from production at the Caucharí-Olaroz Project. The Company is entitled to 49% of offtake, which would amount to approximately 19,600 tpa of lithium carbonate assuming full capacity is achieved.
| 1.11 | Permitting, Environmental Studies and Social or Community Impact |
| 1.11.1 | Permits and Authorities |
Permitting processes for the Project are governed by Argentina’s national and provincial laws, with oversight from the Jujuy provincial government. Recent updates under Decree No. 7751-DEyP-2023 have modernized permitting standards, including enhanced consultation protocols and mandatory financial assurances for closure. The Project’s permits for exploration and exploitation activities are in full compliance, with biannual updates submitted as required.
Exploration permits require the submission of an Environmental Impacts Report (“IIA”), which details the scope of proposed exploration activities and their potential environmental impacts. The Provincial Government of Jujuy, through the Mining and Energy Resource Directorate, reviews and approves these reports. These permits require updates every two years.
On February 11, 2023, the Provincial Executive Government of Jujuy issued Decree No. 7751-DEyP-2023 (the “Decree”), which regulates the General Environmental Law No. 5063 and comprehensively updates provincial environmental protection norms for mining activities. This Decree replaces Decree No. 5772/2010, previously governing this domain.
Lithium Argentina AG., 2026 Cauchari-Olaroz S-K 1300 Technical Report Cauchari-Olaroz Salars, Argentina | Page 27 of 418 |
On December 2025, an Environmental Impact Report for additional 45,000 tpa of LCE for new expansion plant has been submitted. In addition, the Biannual Environmental Impact Report for Exploitation has been submitted for the current operation.
| 1.11.2 | Social or Community Impact |
Community engagement and consultation processes have been ongoing since 2009, fostering trust and cooperation. Social impact assessments highlight the Project’s contributions to local economic development, infrastructure improvements, and cultural preservation. Comprehensive studies have been completed to understand the Project’s impacts, robust monitoring processes to track progress, and targeted investments in critical sectors such as infrastructure, education, and healthcare.
Project perceptions in the surveyed communities conclude a generally positive opinion of the mining industry as it has recently become an economic pillar of the region. Accordingly, the Project is viewed as a source of job opportunities.
The population directly impacted by the Project is mostly rural and self-identifies with the Atacama ethnic group. In general, their settlement patterns and spatial dispersion is based on the camelid’s pasturage activity. The area of direct influence for the Project includes the communities of Susques, Huáncar, Pastos Chicos, Puesto Sey, Catua and Olaroz Chico. All these communities are in the department of Susques, Province of Jujuy, with the town of Susques being the head of the Department.
Exar has developed a program that promotes social and economic development within a sustainability framework and aims to address the evolving needs of local communities, focused employment, training, and equitable benefit-sharing while addressing concerns related to resource management and cultural heritage.
| 1.11.3 | Environmental Baseline Studies |
Environmental baseline data were compiled through extensive studies commissioned by Exar. Initial studies were conducted between 2010 and 2011, with regular updates and quarterly participatory monitoring from 2017 to 2025. Environmental Impacts Reports (EIRs) have been periodically updated and approved to account for evolving Project layouts and operational changes.
Quarterly follow-up campaigns since 2017 confirmed stable water quality conditions. For surface water, the natural concentrations of aluminum, boron, and iron exceed permissible limits for drinking water.
Air quality measurements of PM10, SO2, NO2, O3, and H2S fall within permissible limits per provincial guidelines. Recent campaigns note reductions in PM10 levels at Vega Alegría and Vega Archibarca, consistent with stricter dust control measures.
The Project area has a low biodiversity although there are some zones within it that are more diverse than others, such as shrub steppes and meadows, the Archibarca cone being the zone with the greatest biodiversity within the Project area.
Lithium Argentina AG., 2026 Cauchari-Olaroz S-K 1300 Technical Report Cauchari-Olaroz Salars, Argentina | Page 28 of 418 |
Follow up fauna and flora monitoring campaigns were carried out around the pilot plant in March 2015 and in October 2016 and quarterly monitoring from 2017 through 2025. Diversity results indicate that there is no significant change in the diversity parameters.
| 1.12 | Capital and Operating Cost Estimate |
| 1.12.1 | Capital Cost Estimate |
Capital costs for the Project (CAPEX) are based on the total engineering and construction work, having a design capacity of 40,000 tonnes per year of lithium carbonate.
The CAPEX is expressed in current US dollars on a 100% project equity basis. LAR contributed 49% of these costs, matching its shareholding in Exar and excluding JEMSE’s 8.5% interest.
Capital costs include direct and indirect costs for:
| · | Brine production wells. |
| · | Evaporation and concentration ponds. |
| · | Lithium carbonate plant. |
| · | General site areas, such as electric, gas, and water distribution. |
| · | Stand-by power plant, roads, offices, laboratory and camp, and other items. |
| · | Off-site infrastructure, including gas supply pipeline and high voltage power line and water pipeline; and |
| · | Salaries, construction equipment mobilization, and other expenses. |
The capital investment for the 40,000 tpa lithium carbonate project, including equipment, materials, indirect costs and contingencies after completion of the construction period is consolidated to US$979 million. This total excludes interest expense capitalized during the same period. Disbursements of these expenditures started in 2017 as part of the 25,000 tpa lithium carbonate project. These capital expenditures are summarized in Table 1.4.
| Table 1.4 Capital Costs Summary | |
| Item | US$ M |
| Direct Cost | |
| Salar Development | 51.0 |
| Evaporation Ponds | 175.5 |
| Lithium Carbonate Plant and Aux. | 361.7 |
| Reagents | 26.2 |
| On-Site Infrastructure | 108.7 |
| Off-site Services | 13.6 |
| Total Direct Cost | 736.7 |
Lithium Argentina AG., 2026 Cauchari-Olaroz S-K 1300 Technical Report Cauchari-Olaroz Salars, Argentina | Page 29 of 418 |
| Table 1.4 Capital Costs Summary | |
| Item | US$ M |
| Indirect Cost | |
| Total Indirect Cost | 224.5 |
| Total Direct and Indirect Cost | |
| Total Direct and Indirect | 961.2 |
| Others | 17.8 |
| Total Capital | 979 |
| Expended to date | 979 |
| Estimate to complete | - |
| 1.12.2 | Exclusions |
The following items are not included in this estimate:
| · | Legal costs. |
| · | Special incentives and allowances. |
| · | Mineral license costs. |
| · | Escalation; and |
| · | Start-up costs beyond those specifically included. |
| 1.12.3 | Currency |
All values are expressed in current US dollars. During the construction periods, Argentine peso denominated costs follow the exchange rate as a result of inflation, and there was a significant impact of the exchange rate fluctuation on CAPEX and OPEX.
| 1.12.4 | Operating Cost Estimate |
The operating cost (OPEX) estimate for a 40,000 tpa lithium carbonate facility has been prepared using data generated during the ramp up (Table 1.5). The OPEX that defined by Exar at this stage for a 40,000 tpa lithium carbonate is US $5,411 per tonne.
Reagent consumption rates that were determined by pilot plant, laboratory, and computer model simulation have been actualized based on data obtained during ramp up period. Reagent cost values, which represent 36% of OPEX, has been obtained from the suppliers servicing the actual plant operation. Energy consumption has been determined on an equipment-by-equipment basis and design utilization rate and confirmed with actual operational data. Labour levels are confirmed in accordance with Exar Management’s operating the new facility. Salary and wage are based on the actual data being used by Exar in Argentina. Maintenance estimates were updated by Exar’s management based on the actual maintenance cost and projected future cost based on their experience with similar operations.
Lithium Argentina AG., 2026 Cauchari-Olaroz S-K 1300 Technical Report Cauchari-Olaroz Salars, Argentina | Page 30 of 418 |
| Table 1.5 Operating Costs Summary | |||
| Description |
Total |
Li2CO3 |
Allocation of Total OPEX (%) |
| Direct Costs | |||
| Reagents | 78,986 | 1,975 | 36% |
| Maintenance | 16,300 | 408 | 8% |
| Electric Power | 7,362 | 184 | 3% |
| Pond Salt Harvesting | 20,259 | 506 | 9% |
| Solid Waste Management (Rises) | 6,933 | 173 | 3% |
| Natural Gas | 4,567 | 114 | 2% |
| Labour | 31,823 | 796 | 15% |
| Other Personnel Expenses | 2,516 | 63 | 1% |
| Catering, Security & Third-Party Services | 25,860 | 646 | 12% |
| Consumables | 4,226 | 106 | 2% |
| Diesel | 829 | 21 | 0% |
| Bus-in/Bus-out Transportation | 938 | 23 | 0% |
| Direct Costs Subtotal | 200,598 | 5,015 | 93% |
| Indirect Costs | |||
| G&A | 15,824 | 396 | 7% |
| Indirect Costs Subtotal | 15,824 | 396 | 7% |
| Total Operating Costs | 216,423 | 5,411 | 100% |
| 1.12.5 | Sustaining Capital Expenditures (Sustaining CAPEX) |
A provision of US$971million of the sustaining capital over the life of the Project was included in the economic model. The sustaining capital includes purchase of equipment or development of facilities which would otherwise be capitalized. The sustaining capital costs include processing equipment to be purchased in future years, replacement of equipment, drilling of replacement wells, capital repairs of ponds, equipment replacement for the processing plant, etc.
For the next 10 years, it is estimated that US$23.7 million will be allocated annually to sustainability capital, which is equivalent to US$601.4 per ton of lithium carbonate.
The capital expenditures schedule is presented in Table 1.6, which contains consolidated Sustaining CAPEX Expenditures Schedule from 2025 for the life of the Project.
| Table 1.6 Sustaining CAPEX Expenditure Schedule | |||
| Description |
2025-2035 |
2036-2060 |
Total |
| Total | 237,000 | 734,000 | 971,000 |
Lithium Argentina AG., 2026 Cauchari-Olaroz S-K 1300 Technical Report Cauchari-Olaroz Salars, Argentina | Page 31 of 418 |
| 1.13 | Conclusions and Recommendations |
| 1.13.1 | Conclusions |
| · | Brine: The Mineral Resource and Mineral Reserves described in this report occur in subsurface brine. The brine is contained within the pore space of salar deposits that have accumulated in a structural basin. |
| · | 2026 Mineral Reserve Estimate: Assuming a processing efficiency of 63 percent for forecasting an economic reserve over the 35-year life of mine plan, the total 2026 Mineral Reserve Estimate for Proven and Probable Mineral Reserves is 1,414,682 tonnes of LCE. The exploration in Cauchari South together with the updated information from the production wells has increased the M+I resources to 25,898,489 t LCE. In addition, the Stage 1 numerical model shows a final concentration of 561.3 mg/L of lithium and maximum drawdowns above 20 m which leaves room for a future expansion project in Stage 2 of approximately 45,000 tpa additional capacity. |
| · | To support the updated Mineral Reserve Estimate Aquatec developed a new hydrostratigraphic framework and numerical model and the expanded dataset. Following calibration with the historical operation and production data, the updated numerical model simulated the current production wellfield to evaluate the ability of the brine aquifer to sustain a minimum target of 40,000 tonnes per year (tpa) LCE over a 35-year operational period which is reported as reserves, starting January 1 2026 and extending through the end of year 2060. Following the verification that the current production wellfield is capable of delivering sufficient brine to sustain the minimum Stage 1 target production rate of 40,000 tpa of LCE, ongoing updates to the calibrated numerical model are being undertaken to evaluate the maximum production rate from the entire Salar basin. These modeling efforts are designed to support the estimation of a Total Mineral Reserve to allow for a Stage 2 expansion reaching a total production of more than 80,000 tpa over a 40-year operating life. Stage 2 will be incorporating a new DLE technology that will help increase the Lithium recovery, reduce the land footprint and accelerate the Project schedule. |
| · | Lithium Industry: Market studies indicate that the lithium industry has a promising future. The use of lithium ion batteries for electric vehicles and renewable energy storage applications are driving lithium demand. |
| · | Project Capital Cost: The capital investment for the 40,000 tpa lithium carbonate Cauchari-Olaroz, including equipment, materials, indirect costs and contingencies during the construction period was defined at US$979 million. A production design capacity of 40,000 tpa of lithium carbonate, has been implemented and the facility has reached over 80% design capacity during the second year of the ramp up period. |
| · | The main CAPEX drivers were the pond construction and the lithium carbonate plant, which represent 57% of total project capital expenditures. |
| · | Operating Costs: The operating cost estimate (+/-15% accuracy) for the 40,000 tpa lithium carbonate facility is US$5,411 per tonne. This figure includes pond and plant chemicals, energy/fuel, labour, salt waste removal, maintenance, camp services, and transportation. |
Lithium Argentina AG., 2026 Cauchari-Olaroz S-K 1300 Technical Report Cauchari-Olaroz Salars, Argentina | Page 32 of 418 |
| 1.13.2 | Recommendations |
| · | Based on the conceptual hydrogeologic system and results of the numerical model, considering the production model since 2018 until the end of 2025, the authors believe it is appropriate to estimate that the Proven Mineral Reserve is what the QPs believe is feasible to be pumped to the evaporation ponds and recovered for the next ten years of operations. |
| · | The ongoing work in the full basin numerical model is being developed to support the Stage 2 expansion project of approximately 45,000 tpa additional capacity. This stage will consider the new DLE technology for increasing the lithium recovery and reducing the project construction schedule. |
| · | QA/QC: The QA/QC program, using regular insertions of blanks, duplicates, and standards was discontinued in 2024 and the average value for each production well was carefully monitored. All exploration samples should be analyzed at Alex Stewart and QA/QC sampling should continue when exploration activities resume. |
| · | The QPs recommend investigating process modifications to the carbonation process step in order to reduce the sulphate content in the final product. |
| · | The on-site laboratory should obtain ISO 17025 certification for analytical laboratories. |
| · | Financial Assurances: Establish and maintain the required financial guarantees for closure. |
| · | Stakeholder Engagement: Continue proactive engagement to address environmental and social priorities to identify and address potential Project related issues at an early stage in collaboration with affected parties. |
The estimated cost for the recommendations is summarized in Table 1.7.
| Table 1.7 Recommendations Budget | |
| Item |
Budget |
| Mineral Resource and Reserve Expansion Update | $200,000 |
| Stage 2 Preliminary Economic Assessment | $250,000 |
| ISO 17025 Accreditation | $20,000 |
| Updated Technical Report | $80,000 |
| Permitting and Social Community Work | $200,000 |
| Total | $750,000 |
Lithium Argentina AG., 2026 Cauchari-Olaroz S-K 1300 Technical Report Cauchari-Olaroz Salars, Argentina | Page 33 of 418 |
| 2.0 | Introduction |
| 2.1 | Terms of Reference |
Lithium Argentina AG (“Lithium Argentina” or “LAR”) retained Deptford Geoscience Inc. (“Deptford”) to complete an independent S-K 1300 compliant 2026 Technical Report – S-K 1300 Cauchari-Olaroz Technical Report, located in the Province of Jujuy in Argentina. The supervising Independent Qualified Person (“QP”) for the Report is Mr. David Burga, P.Geo. of Deptford Geoscience Inc.
This Technical Report was prepared to update aspects of the project including project development work to date, the Mineral Resource and Mineral Reserve Estimates, and updated estimates of capital costs and operating costs. The Mineral Resource and Mineral Reserve Estimates were prepared in compliance with the S-K regulations.
This report was prepared by the authors, at the request of LAR, a Swiss registered company, trading under the symbol of “LAR” on the Toronto Stock Exchange and the New York Stock Exchange with its corporate office at:
DAMMSTRASSE 19
6300 ZUG
SWITZERLAND
This report is considered current as of February 27th, 2026.
| 2.2 | Qualified Persons Site Visits |
Mr. David Burga, P.Geo. (Deptford), conducted a site visit of the Property on January 24, 2017, February 19 through 21, 2019, June 10 and 12, 2019 to review the drilling work from 2017 and 2018, the QA/QC procedures, interview geologists on site and conduct a verification sampling program. He most recently visited the site between November 20 and 21, 2024 to observe the status of the project and interview personnel. Dr. Mark King, P.Geo., (Groundwater Insight), conducted several site visits to the Property, with the most recent occurring on September 12-15, 2011., to review site conditions and to verify core logging and description methods. Mr. Anthony Sanford, Pr.Sci.Nat. visited the Project on February 14 and 15, 2017 and July 23 and 24, 2019 to observe site conditions and interview key environmental personnel. Mr. Marek Dworzanowski, C.Eng., visited the site on September 10, 2025, to inspect the liming plant and the lithium carbonate plant.
| 2.3 | Sources of Information |
This report is based, in part, on internal company technical reports maps, published government reports, company letters, memoranda, public disclosure and public information, as listed in the References at the conclusion of this report. Sections from reports authored by other consultants have been directly quoted or summarized in this report and are so indicated where appropriate.
The 2026 Mineral Reserve Estimate was developed for the Project using MODFLOW-USG, a control volume finite difference code, coupled with the Groundwater Vistas modeling interface. The groundwater modeling was supported by geological, hydrogeological, geochemical, and geophysical data collected through field programs at the site.
Lithium Argentina AG., 2026 Cauchari-Olaroz S-K 1300 Technical Report Cauchari-Olaroz Salars, Argentina | Page 34 of 418 |
| 2.4 | Units and Currency |
Unless otherwise stated all units used in this report are metric. Salt contents in the brine are reported in weight percentages or mass per volume.
All values are expressed in current US dollars; the exchange rate between the Argentine peso were adjusted at the time of the incurred cost. Argentine peso denominated costs follow the exchange rate as a result of inflation, and the impact of the exchange rate fluctuation on CAPEX and OPEX has been incorporated; no provision for currency escalation has been included.
The coordinate system used by Cauchari for locating and reporting drill hole information is the UTM system. The Property is in UTM Zone 19K and the WGS84 datum is used. Maps in this Report use either the UTM coordinate system or Gauss Kruger-Posgar 94 datum coordinates that are the official registration coordinates of the local registry.
The following list shows the meaning of the abbreviations for technical terms used throughout the text of this report, Table 2.1.
Table
2.1
Abbreviations Table
| Abbreviation | Meaning |
| ” | inches |
| > | greater than |
| < | less than |
| % | percent |
| ° | degrees |
| °C | Celsius degrees |
| $ | dollar(s) |
| $ M | millions of dollars |
| µg/m3 | micrograms per cubic meter |
| 2-D | two-dimensional |
| 3-D | three-dimensional |
| AA | atomic absorption |
| amsl | above mean sea level |
| AMT | Audiomagnetotelluric |
| AR$ | Argentine Pesos |
| ASA | Alex Stewart Argentina S.A. |
| ASL | Alex Stewart Laboratories S.A. |
| ASTM | American Society of Testing and Materials |
| avg | average |
| B | boron |
| Bangchak | BCP Innovation Pte Ltd. |
| BESS | battery energy storage systems |
| bls | below land surface |
| Borax Argentina | Borax Argentina S.A. |
| CIM | Canadian Institute of Mining, Metallurgy and Petroleum |
| Ca | calcium |
| CaCl2 | calcium chloride |
| CaCO3 | calcium carbonate |
| CaO | calcium oxide |
| CAPEX | capital expenditure |
Lithium Argentina AG., 2026 Cauchari-Olaroz S-K 1300 Technical Report Cauchari-Olaroz Salars, Argentina | Page 35 of 418 |
| Cauchari-Olaroz Project | Cauchari-Olaroz Salars that are the subject of this Technical Report |
| Cc | curvature coefficient |
| CEO | Chief Executive Officer |
| CIM | Canadian Institute of Mining, Metallurgy and Petroleum |
| CIS | Commonwealth of Independent States |
| Cl | chloride |
| cm | centimeter(s) |
| Company, the | Lithium Argentina AG |
| CRM | Certified Reference Materials |
| Cu | uniformity coefficient |
| CV | coefficient of variation |
| dBA or dB(A) | A-weighted decibels |
| DD | diamond drilling |
| DDH | diamond drill hole |
| Decree, the | Provincial Executive Government of Jujuy issued Decree No. 7751-DEyP-2023, issued on February 11, 2023 |
| DEM | digital elevation model |
| Deptford | Deptford Geoscience Inc. |
| DFS | definitive feasibility study |
| DIA | Declarations of Environmental Impact |
| DLE | direct lithium extraction |
| DPRH | provincial water resources department |
| E | east |
| EC | electrical conductivity |
| EDA | Exploratory Data Analysis |
| EIA | Estudio de Impacto Ambiental (Environmental Impact Assessment) |
| EIR | Environmental Impacts Report |
| EMP | Environmental Management Plan |
| EP | Equator Principles |
| ET | evapotranspiration |
| EV | electric vehicles |
| Exar | Minera Exar S.A. |
| FPIC | free and prior informed consent |
| FS | Feasibility Study |
| G&A | General and Administration |
| g/cm3 | grams per cubic centimeter |
| g/L | grams per liter |
| Ganfeng | Ganfeng Lithium Co. Ltd. |
| Ganfeng Lithium | Ganfeng Lithium Co. Ltd. |
| GEC | Geophysical Exploration Consulting |
| GFL | Ganfeng Lithium Co. Ltd. |
| GRI | Global Reporting Initiative |
| h | hour |
| h/d | hours per day |
| H2S | hydrogen sulphide |
| H3BO3 | boric acid |
| ha | hectares |
| HCl | hydrogen chloride |
| HCO3 | bicarbonate |
| HKEX | Hong Kong Stock Exchange |
| HMS | Hydrologic Modeling System |
Lithium Argentina AG., 2026 Cauchari-Olaroz S-K 1300 Technical Report Cauchari-Olaroz Salars, Argentina | Page 36 of 418 |
| hPa | hectopascal |
| HSU(s) | hydrostratigraphic unit(s) |
| HVAC | heating, ventilation, and air conditioning |
| ICP | inductively coupled plasma |
| ID | identification |
| ID | Inverse Distance |
| ID2 | Inverse Distance Squared |
| IFC | International Finance Corporation |
| IIA | Indicador de Impacto Ambiental (Environmental Impact Indicator, an Environmental Impacts Report) |
| IIT | Instituto de Investigaciones Tecnológicas (Technology Investigations Institute) |
| ILO | International Labour Organization |
| In | inches |
| IRR | internal rate of return |
| ISO | International Organization for Standardization |
| ITT | Instituto de Investigaciones Tecnológicas (Technology Investigation Institute) of the Universidad de Concepción |
| JEMSE | Jujuy Energía y Minería S.E. |
| JV | joint venture |
| K | potassium |
| K | hydraulic conductivity |
| K2Mg(SO4)2·4H2O | leonite | |
| K2Mg(SO4)2·6H2O | schoenite | |
| K2SO4 | potassium sulphate | |
| K2SO4.CaSO4·H2O | syngenite | |
| K3Na(SO4)2 | glaserite |
| KCl | potassium chloride, potash |
| kg | kilograms |
| km | kilometers |
| km2 | square kilometers |
| km/h | kilometers per hour |
| kMt | thousands of millions of tonnes |
| Kr | radial hydraulic conductivity |
| kt | kilotonne, 1,000 tonnes |
| ktpa | thousands of tonnes per annum or year |
| kriging | a Gaussian process regression method of interpolation governed by prior covariances |
| kV | kilovolts |
| Kx | Hydraulic Conductivity in the X direction |
| Ky | Hydraulic Conductivity in the Y direction |
| Kz | Hydraulic Conductivity in the Z direction |
| L | litres |
| L/s | litres per second |
| LAR | Lithium Argentina AG |
| LCE | lithium carbonate equivalent |
| Li | lithium |
| Li2CO3 | lithium carbonate |
| Lithium Argentina | Lithium Argentina AG |
| LOM | life of mine |
| Los Boros | Grupo Minero Los Boros |
Lithium Argentina AG., 2026 Cauchari-Olaroz S-K 1300 Technical Report Cauchari-Olaroz Salars, Argentina | Page 37 of 418 |
| LSGC | Lower Salt Generation Cycle |
| M | millions of dollars |
| m | the second fitting exponent for the capillary head curve |
| m | meters |
| m/d | meters per day |
| m-1 | 1/meter | |
| m2 | square meters | |
| m3 | cubic meters | |
| m3/h | cubic meters per hour |
| Ma | millions of years |
| masl | meters above sea level |
| Max | maximum |
| m b.g.l. | meters below natural ground level |
| mbgs | meters below ground surface |
| mbtw | meters below top of well |
| ME | Minera Exar S.A. |
| Mg | manganese |
| mg/L or mg/l | milligrams per liter |
| mGal | 10-3 gal, also called galileo (10-3 cm/s2) |
| MgCl2 | magnesium chloride |
| MgCl2·6H2O | bischofite |
| MgCl2·KCl·6H2O | carnalite |
| Mg(OH)2 | magnesium hydroxide |
| MgSO4·7H2O | epsomite |
| MgSO4·KCl·3H2O | kainite |
| Min | minimum |
| MJ/m² | megajoules per square meter |
| Mdl | minimum detection limit |
| mm | millimeters |
| MMBTU | million(s) British Thermal Units (BTU) |
| mm/yy | month/year |
| mol% | mole percent |
| Montgomery | Montgomery & Associates |
| MVA | megavolt-ampere |
| MW | mega watt |
| MWh/y | mega watt hours per year |
| n | the fitting exponent for the capillary head curve |
| n | sample size as in number of samples |
| N | north |
| Na | sodium |
| Na2Mg(SO4)2·4H2O | astrakanite |
| NAAQS | US National Association of Environmental Quality Standards |
| NaCl | sodium chloride |
| Na2CO3 | sodium carbonate, soda ash |
| NaOH | sodium hydroxide or caustic soda |
| NI 43-101 | Canadian National Instrument 43-101 |
| NMR | nuclear magnetic resonance |
| No. or no. | number |
| NPV | net present value |
| NYSE | New York Stock Exchange |
| φe | effective porosity |
Lithium Argentina AG., 2026 Cauchari-Olaroz S-K 1300 Technical Report Cauchari-Olaroz Salars, Argentina | Page 38 of 418 |
| OPEX | operating costs |
| Option Agreement | Exar entered into a purchase option agreement with Los Boros, March 28, 2016 |
| Orocobre | Orocobre Limited |
| OSC | Ontario Securities Commission |
| Pe | effective porosity |
| PEA | Preliminary Economic Assessment |
| PFS | Preliminary Feasibility Study |
| ppm | parts per million |
| Project, the | the Cauchari-Olaroz Salars Project, Jujuy Province, Argentina |
| Property, the | the Cauchari-Olaroz Salars Property that is the subject of this Technical Report |
| PVC | polyvinyl chloride |
| Q1, Q2, Q3 | first quartile, second quartile, third quartile |
| QAQC or QA/QC | quality assurance quality control |
| QC | quality control |
| QP | Qualified Person |
| RBRC | relative brine release capacity |
| RC | reverse circulation |
| Report, the | this Technical Report |
| RMS | root mean square |
| S | south |
| S | storativity |
| SDG | sustainable development goals |
| SDJ | Sales de Jujuy |
| Sm³/h | standard cubic meters per hour |
| SQM | Sociedad Quimica y Minera de Chile |
| Sr | strontium |
| Ss | specific storage |
| Std Dev | standard deviation |
| SX | solvent extraction |
| Sy | specific yield |
| t | tonne(s), metric tonne(s) |
| t/h | tonnes per hour |
| TDS | total dissolved solids |
| Technical Report, the | this Technical Report |
| TEM | Time Domain Electromagnetic |
| TOC | total organic carbon |
| tpa | tonnes per annum (tonnes per year) |
| TSX | Toronto Stock Exchange |
| UGAMP | Provincial Mining Environmental Management Unit |
| UPS | uninterruptible power supply |
| US$ | United States dollar(s) |
| US$ 000 | thousands of US dollars |
| US-EPA or USEPA | United States Environmental Protection Agency |
| USGC | Upper Salt Generation Cycle |
| USGS | United States Geological Survey |
| UTM | Universal Transverse Mercator (grid) |
| VES | Vertical Electrical Sounding |
| W | west |
| W/m2 | watts per square meter |
Lithium Argentina AG., 2026 Cauchari-Olaroz S-K 1300 Technical Report Cauchari-Olaroz Salars, Argentina | Page 39 of 418 |
| WB | World Bank |
| WGS84 | World Geodetic System 1984 |
| WHO | World Health Organization |
| wt% or wt.% | weight percent |
| y or yr | year |
Lithium Argentina AG., 2026 Cauchari-Olaroz S-K 1300 Technical Report Cauchari-Olaroz Salars, Argentina | Page 40 of 418 |
| 3.0 | Property Description and Location |
| 3.1 | Property Description |
The Cauchari and Olaroz Salars are located in the Department of Susques in the Province of Jujuy in northwestern Argentina. The salars extend in a north-south direction from S 23° 18’ to S 24° 05’, and in an east-west direction from W 66° 34’ to W 66° 51’. The average elevation of both salars is approximately 3,950 m.
Figure 3.1 shows the locations of both salars, approximately 270 km northwest of San Salvador de Jujuy, the provincial capital. The midpoint between the Olaroz and Cauchari Salars is located directly on National Highway 52, 55 km west of the Town of Susques where the Project field offices are located. The nearest port is Antofagasta, Chile, located 530 km west of the Project by road.
Lithium Argentina AG., 2026 Cauchari-Olaroz S-K 1300 Technical Report Cauchari-Olaroz Salars, Argentina | Page 41 of 418 |
Figure 3.1 Location of Cauchari-Olaroz
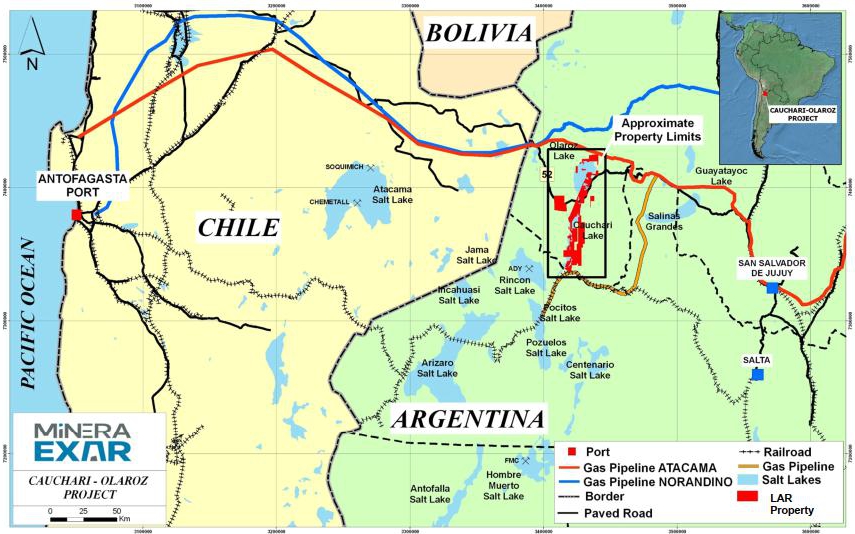
Source: Burga et al. (2019)
Lithium Argentina AG., 2026 Cauchari-Olaroz S-K 1300 Technical Report Cauchari-Olaroz Salars, Argentina | Page 42 of 418 |
| 3.2 | Property Area |
Minera Exar S.A. (“Exar”) has acquired mining and exploration permits applications through acquisition of such permits applications, direct request of permits from the applicable provinicial mining authority and/ or through brines usufruct agreements in the Province of Jujuy, Argentina, covering a total of 77,623 ha in the Department of Susques presented on Table 3.1. Some of the claims are still in the process of being granted by the Jujuy Mining Court and in order to present a conservative figure, the smaller figure in the ‘received’ column was used to calculate the property area. Figure 3.2 shows the location of the Exar claims in Cauchari-Olaroz. As shown in the figure, the claims are contiguous and cover most of the Cauchari Salar and the eastern portion of the Olaroz Salar.
The aggregate annual property payment required by the Argentine Mining Code to the Province of Jujuy that Exar needs to attend in order to maintain the tenements claims referenced in Figure 3.2 in good standing is approximately US$268,346 per year.
Under Exar’s usufruct agreement with Borax Argentina S.A. (“Borax Argentina”) signed on May 19th, 2011, Exar acquired Borax Argentina’s usufruct rights on properties in the area in exchange for an annual royalty of US$200,000 payable in May of each year plus annual canon rent property payments to Jujuy Province.
Lithium Argentina AG., 2026 Cauchari-Olaroz S-K 1300 Technical Report Cauchari-Olaroz Salars, Argentina | Page 43 of 418 |
Figure 3.2 Exar Property Claims at Cauchari-Olaroz
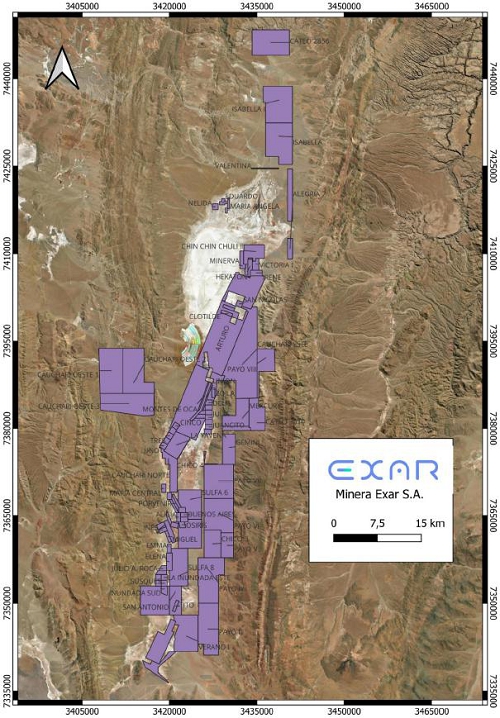
Source: Exar (2026)
Lithium Argentina AG., 2026 Cauchari-Olaroz S-K 1300 Technical Report Cauchari-Olaroz Salars, Argentina | Page 44 of 418 |
| Table 3.1 Exar Mineral Claims | |||||||
|
Claim |
File | Owner |
Claim |
Requested |
Received | Claim Status |
Contract |
| LA YAVEÑA | 27-R-00 | Minera Exar S.A. | Pedido de Mina | 1119.66 | 1119.66 | Active | Rights acquired |
| LUISA | 61-I-98 | Grupo Minero Los Boros S.A. | Mina | 4706.65 | 4076.65 | Active | Rights acquired |
| ARTURO | 60-I-98 | Grupo Minero Los Boros S.A. | Mina | 5049.85 | 5049.85 | Active | Rights acquired |
| ANGELINA | 059-I-98 | Grupo Minero Los Boros S.A. | Mina | 2346 | Active | Rights acquired | |
| CAUCHARI ESTE | 1149-L-09 | Minera Exar S.A. | Pedido de Mina | 5860 | 5860 | Active | Rights acquired |
| IRENE | 140-N-92 | Minera Exar S.A. | Mina | 200 | 200 | Active | Rights acquired |
| MINERVA | 37-V-02 | Minera Exar S.A. | Pedido de Mina | 229.52 | 229.52 | Active | Rights acquired |
| CHIN CHIN CHULI II | 201-C-04 | Vicente Costa y otros | Pedido de Mina | 910.81 | 910.81 | Active | Opted/Usufruct agreement |
| Hekaton | 150-M-92 | Minera Exar S.A. | Mina | 200 | 200 | Active | Rights acquired |
| Victoria I | 65-E-02 | Minera Exar S.A. | Mina | 300 | 300 | Active | Rights acquired |
| SAENZ PEÑA (Grupo Minero Boroquímica) | 354-C-44 | South America Salars S.A. | Mina | 300 | 100 | Active | Ususfruct Rights acquired |
| DEMASIA SAENZ PEÑA (Grupo Minero Boroquímica) | 354-C-44 | South America Salars S.A. | Mina | 100 | 59 | Active | Ususfruct Rights acquired |
| LINDA (Grupo Minero Boroquímica) | 160-T-44 | South America Salars S.A. | Mina | 100 | 100 | Active | Ususfruct Rights acquired |
| MARIA TERESA (Grupo Minero Boroquimica) | 378-C-44 | South America Salars S.A. | Mina | 100 | 100 | Active | Ususfruct Rights acquired |
| ARCHIBALD (Grupo Minero Boroquimica) | 377-C-44 | South America Salars S.A. | Mina | 100 | 100 | Active | Ususfruct Rights acquired |
| San Nicolas (Grupo Minero Boroquimica) | 191—R-44 | South America Salars S.A. | Mina | 100 | 100 | Active | Ususfruct Rights acquired |
Lithium Argentina AG., 2026 Cauchari-Olaroz S-K 1300 Technical Report Cauchari-Olaroz Salars, Argentina | Page 45 of 418 |
| Table 3.1 Exar Mineral Claims | |||||||
|
Claim |
File | Owner |
Claim |
Requested |
Received | Claim Status |
Contract |
| CLOTILDE | 121-D-44/1642-M-10 | Minera Exar S.A. | Mina | 100.18 | 100 | Active | Rights acquired |
| EDUARDO DANIEL | 120-M-1944 | Minera Exar S.A. | Pedido de Mina Vacante | 100.15 | 100 | Active | Purchased |
| CAUCHARI NORTE | 2892-M-2022 | Minera Exar S.A. | Pedido de Mina | 1038.77 | 1038.77 | Active | Purchased |
| DELIA (Grupo Minero Boroquimica) | 42-E-1944 | South America Salars S.A. | Mina | 100 | 100 | Active | Ususfruct Rights acquired |
| GRAZIELLA (Grupo Minero Boroquimica) | 438-G-1944 | South America Salars S.A. | Mina | 100 | 100 | Active | Ususfruct Rights acquired |
| MONTES DE OCA (Grupo Minero Boroquimica) | 340-C-1944 | South America Salars S.A. | Mina | 100 | 99 | Active | Ususfruct Rights acquired |
| JUANCITO (Grupo Minero Boroquimica) | 339-C-1944 | South America Salars S.A. | Mina | 100 | 100 | Active | Ususfruct Rights acquired |
| UNION (Grupo Minero Boroquimica) | 336-C-1944 | South America Salars S.A. | Mina | 300 | 100 | Active | Ususfruct Rights acquired |
| JULIA (Grupo Minero Boroquimica) | 347-C-1944 | South America Salars S.A. | Mina | 300 | 100 | Active | Ususfruct Rights acquired |
| MASCOTA (Grupo Minero Boroquimica) | 394-B-1944 | South America Salars S.A. | Mina | 300 | 300 | Active | Ususfruct Rights acquired |
| UNO (Grupo Minero Boroquimica) | 345-C-1944 | South America Salars S.A. | Mina | 100 | 100 | Active | Ususfruct Rights acquired |
| TRES (Grupo Minero Boroquimica) | 343-C-1944 | South America Salars S.A. | Mina | 100 | 100 | Active | Ususfruct Rights acquired |
| DOS (Grupo Minero Boroquimica) | 344-C-1944 | South America Salars S.A. | Mina | 100 | 100 | Active | Ususfruct Rights acquired |
| CUATRO (Grupo Minero Boroquimica) | 352-C-1944 | South America Salars S.A. | Mina | 100 | 100 | Active | Ususfruct Rights acquired |
Lithium Argentina AG., 2026 Cauchari-Olaroz S-K 1300 Technical Report Cauchari-Olaroz Salars, Argentina | Page 46 of 418 |
| Table 3.1 Exar Mineral Claims | |||||||
|
Claim |
File | Owner |
Claim |
Requested |
Received | Claim Status |
Contract |
| CINCO (Grupo Minero Boroquimica) | 351-C-1944 | South America Salars S.A. | Mina | 100 | 100 | Active | Ususfruct Rights acquired |
| ZOILA (Grupo Minero Boroquimica) | 341-C-1944 | South America Salars S.A. | Mina | 100 | 100 | Active | Ususfruct Rights acquired |
| SARMIENTO (Grupo Minero Boroquimica) | 190-R-1944 | South America Salars S.A. | Mina | 100 | 100 | Active | Ususfruct Rights acquired |
| PORVENIR (Grupo Minero Boroquimica) | 116-D-1944 | South America Salars S.A. | Mina | 100 | 100 | Active | Ususfruct Rights acquired |
| ALICIA (Grupo Minero Boroquimica) | 389-B-1944 | South America Salars S.A. | Mina | 100 | 100 | Active | Ususfruct Rights acquired |
| CLARISA (Grupo Minero Boroquimica) | 402-B-1944 | South America Salars S.A. | Mina | 100 | 100 | Active | Ususfruct Rights acquired |
| DEMASIA CLARISA (Grupo Minero Boroquimica) | 402-B-1944 | South America Salars S.A. | Mina | 19 | 19 | Active | Ususfruct Rights acquired |
| INES (Grupo Minero Boroquimica) | 220-S-1944 | South America Salars S.A. | Mina | 100 | 100 | Active | Ususfruct Rights acquired |
| MARIA CENTRAL (Grupo Minero Boroquimica) | 43-E-1944 | South America Salars S.A. | Mina | 100 | 100 | Active | Ususfruct Rights acquired |
| MARIA ESTHER (Grupo Minero Boroquimica) | 259-M-1944 | South America Salars S.A. | Mina | 100 | 100 | Active | Ususfruct Rights acquired |
| SAHARA (Grupo Minero Boroquimica) | 117-D-1944 | South America Salars S.A. | Mina | 300 | 300 | Active | Ususfruct Rights acquired |
| PAULINA (Grupo Minero Boroquimica) | 195-S-1944 | South America Salars S.A. | Mina | 100 | 100 | Active | Ususfruct Rights acquired |
| SIBERIA (Grupo Minero Boroquimica) | 206-B-1944 | South America Salars S.A. | Mina | 24 | 24 | Active | Ususfruct Rights acquired |
Lithium Argentina AG., 2026 Cauchari-Olaroz S-K 1300 Technical Report Cauchari-Olaroz Salars, Argentina | Page 47 of 418 |
| Table 3.1 Exar Mineral Claims | |||||||
|
Claim |
File | Owner |
Claim |
Requested |
Received | Claim Status |
Contract |
| SAN ANTONIO | 72-M-1099 | Minera Exar S.A. | Mina | 900 | - | Active | Rights acquired, area under dispute. Expecting 2400. |
| TITO | 48-P-1998 | Minera Exar S.A. | Mina | 100 | 100 | Active | Rights acquired |
| MIGUEL | 381-M-2005 | Minera Exar S.A. | Mina | 100.06 | 100.06 | Active | Rights acquired |
| VERANO I | 299-M-2004 | Minera Exar S.A. | Mina | 2448.25 | 2488.25 | Active | Rights acquired |
| CHICO 3 | 1251-M-09 | Minera Exar S.A. | Mina | 1400 | 1400 | Active | Rights acquired |
| CHICO 4 | 1252-M-09 | Minera Exar S.A. | Pedido de Mina | 773.02 | 773.02 | Active | Area under dispute |
| SULFA 6 | 70-R-1998 | Minera Exar S.A. | Mina | 1682.89 | 1682.89 | Active | Rights acquired |
| SULFA 7 | 71-R-1998 | Minera Exar S.A. | Mina | 1824.44 | 1824.44 | Active | Rights acquired |
| SULFA 8 | 72-R-1998 | Minera Exar S.A. | Mina | 1841.59 | 1841.59 | Active | Rights acquired |
| SULFA 9 | 67-R-1998 | Minera Exar S.A. | Mina | 1580.19 | 1580.19 | Active | Rights acquired |
| BECERRO DE ORO (Grupo Minero Osiris) | 264-M-1944 | Minera Exar S.A. | Mina | 100 | 100 | Active | Rights acquired |
| OSIRIS (Grupo Minero Osiris) | 263-M-1944 | Minera Exar S.A. | Mina | 100 | 100 | Active | Rights acquired |
| Grupo Minero Osiris | 104- I-90 | Minera Exar S.A. | Mina | 300.29 | 300.29 | Active | Rights acquired |
| JORGE | 62-L-1998 | Minera Exar S.A. | Mina | 2352.24 | 2352.24 | Active | Rights acquired |
| LA INUNDADA (GRUPO LA INUNDADA) | 669-G-1956 | Minera Exar S.A. | Mina | 100 | 100 | Active | Rights acquired |
| Grupo Minero La Inundada | 101-C-1990 | Minera Exar S.A. | Mina | 536.37 | 536.37 | Active | Rights acquired |
| Inundada Este (Grupo Minero La Inundada) | 721-G-1957 | Minera Exar S.A. | Mina | 100 | 100 | Active | Rights acquired |
| Jujuy (Grupo Minero La Inundada) | 725-G-1957 | Minera Exar S.A. | Mina | 100 | 100 | Active | Rights acquired |
Lithium Argentina AG., 2026 Cauchari-Olaroz S-K 1300 Technical Report Cauchari-Olaroz Salars, Argentina | Page 48 of 418 |
| Table 3.1 Exar Mineral Claims | |||||||
|
Claim |
File | Owner |
Claim |
Requested |
Received | Claim Status |
Contract |
| Inundada Sur (Grupo Minero La Inundada) | 789-G-1957 | Minera Exar S.A. | Mina | 100 | 100 | Active | Rights acquired |
| Susques (Grupo Minero La Inundada) | 726-G-1957 | Minera Exar S.A. | Mina | 100 | 100 | Active | Rights acquired |
| ALEGRIA 7 | 1343-M-2009 | Minera Exar S.A. | Pedido de Mina | 1277 | 1036 | Active/Recourse to be Resolved | Area under review |
| CAUCHARI SUR | 2900-M-2022 | Minera Exar S.A. | Pedido de Mina | 1501 | 612.81 Expected | Active | Not yet granted. Mine requested over Cateo Cauchari Sur 1072-L-2008. |
| CAUCHARI OESTE I | 2941-M-2022 | Minera Exar S.A. | Cateo | 3140 | 3140 | Active | Interest |
| CAUCHARI OESTE II | 2942-M-2022 | Minera Exar S.A. | Pedido de Mina | 3133.42 | 3133.42 | Active | Interest |
| CAUCHARI OESTE III | 2943-M-2022 | Minera Exar S.A. | Pedido de Mina | 3205.23 | 3205.23 | Active | Interest |
| Grupo Minero Boroquimica | 090-B-1994 | South America Salars S.A. | Mina | 4103 | 4103 | Active | Ususfruct Rights acquired |
| JULIO A. ROCA (Grupo Minero Boroquimica) | 444-P-44 | South America Salars S.A. | Mina | 100 | 100 | Active | Ususfruct Rights acquired |
| ELENA (Grupo Minero Boroquimica) | 353-C-44 | South America Salars S.A. | Mina | 300 | 301 | Active | Ususfruct Rights acquired |
| EMMA (Grupo Minero Boroquimica) | 350-C-44 | South America Salars S.A. | Mina | 100 | 100 | Active | Ususfruct Rights acquired |
| URUGUAY (Grupo Minero Boroquimica) | 89-N-44 | South America Salars S.A. | Mina | 100 | 100 | Active | Ususfruct Rights acquired |
| AVELLANEDA (Grupo Minero Boroquimica) | 365-V-44 | South America Salars S.A. | Mina | 100 | 100 | Active | Ususfruct Rights acquired |
| BUENOS AIRES (Grupo Minero Boroquimica) | 122-D-44 | South America Salars S.A. | Mina | 100 | 100 | Active | Ususfruct Rights acquired |
Lithium Argentina AG., 2026 Cauchari-Olaroz S-K 1300 Technical Report Cauchari-Olaroz Salars, Argentina | Page 49 of 418 |
| Table 3.1 Exar Mineral Claims | |||||||
|
Claim |
File | Owner |
Claim |
Requested |
Received | Claim Status |
Contract |
| MORENO (Grupo Minero Boroquimica) | 221-S-44 | South America Salars S.A. | Mina | 100 | 100 | Active | Ususfruct Rights acquired |
| Payo III | 1517-M-2010 | Minera Exar S.A. | Mina | 2890.39 | 2890.39 | Active | Rights acquired |
| Payo IV | 1518-M-2010 | Minera Exar S.A. | Mina | 2981.17 | 2981.17 | Active | Rights acquired |
| Payo V | 1519-M-2010 | Minera Exar S.A. | Mina | 896.61 | 896.61 | Active | Rights acquired |
| Payo VI | 1520-M-2010 | Minera Exar S.A. | Mina | 2800.14 | 2800.14 | Active | Rights acquired |
| Payo VII | 1521-M-2010 | Minera Exar S.A. | Mina | 2999.52 | 2999.52 | Active | Rights acquired |
| Payo VIII | 1522-M-2010 | Minera Exar S.A. | Mina | 1337.11 | 1337.11 | Active | Rights acquired |
| Nelida | 56-C-1995 | Minera Exar S.A. | Mina | 100 | 100 | Active | Rights acquired |
| Eduardo | 183-D-1990 | Minera Exar S.A. | Mina | 100.15 | 100.15 | Active | Rights acquired |
| Maria Angela | 177-Z-1903 | Ceballos Oscar | Mina | 100 | 100 | Active | Rights acquired |
| Valentina | 2432-M-2018 | Minera Exar S.A. | Pedido de mina | 100 | - | Active | Pending concession. To be resolved by court. |
| Isabela | 2433-M-2018 | Minera Exar S.A. | Pedido de mina | 2986.25 | - | Active | Pending concession. To be resolved by court. |
| Isabela I | 2434-M-2018 | Minera Exar S.A. | Pedido de mina | 3000 | - | Active | Pending concession. To be resolved by court. |
| Cateo 2856-M-2021 | 2856-M-2021 | Minera Exar S.A. | Cateo | 2812.8 | - | Active | Pending |
| Cateo 3010-M-2022 | 3010-M-2022 | Minera Exar S.A. | Cateo | 1382.74 | - | Active | Pending |
Lithium Argentina AG., 2026 Cauchari-Olaroz S-K 1300 Technical Report Cauchari-Olaroz Salars, Argentina | Page 50 of 418 |
| 3.3 | SQM Joint Venture |
On March 28, 2016, Sociedad Quimica y Minera de Chile (“SQM”) made a US$25M capital contribution in the Company for a 50% interest in Exar, and the parties executed a Shareholders Agreement that established the terms by which the parties plan to develop Cauchari-Olaroz. Following receipt of the contribution, Exar repaid loans and advances from Lithium Argentina in the amount of US$15M. The remaining US$10M was for project development costs in the Joint Venture.
| 3.4 | Ganfeng Joint Venture |
On October 31, 2018, the Company announced the closing of a transaction with Ganfeng Lithium Group Co., Ltd. (“Ganfeng”) and SQM. Under the transaction Ganfeng Lithium agreed to purchase SQM’s interest in Cauchari-Olaroz. LAR increased its interest in the Project from 50% to 62.5% with Ganfeng holding the remaining 37.5% interest. Ganfeng also provided the Company with a US$100 million unsecured, limited recourse subordinated loan facility to fund its 62.5% share of the project expenditures.
On August 19, 2019, the Company anounced that it had closed the previously announced Project Investment in which a subsidiary of Ganfeng subscribed for newly issued shares of Exar, the holding company for the Caucharí-Olaroz lithium brine project. The parties executed an updated Shareholders Agreement that established the terms by which the parties plan to develop Cauchari.
In consideration for the newly issued shares, Exar received US$160 million in cash to continue to fund the Project’s construction activities. Upon closing, Ganfeng increased its interest in Caucharí-Olaroz from 37.5% to 50%, with Lithium Argentina holding the remaining 50% interest.
On August 27, 2020, LAR and Ganfeng closed a transaction whereby Ganfeng increased its participating interest in Exar to 51% by completion of US$16 million capital contribution in Exar. At such transaction closing, Ganfeng owned a 51% equity interest in Exar and LAR a 49%. The parties made certain consequential amendments to the shareholders agreement governing their relationship to refer to the new equity ownership structure in Exar.
| 3.4.1 | Los Boros Option Agreement |
On September 11, 2018, the Joint Venture exercised a purchase option agreement (“Option Agreement”) with Grupo Minero Los Boros, entered into on March 28, 2016, for the transfer of title to the Joint Venture for certain mining properties that comprised a portion of Cauchari-Olaroz.
Under the terms of the Option Agreement, the Joint Venture paid US$100,000 upon signing and exercised the purchase option for the total consideration of US$12,000,000 to be paid in sixty quarterly instalments of US$200,000. The first installment becomes due upon occurrence of one of the following two conditions, whichever comes first: the third anniversary of the purchase option exercise date or the beginning of commercial exploitation with a minimum production of 20,000 tonnes of lithium carbonate equivalent. As security for the transfer of title to the mining properties, Los Boros granted to the Joint Venture a mortgage over those mining properties for US$12,000,000. In accordance with the Option Agreement, on November 27, 2018, Exar paid Los Boros a US$300,000 royalty which was due within 10 days of the commercial plant construction start date.
Lithium Argentina AG., 2026 Cauchari-Olaroz S-K 1300 Technical Report Cauchari-Olaroz Salars, Argentina | Page 51 of 418 |
According to the Option Agreement, a 3% net profit interest royalty will have to be paid to Los Boros by the Joint Venture for 40 years, payable in Argentinian pesos, annually within the 10 business days after calendar year end.
The Joint Venture can cancel the first 20 years of net profit interest royalties in exchange for a one-time payment of US$7,000,000 and the next 20 years for an additional payment of US$7,000,000.
| 3.4.2 | Borax Argentina S.A. Agreement |
Under Exar’s usufruct agreement with Borax Argentina S.A. (“Borax Argentina”), on May 19th, 2011, Exar acquired its usufruct rights to Borax Argentina’s properties in the area. On execution, the agreement requires Exar to pay Borax Argentina an annual royalty of US$200,000 in May of each year.
| 3.4.3 | JEMSE Arrangement |
On August 26, 2020, Ganfeng, LAR and Exar entered into a Share Acquisition Option Execution Agreement with Jujuy Energía y Minería S.E. (“JEMSE”) a Province of Jujuy state company, setting the guidelines of JEMSE acquisition of an 8,5% participating interest in Exar, proportionally diluting Ganfeng and LAR participating interest accordingly. The JEMSE incorporation was completed in 2020. JEMSE acquired the Exar shares for a consideration of US$1 plus an amount equal to 8.5% of the capital contributions in Exar. JEMSE paid for this amount to the shareholders through the assignment of one-third of the dividends to be received by JEMSE from Exar after taxes. In accordance with the agreement, for future equity contributions Ganfeng and LAR are obliged to loan to JEMSE 8.5% of the contributions necessary for JEMSE to avoid dilution, which loans also would be repayable from the same one-third dividends assignment, after taxes.
The above-mentioned agreements with private mineral rights owners are independent of, and do not impinge upon the Provincial Government royalty of up to 2% of the value of the mineral at well head.
On April 4, 2021, JEMSE completed the exercise of its right to acquire an 8.5% equity interest in Exar. LAR now holds an approximate 44.8% interest in the Caucharí-Olaroz Project, while Ganfeng holds an approximate 46.7% interest. JEMSE will pay for the amount owed to the shareholders through the assignment of one-third of the dividends to be received by JEMSE from Exar after taxes. In accordance with the agreement, for future equity contributions GFL and the Company are obliged to loan to JEMSE 8.5% of the contributions necessary for JEMSE to avoid dilution, which loans also would be repayable from the same one-third dividends assignment, after taxes. LAR and Ganfeng are entitled to receive 100% of production output from Caucharí-Olaroz proportionate to their respective 49%/51% net interests.
A summary of royalties and payments is presented in Table 3.2.
Lithium Argentina AG., 2026 Cauchari-Olaroz S-K 1300 Technical Report Cauchari-Olaroz Salars, Argentina | Page 52 of 418 |
| Table 3.2 Annual Royalties and Payments | |
| Royalties | Value |
| Borax Argentina S.A. | US$200,000 |
| Los Boros | 3% Net Profit or US$7M payment every 20 years |
| Provincial Government of Jujuy | 2% Value of Mineral at Well Head |
| Neighboring Communities Program Payments | US$ |
| 2017-2019 Total Payment | 239,417 |
| 2020 – Onwards Annual Payments (estimated) | 552,000 |
| 3.4.4 | Corporate History of LAR |
Lithium Argentina was incorporated in British Columbia, Canada on November 27, 2007 under the name "Western Lithium Canada Corporation" and changed its name to "Western Lithium USA Corporation" on May 31, 2010. On March 21, 2016, the Company changed its name to "Lithium Americas Corp."
On October 3, 2023, the Company separated into two independent public companies, pursuant to which the Company separated its previously held North American business unit into an independent public company named “Lithium Americas Corp.”, which is listed on the TSX and NYSE, and the Company changed its name to “Lithium Americas (Argentina) Corp” and retained Cauchari-Olaroz as well as the Pastos Grandes and Sal de la Puna projects in Argentina. On January 23, 2025, the Company completed a corporate migration from British Columbia, Canada to Switzerland, establishing corporate domicile in Switzerland and changing its name from Lithium Americas (Argentina) Corp. to Lithium Argentina AG (“LAR”).
| 3.5 | Type of Mineral Tenure |
There are two types of mineral tenure in Argentina: Mining Permits and Exploration Permits (“cateos”). Mining Permits are licenses that allow the property holder to exploit the property, provided environmental approval is obtained. Exploration Permits are licenses that allow the property holder to explore the property for a period of time that is proportional to the size of the property (approximately 3 years per 10,000 ha). Exploration activity under Exploration Permits also require Environmental Permits. An Exploration Permit can be transformed into a Mining Permit any time before the expiry date of the Exploration Permit by filing a mineral discovery claim. Mining or Exploration can start only after obtaining the environmental impact assessment permit for the activity such permit is required.
Exar acquired its interests in the Cauchari and Olaroz Salars through either direct staking or exploration/usufruct of brines contracts with third party property owners (mainly Borax Argentina S.A.).
Lithium Argentina AG., 2026 Cauchari-Olaroz S-K 1300 Technical Report Cauchari-Olaroz Salars, Argentina | Page 53 of 418 |
| 3.6 | Property Boundaries |
The Exar claims follow the north-northeast trend of the Cauchari and Olaroz Salars. Figure 3.2 shows that the boundaries of the claims are irregular in shape (a reflection of the mineral claim law of the Province of Jujuy). All coordinates are recorded in the Gauss Krueger system with the WGS 84 datum. The coordinates of the boundaries of each claim are recorded in a file in the claims department of the Jujuy Provincial Ministry of Mines and are also physically staked on the ground with metallic pegs in concrete pillars. The entire area of exploitation has been surveyed and physically staked.
| 3.7 | Environmental Liabilities |
Exar has developed a plan that promotes social and economic development within a sustainable framework. Exar began work on the Communities Relations Program with the Susques Department in 2009. This plan was created to integrate local communities into the Project by implementing programs aimed at generating positive impacts on these communities.
The Communities Relations Program has been divided into several sub-programs: one dealing with external and internal communications to provide information and transparency; a second is a consultation program that allows Exar to acknowledge community perceptions of their mining activities; a third program deals with service and supply contracts to be signed with the communities. The intended outcome of the program is to deliver on social, cultural, and environmental initiatives.
Exar has signed formal contracts with neighbouring communities that own the surface rights where the Project is developed. According to these contracts, the communities agree to grant Exar traffic and other rights in exchange for cash payments to be used based on decisions made at community assemblies.
The potential impacts to local fauna due to mine development must be managed to ensure they are minimal. Vicuñas are common in the region. The vicuña was traditionally exploited by local inhabitants for its wool. Past unrestricted hunting resulted in near extinction of the vicuña, which is now protected under a 1972 international agreement signed between Argentina, Chile, Bolivia, Peru, and Ecuador. It has been observed that vicuñas are present on the Archibarca Fan, part of which would be partially affected by Project development. The impact to vicuñas can be minimized by implementing the actions provided in the Project management plan in the IIA (“Informe de Impacto Ambiental”).
With regard to potential development effects on other species in the area, such as ocultos, small lizards, and birds, a primary concern is the danger associated with accidental confinement in the large processing ponds. This potential should be minimized by methods such as: rescuing animals that may become entrapped, and relocation of animals to appropriate areas nearby.
Exar has prepared an inventory of known archaeological sites in the Department of Susques. An archeological survey of the Property identifies all findings that need to be managed in order to minimize any impact from the Project. This information is also filed with the authorities. Additional information is provided in Section 17.1.
The IIA expressly considers the closing mechanism and the post-closure monitoring of the proposed mine. The federal environmental legislation in Argentina and the provincial environmental legislation in Jujuy require a closure guarantees on which Exar has already submitted a proposal to the provincial mining authority
Lithium Argentina AG., 2026 Cauchari-Olaroz S-K 1300 Technical Report Cauchari-Olaroz Salars, Argentina | Page 54 of 418 |
| 3.8 | Permits |
The Provincial Government of Jujuy (Direccion Provincial de Mineria y Recursos Energéticos) approved the Exar Environmental Impacts Report (the “IIA”) for Cauchari-Olaroz exploration work, by Resolution No. 25/09 on August 26, 2009. Updates are required every two years to accurately reflect the ongoing exploration program. For Cauchari-Olaroz these included a 2009 update for IIA reports (“Actualización de Impacto Ambiental”) incorporating topographic and geophysical studies, opening supply wells and new exploration wells. In addition, there was an IIA for the installation of a brine enrichment pilot plant, and in 2011 the renewal of the IIA was presented for the exploration stage, specifying all activities undertaken, and planned exploration activities for the 2012-2013 period. An addendum to the IIA for Exploration was submitted in May 2014 for the installation, implementation and subsequent operation of a Posco lithium phosphate plant which was approved in July 2014 (Resolution No. 011/2014). In June 2015 and June 2016, two separate IIA exploration permit addenda were submitted for on-going exploration work (Table 3.3). These remained in the approval process and, in agreement with the authority, were replaced in the approval process by the update of the IIA for exploration submitted in February 2017, and was approved for exploration works, by Resolution No. 008/17 on September 19, 2017. The IIA was updated again in Jun 2020 and December 2021 through Resolution No. 017/2021 to reflect ongoing exploration activities. The most recent update, submitted in March 2024, is still pending. A new update is in preparation and will be presented in 2026 to cover the period 2026 – 2028. Details are presented in Table 3.3.
| Table 3.3 Exploration Permits for Cauchari-Olaroz Exploration Work | |||
| Report Submitted |
Date Presented |
Approvals | Observations |
|
Environmental Impacts Report for Exploration |
2009 | Resolution No. 25/09, August 26, 2009 | Original exploration permit for Project |
|
Environmental Impacts Report for Exploration |
2009 | Included topographic and geophysical studies, opening supply wells and new exploration wells | |
|
Environmental Impacts Report for Exploration |
September 2011 | Resolution No. 29/2012, November 08, 2012 | Approval of activities for the 2012-2013 period |
| Addendum to Environmental Impacts Report for Exploration, Posco Pilot Plant | May 2014 | Resolution No. 011/2014, July 15, 2014 | Pilot lithium phosphate plant installation approved |
|
Environmental Impacts Report for Exploration |
June 2015 | Update cancelled and filed: DMyRE Note No. 101/2019 | Operation of the pilot plant and the continuation of exploration including drilling of brine wellfield for the trial to test the hydraulic properties of the different aquifers. Drilling plan for the drilling of 49 wells was also presented including update of the 4 wells drilled up to the time of the presentation of the report. |
Lithium Argentina AG., 2026 Cauchari-Olaroz S-K 1300 Technical Report Cauchari-Olaroz Salars, Argentina | Page 55 of 418 |
| Table 3.3 Exploration Permits for Cauchari-Olaroz Exploration Work | |||
| Report Submitted |
Date Presented |
Approvals | Observations |
| Environmental Impacts Report for Exploration | June 2016 | Update cancelled and filed: DMyRE Note No. 101/2019 | Presentation of the proposed work to be carried out over the following months: Phase 1: measurement of hydrogeological variables; Phase 2: pond construction and impermeability tests; Phase 3: drilling of deep wells; Phase 4: pilot plant tests and trials. |
| Update to Environmental Impacts Report for Exploration | February 2017 | Resolution No.008/2017, September 19, 2017 |
It was agreed with the Authority that the Environmental Impacts Report for exploration (June 2016) would not be evaluated by the Authority and that this latest Environmental Impacts Report (Exploration, February 2017) would replace it.
Update of the proposed works to be carried out during next years. This consisted of seismic reflection, SEV, trenches, measurement of hydrogeological variables; pond construction, impermeability tests; drilling of deep wells; pilot plant tests, construction of embankments, auxiliary roads and drilling platforms, drilling of wells, construction of facilities and camp. It also described the exploration works that were to be developed, consisting of geochemical sampling and exploration wells. |
| Update to Environmental Impacts Report for Exploration 2019 -2021 | June 2020 | Resolution No. 017/2021, December 17, 2021 | Reflecting the ongoing exploration activities, 2019-2021. |
| Update to Environmental Impacts Report for Exploration 2021 - 2023 | December 2021 | Resolution No. 017/2021, December 17, 2021. (the previous resolution was maintained) | The authorities established that the same approving resolution be maintained in the current bi-annual renewal because the activities in this report correspond to the same ones from the previous renewal. |
Lithium Argentina AG., 2026 Cauchari-Olaroz S-K 1300 Technical Report Cauchari-Olaroz Salars, Argentina | Page 56 of 418 |
| Table 3.3 Exploration Permits for Cauchari-Olaroz Exploration Work | |||
| Report Submitted |
Date Presented |
Approvals | Observations |
| Update to Environmental Impacts Report for Exploration 2023 - 2025 | February 2026 | Resolution No. 028/2026 |
Presentation of the new activities to be carried out in the period which include the drilling of new brine wells and vertical electrical surveys focused on the southern area of the salt flat. |
An Environmental Impacts Report (“IIA”) for the exploitation phase was presented in December 2011 and approved by Resolution No. 29/2012 on 08 November 2012 based on an initial annual production of 20,000 tonnes of lithium carbonate with a second expansion phase to 40,000 tonnes/year.
A report for the update of the permit was submitted in March 2015 (AIIA Exploitation March 2015) based on the same Project description as in the initial 2011 filing. A further update was submitted in February 2017 based on updated Project parameters (AIIA Exploitation February 2017) and it was agreed with the Authority that this would replace the AIIA Exploitation March 2015 submission and was approved by Resolution No. 010/2017 on 05 October 2017.
The permit for exploitation issued in 2012 for the Project (IIA Exploitation December 2011) was still valid during this approval process, as ratified by a letter issued by the Gobierno de Jujuy (NOTA SMeH No 043/2017, issued 16 March 2017), which stated that “construction may commence on the necessary infrastructure approved in this permit, without prejudice to future adaptations and updates that the mining operator performs with respect to the mining project, which are subject to the analysis of this authority.”
A further biannual update to the Environmental Impacts Report for Exploitation (AIIA Exploitation 2019) for Cauchari-Olaroz has been submitted for evaluation by the Authority and was approved by Resolution No. 080/2020. Subsequently, three more updates were presented, in 2021, 2023 and 2025. The 2021 update was approved by Resolution No. 103/2025 and the last two updates are still under evaluation.
Exploitation permits and reports submitted are summarized in Table 3.4.
The IIA expressly considers the closing mechanism and the post-closure monitoring of the proposed mine. The federal environmental legislation in Argentina and the provincial environmental legislation in Jujuy require a closure guarantee and as a result, Exar has already submitted a proposal to the provincial mining authority. The cash flow model includes estimated closure and remediation cost of US$86.4 million at the end of the mine life for Exar’s environmental and closure obligations in order to comply with the considerations in the IIA and the legislation.
Exar has paid the water tariff since the granting of the water concession permit (160 L/s) was approved in 2018.
Lithium Argentina AG., 2026 Cauchari-Olaroz S-K 1300 Technical Report Cauchari-Olaroz Salars, Argentina | Page 57 of 418 |
| Table 3.4 Exploitation Permits for Cauchari-Olaroz | |||
| Report Submitted | Date Presented |
Approvals | Observations |
| Environmental Impacts Report for Exploitation (IIA Exploitation December 2011) |
December 2011 | Resolution No. 29/2012, November 08, 2012 | Production of 20,000 tonnes/year of lithium carbonate with a second expansion phase to 40,000 tonnes/year |
| Biannual Environmental Impacts Report for Exploitation (AIIA Exploitation March 2015) |
March 2015 | Update cancelled and filed: DMyRE Note No. 101/2019 | Biannual update of the Environmental Impacts Report (AIIA) approved in 2012, based on the same project approved in 2012 |
| Biannual Environmental Impacts Report (Exploitation) (AIIA Exploitation February 2017) |
February 2017 | Resolution No. 010/2017, October 05, 2017 | It was agreed with the Authority that the Environmental Impacts Report for exploitation (AIIA March 2015) would not be evaluated by the Authority and that this document (AIIA Exploitation, February 2017) would replace it.
Production of 25,000 tonnes/year of lithium carbonate with a second expansion phase to 40,000 tonnes/year |
| Biannual Environmental Impacts Report (Exploitation) (AIIA Exploitation 2019) |
September 2019 | Resolution No. 080/2020, December 18,2020. | Detailed ongoing exploitation activities. |
| Biannual Environmental Impacts Report (Exploitation) (AIIA Exploitation 2021) |
March, 2022 | Resolution No. 103/2020, April 08,2020. | Initially included modifications for an expansion in production. This expansion request was subsequently retracted by the company, leaving the AIIA Exploitation 2021 activities as per AIIA Exploitation 2019. |
| Biannual Environmental Impacts Report (Exploitation) (AIIA Exploitation 2023) |
December, 2023 | Pending | The AIIA 2023 was presented to respect the bi-annual submission requirement, although the authority had not issued a permit for the previous (AIIA Exploitation 2021) report. Changes were added that are intended to be made with respect to ponds and harvest salts.
Update submitted under Decree No. 7751-DEyP-2023 |
Lithium Argentina AG., 2026 Cauchari-Olaroz S-K 1300 Technical Report Cauchari-Olaroz Salars, Argentina | Page 58 of 418 |
| Table 3.4 Exploitation Permits for Cauchari-Olaroz | |||
| Report Submitted | Date Presented |
Approvals | Observations |
| Biannual Environmental Impacts Report (Exploitation) (AIIA Exploitation 2025) |
December, 2025 | Pending | The AIIA 2025 was presented to respect the bi-annuity although the authority is not issued with the previous report. The changes remain in place with respect to ponds and harvest salts |
| Environmental impact report for expansion to 85.000 tonnes/year. | December, 2025 | Pending | Environmental impact report presented for new expansion plant with DLE technology presented |
| 3.9 | Neighbouring Communities |
The surface rights of the area subject to exploitation are owned by the local neighboring communities of Pastos Chicos (10-23-2011), Olaroz Chico (12-20-2011), Huancar (12-20-2011), Puesto Sey (12-14-2011), and a part of El Toro (as an easement for the water and gas pipelines), some locations are shown in Figure 4.1. Ownership of the ground that is not currently proposed for exploitation also includes Portico de los Andes and Catua (2-23-2012).
Exar has completed contracts with each local community to have the right to develop the mine and use local water resources and transit. The arrangements vary between communities, but they all include the following (see Section 17.5.4 Community Relations Program):
| · | Aggregate payments of approximately US$239,417 per year between 2017-2019; |
| · | Aggregate payments of approximately US$552,000 per year in 2020 and after; |
| · | Joint environmental monitoring programs; |
| · | Priority rights for any job for which a person from the community is qualified; |
| · | Training on site to qualify for employment; |
| · | A school of business training in each community to assist in setting up businesses for the provision of services during construction; and |
| · | Individual infrastructure programs in each community. |
Lithium Argentina AG., 2026 Cauchari-Olaroz S-K 1300 Technical Report Cauchari-Olaroz Salars, Argentina | Page 59 of 418 |
| 4.0 | Accessibility, Climate, Local Resources, Infrastructure, and Physiography |
| 4.1 | Topography |
The Cauchari and Olaroz Salars are bounded on the east and west by mountains that range in elevation from 4,600 m to 4,900 m (Figure 4.1). The Cauchari Salar forms an elongated northeast-southwest trending depression extending 55 km in a north-south direction and approximately 6 km to 10 km in an east-west direction. The Olaroz Salar extends 40 km north-south and 10 km to 15 km east-west. The elevation of the floor of the salars ranges from 3,910 m to 3,950 m. There is negligible vegetation on the surface of the salars.
| 4.2 | Access |
The main access to the Olaroz and Cauchari Salars from San Salvador de Jujuy is via paved National Highways 9 and 52, as shown in Figure 4.1. The midpoint between the two salars is located along National Highway 52 (Marker KM 192). Paso Jama, a national border crossing between Chile and Argentina (also on National Highway 52) is 100 km west of the Project. These highways carry significant truck traffic, transporting borate products to market from various salars in northern Argentina. Access to the interior of the Olaroz and Cauchari Salars is possible through a gravel road, Highway 70, which skirts the west side of the salars.
| 4.3 | Population |
The Town of Susques, (population of 1,374 according to a 2022 census), 45 km east of the Olaroz Salar, is the nearest population center Figure 4.1). Further east lies the provincial capital of San Salvador de Jujuy (population of 308,950 according to a 2022 census) and the settlement of Catua (population of 442 according to a 2022 census) to the southwest. LAR utilizes local employees for approximately 74% of the Project workforce (from Salta and Jujuy), of which 24% are from the local communities. The company transports them to and from the site by bus.
Lithium Argentina AG., 2026 Cauchari-Olaroz S-K 1300 Technical Report Cauchari-Olaroz Salars, Argentina | Page 60 of 418 |
Figure 4.1 Regional Topography and Population Centers Near Cauchari-Olaroz
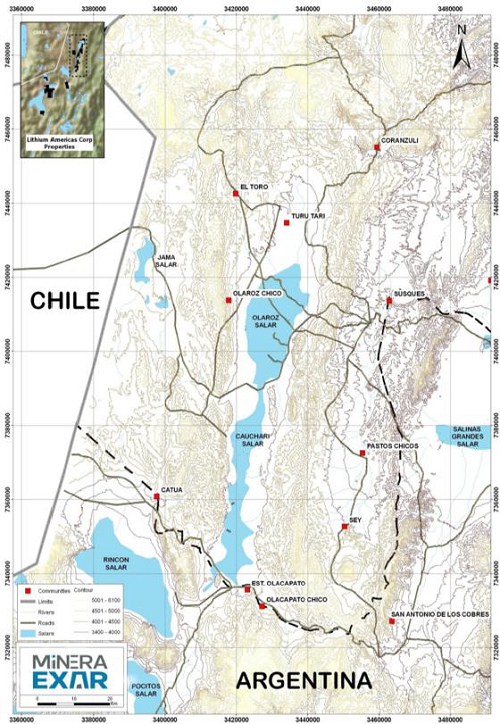
Source: Burga et al. (2019)
Lithium Argentina AG., 2026 Cauchari-Olaroz S-K 1300 Technical Report Cauchari-Olaroz Salars, Argentina | Page 61 of 418 |
| 4.4 | Climate |
The region's climate is classified as Andean continental. reaching desert-like conditions (Etcheverría M. P., 2003).
The area is a high mountain zone, with its own distinct local variations, and is generally called Puna, referring to a markedly dry climate with intense solar radiation. where cloud cover is mainly nonexistent, with scarce rainfall, strong and frequent winds, and a high daily temperature range. typical of the local geography, with minimum temperatures that can reach -10°C at night and maximum temperatures of up to 30°C during the day (Bianchi, 1996).
According to the climate classification proposed by Köppen (1900), the climate of the study area is Bwk (arid and cold), characterized by low annual rainfall and an average annual temperature below 18°C.
The Puna region is characterized by marked aridity and low relative humidity, with an average annual temperature of 7 °C (Bianchi, 1996). It experiences harsh winters where temperatures can drop to -30 °C, and strong daily temperature ranges that can reach up to 50 °C between day and night. Dry, intense winds, high levels of sunshine, and intense solar radiation are also present due to the lack of clouds and the altitude. Rainfall is scarce in the summer, while heavy snowfall occurs during the winter (although this varies during El Niño/La Niña years). These factors, along with others, make it an inhospitable region with a harsh climate (Alonso, 2006; Strecker et al., 2007; Alonso. 2017).
Summer rainfall in the region is infrequent, typically not exceeding 100 mm annually, and usually occurs during a short period of the year, Snowfall is common from June to August, while hailstorms occur more frequently in April-May and September-October.
For the climatic characterization of the study area, records from local meteorological stations located within Cauchari-Olaroz were used (Table 4.1). The recorded parameters include precipitation, evaporation, temperature, relative humidity, atmospheric pressure, winds, and solar radiation.
| Table 4.1 Location Coordinates of the Meteorological Stations of Cauchari-Olaroz | |||
| Weather Station | Gauss-Krüger Coordinates - Zone 3 | Registration Period | |
| East | North | ||
| Davis | 3,424,003 | 7383,197 | 2023 - 2025 |
| Campbell North | 3,428,577 | 7,449,506 | 2024 - 2025 |
Source: Exar Mining Company
The Figure 4.2 shows the location map of the local weather stations.
Lithium Argentina AG., 2026 Cauchari-Olaroz S-K 1300 Technical Report Cauchari-Olaroz Salars, Argentina | Page 62 of 418 |
Figure 4.2 Location of Local Meteorological Stations
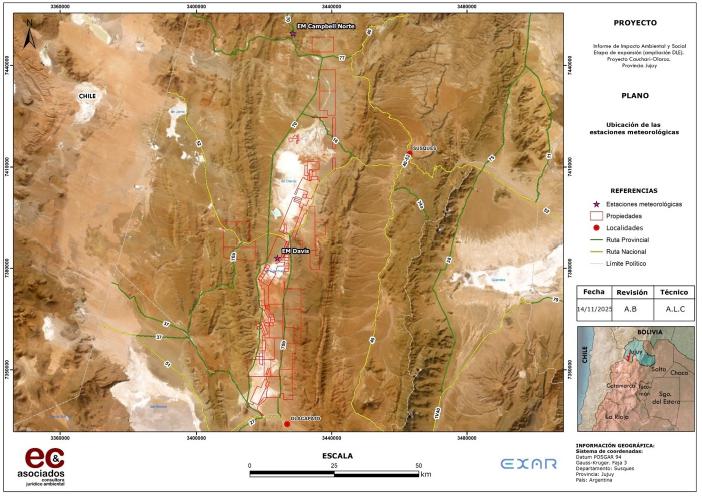
Source: Exar
| 4.5 | Precipitation |
According to existing records, precipitation is scarce and irregularly distributed throughout the year, under a monsoon-type regime, concentrated between the summer months (January to March), with an average annual rainfall of 133 mm for the Davis Pumping Station located in Cauchari-Olaroz's operational area; and 122 mm for the Campbell Norte Pumping Station, located towards the northern end of the Cauchari-Olaroz basin, near the community of El Toro.
The highest rainfall totals were recorded in March, making it the wettest month, with average monthly values of 54 mm at the Davis Pumping Station during the period 2023-2025, representing 40.6% of the average annual rainfall and 50 mm at the Campbell North weather station for the month of February, according to available records (2024-2025), representing 41% of the annual rainfall, with over 90% of the annual precipitation concentrated in the warmer months.
During the dry season, from May to October, rainfall is generally scarce to nonexistent.
Figure 4.3 shows the average monthly rainfall for the weather stations considered.
Lithium Argentina AG., 2026 Cauchari-Olaroz S-K 1300 Technical Report Cauchari-Olaroz Salars, Argentina | Page 63 of 418 |
Figure 4.3 Record of Average Monthly Rainfall for the Study Area
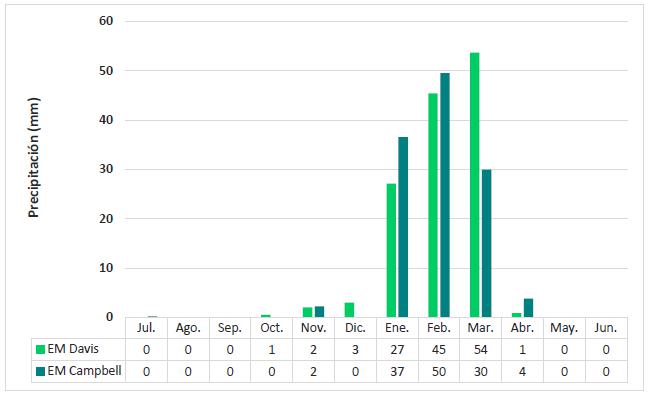
The Puna region is exposed to substantial warming due to the enormous amount of radiation it receives and the limited availability of moisture to utilize this energy in atmospheric transformation processes. These extreme conditions favor evaporative processes, especially since rainfall is typically less than 100 mm per year.
A particular characteristic of the Puna region is that the scant rainfall during the summer does not contribute to surface runoff or soil recharge, as it is only sufficient to meet evapotranspiration demands, resulting in a deficit in many areas, even during the months with the highest rainfall. The accumulated monthly evaporation records for Cauchari-Olaroz area are presented in the Figure 4.4.
Lithium Argentina AG., 2026 Cauchari-Olaroz S-K 1300 Technical Report Cauchari-Olaroz Salars, Argentina | Page 64 of 418 |
Figure 4.4 Monthly Evapotranspiration
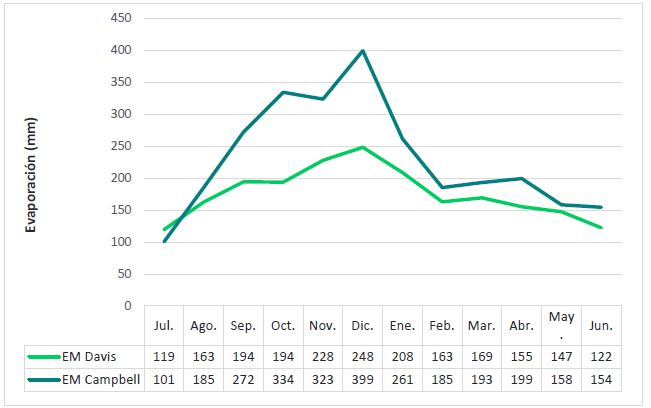
Clarification: In July 2025, there was an error in the evaporator (water loss) at the Campbell weather station, which is why it is the only month in which the evapotranspiration record was lower than that obtained at the Davis weather station.
The recorded periods have precipitation lower than the potential evapotranspiration, meaning that precipitation does not satisfy the monthly evapotranspiration demand (EP) at any point during the year. This indicates that not enough water is stored in the soil to cover its entire water demand, and all precipitation is consumed in the actual evapotranspiration (ER) process.
The characteristics of the thermal regime determine the necessary conditions for evapotranspiration values to be high enough to offset the volumes of precipitated water.
| 4.6 | Temperature |
Temperatures are harsh, even during the summer season, due to the altitude and atmospheric dryness, where cloud cover is low, resulting in high sunshine and a significant daily temperature range.
According to available records, the average annual temperature for the study area varies from 6.2°C (Campbell Norte Station) to 8°C (Davis Station), with minimum monthly temperatures dropping to between -15°C and -20°C during the winter, while maximum monthly temperatures in summer reach between 25°C and 30°C.
The average monthly maximum temperature for the Campbell North Station is recorded in February with a value of 10.1°C, and the average monthly minimum is 2.3°C in July. For the Davis Station, the average monthly maximum is 12.9°C in December, and the average monthly minimum is 1.7°C in July. The highest temperatures are recorded during the summer period, coinciding with the months of greatest rainfall.
Lithium Argentina AG., 2026 Cauchari-Olaroz S-K 1300 Technical Report Cauchari-Olaroz Salars, Argentina | Page 65 of 418 |
Figure 4.5 and Figure 4.6 show the variation in average monthly temperature for the analyzed period, exhibiting a marked seasonality.
Figure 4.5 Record of Average Monthly Temperatures - Davis Station
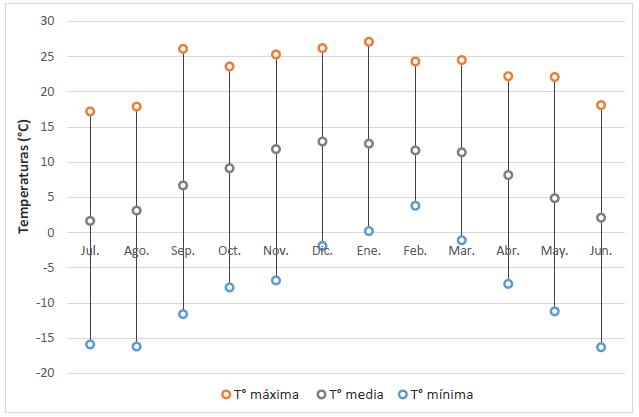
Figure 4.6 Record of Average Monthly Temperatures - Campbell North Station
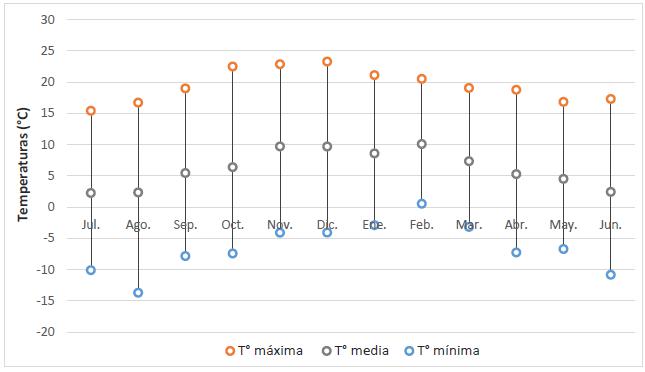
Lithium Argentina AG., 2026 Cauchari-Olaroz S-K 1300 Technical Report Cauchari-Olaroz Salars, Argentina | Page 66 of 418 |
Regarding extreme temperatures (average and absolute), these are described based on the available records for the measurement period considered.
The highest absolute temperature recorded for Cauchari-Olaroz (Davis Station) operations area was 27.1°C in January 2024, while the lowest absolute temperature was -16.3°C in June 2023. The average annual temperatures range from 6 to 9°C (Figure 4.7).
Figure 4.7 Annual Maximum and Minimum Temperatures - Davis Weather Station
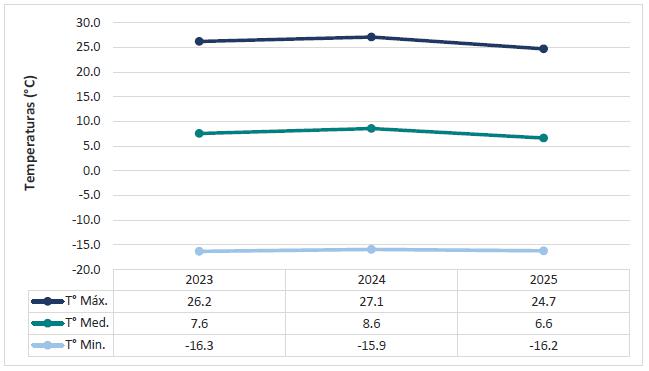
Towards the northern end of the Cauchari-Olaroz basin, near the community of El Toro, the Campbell Norte weather station recorded an absolute maximum temperature of 23.3°C in December 2024 and an absolute minimum temperature of -13.7°C in August 2025. The average annual temperatures range from 5 to 6°C (Figure 4.8).
Lithium Argentina AG., 2026 Cauchari-Olaroz S-K 1300 Technical Report Cauchari-Olaroz Salars, Argentina | Page 67 of 418 |
Figure 4.8 Annual Maximum and Minimum Temperatures - Campbell North Weather Station
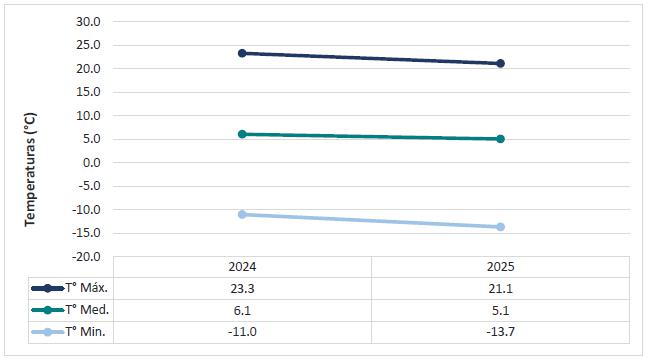
| 4.7 | Relative Humidity |
The air masses that reach the region generally have a relatively low moisture content, due to a combination of atmospheric flow patterns, the region's topographic characteristics, and high altitude. Furthermore, the prevailing cold environment, due to the altitude, results in a lower capacity to retain water vapor. Sunshine duration and air dryness are high, with 85% of possible sunshine hours during the winter months, and the maximum relative humidity occurs during the summer, which coincides with the rainy season.
In the study area, according to data from the meteorological stations considered, relative humidity is very low, averaging around 21% (EM Campbell Norte) and 25% (EM Davis). The average monthly relative humidity is highest in February, reaching values of 50%, and lowest during the spring period (September to October), with values between 10% and 20%.
Figure 4.9 presents the average monthly relative humidity values recorded for Cauchari-Olaroz area, according to local meteorological stations.
Lithium Argentina AG., 2026 Cauchari-Olaroz S-K 1300 Technical Report Cauchari-Olaroz Salars, Argentina | Page 68 of 418 |
Figure 4.9 Average Monthly Relative Humidity for the Study Area
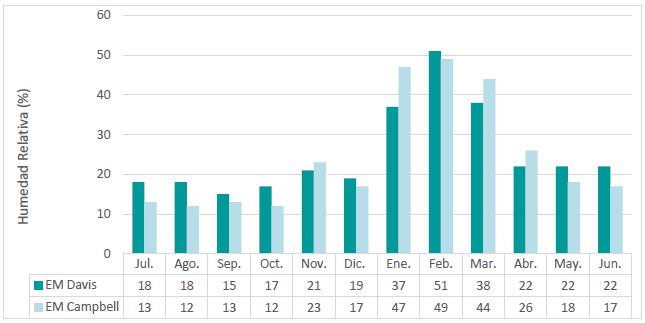
| 4.8 | Atmospheric Pressure |
Atmospheric pressure at the surface of the Altiplano is approximately 40% lower than the corresponding value at sea level. The thinner atmospheric column explains why atmospheric pressure variability is relatively small across all time scales. Furthermore, considering altitude, pressure decreases with elevation because the atmospheric layer exerting its weight on the surface diminishes.
In the study area, the average annual atmospheric pressure was recorded at between 637 hPa (Davis Station) and 617 hPa (Campbell North Station). Figure 4.10 presents the average monthly data from local meteorological stations.
Figure 4.10 Average Monthly Atmospheric Pressure for the Study Area
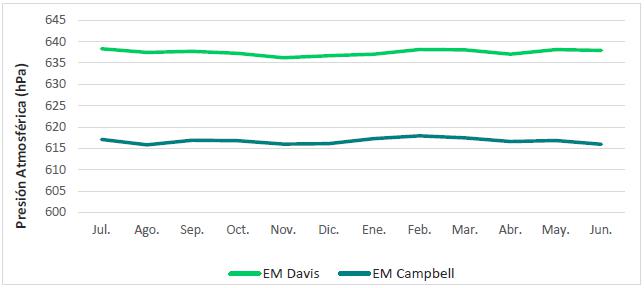
Lithium Argentina AG., 2026 Cauchari-Olaroz S-K 1300 Technical Report Cauchari-Olaroz Salars, Argentina | Page 69 of 418 |
| 4.9 | Winds |
The wind regime in the Puna is subject to significant local variations, as circulation is strongly controlled by topography. The air rising over the Puna surface must be counterbalanced by air from the lower-lying neighboring areas. Local wind systems are strong during the day, particularly up the valleys descending from the Puna.
Wind direction depends directly on the pressure distribution, as it tends to blow from high-pressure areas towards lower-pressure areas. Winter winds come from the south and west, while summer winds come from the north and northeast, with the latter reaching the greatest intensities. These winds sometimes lift sand and snow, creating whiteout conditions (Nadir and Chafatinos, 1990).
Due to its particular climatic conditions (high aridity, sunshine, and a wide temperature range), physical weathering phenomena dominate, with wind being the main agent of erosion, transport, and accumulation. Strong westerly winds give rise to sandstorms and dust clouds that reach heights of 7,000 m and extend beyond the high peaks of the Eastern Cordillera (Alonso, 2008).
It is estimated that the wind in the region reaches its greatest intensity during spring, with the lowest readings occurring in mid-autumn. Winds generally occur between midday and the early afternoon, are extremely dry, and are accompanied by temperatures ranging from 5° to 20° C. To characterize the winds in the study area, the free software WRPLOT View was used, utilizing wind direction and speed records provided by reference meteorological stations.
Table 4.2 presents the frequency distributions of winds according to direction and average speed, based on the Davis Station data.
| Table 4.2 Distribution of Wind Frequencies by Direction and Speed from 2023 to 2025 - Davis Weather Station | ||||||||
| Wind Direction | Wind Speed Classes (km/h) | |||||||
| 2 - 8 | 8 - 13 | 13 - 21 | 21 - 32 | 32 - 40 | >= 40 | Total (%) | ||
| 1 | N | 2.663 | 2.150 | 0.750 | 0.101 | 0.007 | 0.000 | 5.67 |
| 2 | NNE | 1.866 | 2.055 | 0.656 | 0.115 | 0.020 | 0.000 | 4.71 |
| 3 | NE | 1.487 | 1.196 | 0.534 | 0.128 | 0.014 | 0.000 | 3.36 |
| 4 | ENE | 0.933 | 0.534 | 0.318 | 0.047 | 0.000 | 0.000 | 1.83 |
| 5 | E | 0.831 | 0.345 | 0.338 | 0.115 | 0.000 | 0.000 | 1.63 |
| 6 | ESE | 0.561 | 0.230 | 0.412 | 0.101 | 0.000 | 0.000 | 1.30 |
| 7 | SE | 0.973 | 0.541 | 0.297 | 0.068 | 0.000 | 0.000 | 1.88 |
| 8 | SSE | 1.399 | 0.588 | 0.101 | 0.007 | 0.000 | 0.000 | 2.10 |
| 9 | S | 2.636 | 1.257 | 0.406 | 0.122 | 0.088 | 0.041 | 4.55 |
| 10 | SSW | 2.704 | 0.723 | 0.581 | 0.169 | 0.000 | 0.000 | 4.18 |
| 11 | SW | 3.501 | 0.662 | 0.615 | 0.392 | 0.014 | 0.000 | 5.18 |
| 12 | WSW | 2.089 | 0.629 | 0.926 | 1.203 | 0.135 | 0.000 | 4.98 |
| 13 | W | 1.697 | 1.190 | 2.501 | 3.326 | 0.804 | 0.318 | 9.84 |
| 14 | WNW | 1.730 | 2.156 | 5.678 | 6.814 | 2.839 | 1.041 | 20.26 |
Lithium Argentina AG., 2026 Cauchari-Olaroz S-K 1300 Technical Report Cauchari-Olaroz Salars, Argentina | Page 70 of 418 |
| Table 4.2 Distribution of Wind Frequencies by Direction and Speed from 2023 to 2025 - Davis Weather Station | ||||||||
| Wind Direction | Wind Speed Classes (km/h) | |||||||
| 2 - 8 | 8 - 13 | 13 - 21 | 21 - 32 | 32 - 40 | >= 40 | Total (%) | ||
| 15 | NW | 2.048 | 2.170 | 4.434 | 2.880 | 1.264 | 0.379 | 13.17 |
| 16 | NNW | 2.048 | 1.845 | 1.440 | 0.372 | 0.176 | 0.068 | 5.95 |
| Sub-Total | 29.17 | 18.27 | 19.99 | 15.96 | 5.36 | 1.85 | 90.59 | |
| Calm | 9.41 | |||||||
| Total | 100 | |||||||
As a result, wind speed ranges were defined, and 16 wind direction classes were obtained (N, NNE, NE, ENE, E, ESE, SE, SSE, S, SSW, SW, WSW, W, WNW, NW, NNW). Each speed frequency value, in each direction, was converted into percentages for easier reading and interpretation.
According to records from the Davis weather station, during the period 2023–2025, the prevailing winds originated from the west quadrant, from WNW (20.26%), NW (13.17%), and W (9.84%) directions, with maximum average speeds (gusts) reaching 50 km/h (Figure 4.11). Among the average speed ranges, the highest percentages (29.17% and 19.99%) corresponded to light to breezy winds, and ranging from 2 to 8 km/h and 13 to 21 km/h, respectively. Strong to very strong winds, with high intensities exceeding 40 km/h, originated from the west (1.80%). Calm winds accounted for 9.41%, with speeds below 2 km/h.
Lithium Argentina AG., 2026 Cauchari-Olaroz S-K 1300 Technical Report Cauchari-Olaroz Salars, Argentina | Page 71 of 418 |
Figure 4.11 Wind Rose Plot – Davis Weather Station
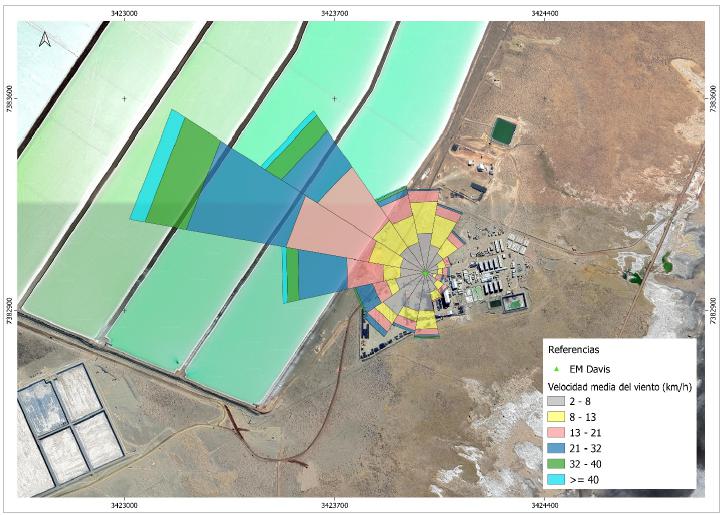
Data available for the Davis Weather Station indicates that the average wind speed ranges from 11 to 14 km/h, with a maximum recorded speed of 98.2 km/h in November 2023. Figure 4.12 shows the average and maximum wind speeds recorded during the period 2023–2025.
Lithium Argentina AG., 2026 Cauchari-Olaroz S-K 1300 Technical Report Cauchari-Olaroz Salars, Argentina | Page 72 of 418 |
Figure 4.12 Wind Speeds (km/h) 2023–2025 - Davis Weather Station
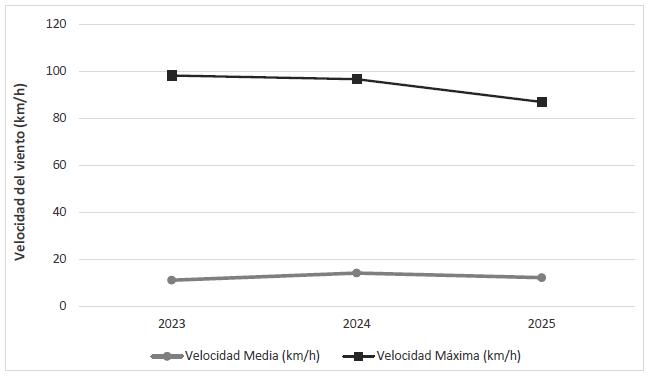
Regarding seasonality, although winds occur throughout the year, the highest average wind speeds are recorded between August and October, with an average annual speed of 12.24 km/h (Table 4.3).
| Table 4.3 Average Monthly and Average Annual Wind Speed (km/h) from 2023 to 2025 - Davis Weather Station | ||||||||||||
| Jan. | Feb. | Mar. | Apr. | May. | Jun. | Jul. | Aug. | Sep. | Oct. | Nov. | Dec. | Yearly Avg. |
| 11.24 | 9.30 | 11.42 | 12.08 | 12.60 | 12.56 | 11.30 | 15.21 | 14.16 | 12.22 | 11.98 | 12.75 | 12.24 |
Figure 4.13 shows the average monthly speeds for the Davis weather station.
Lithium Argentina AG., 2026 Cauchari-Olaroz S-K 1300 Technical Report Cauchari-Olaroz Salars, Argentina | Page 73 of 418 |
Figure 4.13 Average Wind Speed Records (km/h) – Davis Weather Station
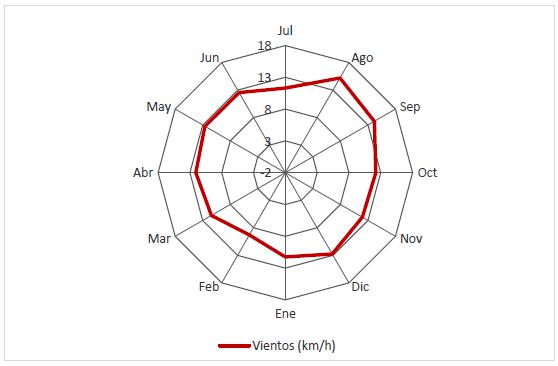
For Campbell North Weather Station, the distribution of wind frequencies according to their direction and average speed for the period 2024-2025 is presented in Table 4.4.
| Table 4.4 Distribution of Wind Frequencies by Direction and Speed from 2024 to 2025 - Campbell North Weather Station | |||||||||
| Wind Direction | Wind Speed Classes (km/h) | ||||||||
| 2 - 8 | 8 - 13 | 13 - 21 | 21 - 32 | 32 - 40 | 40 - 50 | >= 50 | Total (%) | ||
| 1 | N | 2.376 | 3.491 | 2.067 | 0.618 | 0.000 | 0.000 | 0.000 | 8.55 |
| 2 | NNE | 1.033 | 0.911 | 0.985 | 0.317 | 0.024 | 0.000 | 0.000 | 3.27 |
| 3 | NE | 0.618 | 0.391 | 0.236 | 0.114 | 0.024 | 0.000 | 0.000 | 1.38 |
| 4 | ENE | 0.472 | 0.236 | 0.163 | 0.106 | 0.106 | 0.041 | 0.073 | 1.20 |
| 5 | E | 0.358 | 0.415 | 0.285 | 0.285 | 0.228 | 0.456 | 0.212 | 2.24 |
| 6 | ESE | 0.293 | 0.472 | 0.244 | 0.358 | 0.285 | 0.358 | 0.179 | 2.19 |
| 7 | SE | 0.415 | 0.822 | 0.236 | 0.269 | 0.334 | 0.439 | 0.057 | 2.57 |
| 8 | SSE | 0.667 | 1.115 | 0.285 | 0.456 | 0.431 | 0.244 | 0.057 | 3.25 |
| 9 | S | 0.578 | 0.993 | 0.643 | 0.618 | 0.342 | 0.325 | 0.065 | 3.56 |
| 10 | SSW | 0.692 | 0.846 | 0.700 | 0.578 | 0.594 | 0.317 | 0.098 | 3.82 |
| 11 | SW | 0.643 | 0.578 | 1.033 | 1.367 | 0.871 | 0.659 | 0.163 | 5.31 |
| 12 | WSW | 0.553 | 0.700 | 1.237 | 2.091 | 1.993 | 1.261 | 0.244 | 8.08 |
| 13 | W | 0.545 | 0.667 | 1.017 | 1.505 | 0.944 | 0.838 | 0.122 | 5.64 |
| 14 | WNW | 0.651 | 0.724 | 0.976 | 0.830 | 0.570 | 0.448 | 0.057 | 4.25 |
| 15 | NW | 1.033 | 1.131 | 1.058 | 0.667 | 0.325 | 0.057 | 0.000 | 4.27 |
| 16 | NNW | 2.970 | 4.849 | 1.912 | 0.448 | 0.024 | 0.000 | 0.000 | 10.20 |
Lithium Argentina AG., 2026 Cauchari-Olaroz S-K 1300 Technical Report Cauchari-Olaroz Salars, Argentina | Page 74 of 418 |
| Table 4.4 Distribution of Wind Frequencies by Direction and Speed from 2024 to 2025 - Campbell North Weather Station | |||||||||
| Wind Direction | Wind Speed Classes (km/h) | ||||||||
| 2 - 8 | 8 - 13 | 13 - 21 | 21 - 32 | 32 - 40 | 40 - 50 | >= 50 | Total (%) | ||
| Sub-Total | 13.90 | 18.34 | 13.07 | 10.62 | 7.09 | 5.44 | 1.33 | 69.79 | |
| Calm | 30.21 | ||||||||
| Total | 100 | ||||||||
According to records from the Campbell North weather station, during the period 2024–2025, the prevailing winds originated from the north quadrant, blowing north (8.55%), and from the west quadrant, blowing north-northwest (10.20%) and west-southwest (8.08%), with maximum average speeds (gusts) reaching 80 km/h. Among the average speed ranges, the largest percentage (18.34%) consisted of light winds, ranging from 8 to 13 km/h. Strong to very strong winds, with high intensities exceeding 40 km/h, originated from the south quadrant (4.47%). Calm winds accounted for 30.21% of the time, with speeds below 2 km/h (Figure 4.14).
Figure 4.14 Wind Rose Plot - Campbell North Weather Station
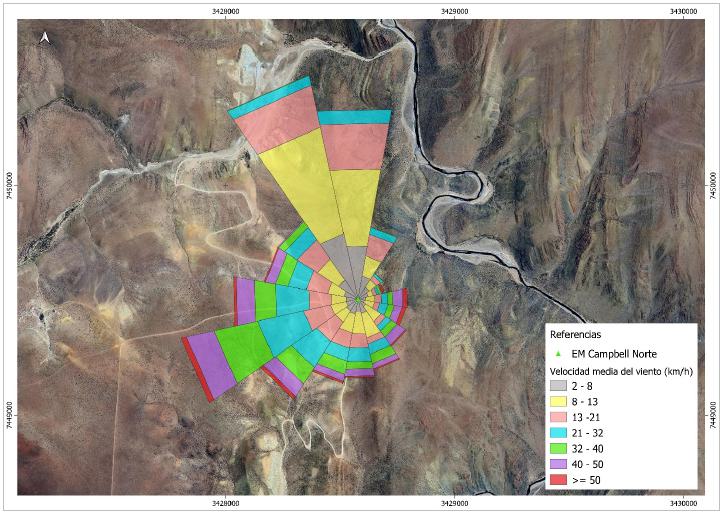
Lithium Argentina AG., 2026 Cauchari-Olaroz S-K 1300 Technical Report Cauchari-Olaroz Salars, Argentina | Page 75 of 418 |
Furthermore, it was found that the average wind speed ranged from 8 to 18 km/h and the maximum speed recorded was 118.9 km/h, in the month of August 2025. The Figure 4.15 shows the average and maximum values ecorded in the period 2024 - 2025.
Figure 4.15 Wind Speeds (km/h) Period 2024 to 2025 - Campbell North Weather Station
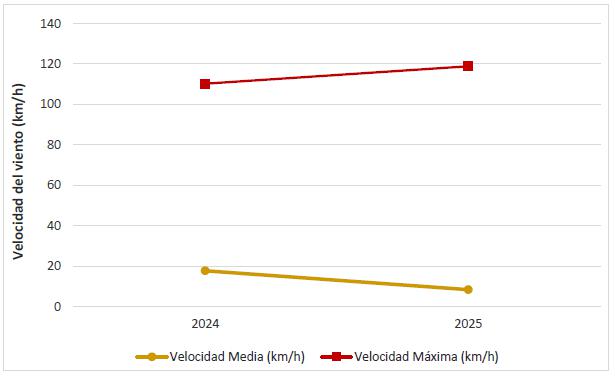
Regarding seasonality, the highest average wind speeds are recorded between August and September, with an average annual speed of 10.7 km/h (Table 4.5).
| Table 4.5 Average Monthly and Average Annual Wind Speed (km/h) Period 2024 to 2025, EM Campbell Norte | ||||||||||||
| Jan. | Feb. | Mar. | Apr. | May. | Jun. | Jul. | Aug. | Sep. | Oct. | Nov. | Dec. | Yearly Avg. |
| 8.34 | 1.54 | 0.23 | 0.96 | 0.81 | 11.32 | 18.28 | 22.18 | 19.71 | 16.82 | 10.92 | 17.27 | 10.70 |
Figure 4.16 shows the average monthly speeds for the local weather station.
Lithium Argentina AG., 2026 Cauchari-Olaroz S-K 1300 Technical Report Cauchari-Olaroz Salars, Argentina | Page 76 of 418 |
Figure 4.16 Average Wind Speed Records (km/h) - Campbell North Weather Station
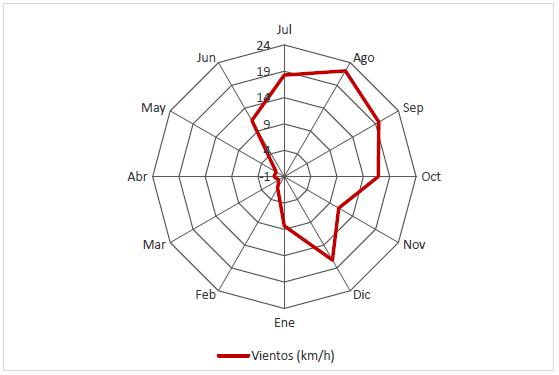
Clarification: The lack of data observed in the month of February is due to a failure in the anemometer.
| 4.10 | Solar Radiation |
The integrated monthly solar irradiance is presented in Figure 4.17. Figure 4.18 shows the average annual daily irradiance values, which correspond to the average daily solar irradiance value during the analyzed period (2023-2025) at the Davis Station.
Figure 4.17 Monthly Solar Irradiance (MJ/m²) for the Study Area
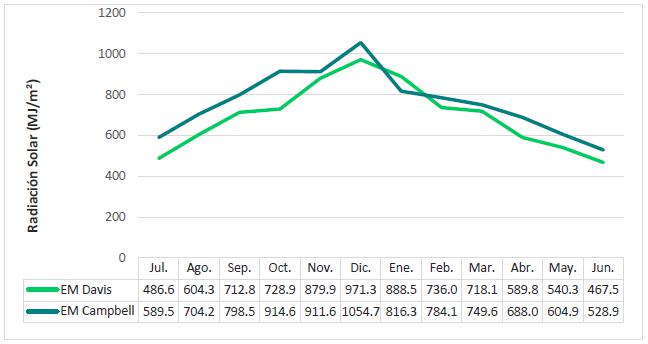
Lithium Argentina AG., 2026 Cauchari-Olaroz S-K 1300 Technical Report Cauchari-Olaroz Salars, Argentina | Page 77 of 418 |
Figure 4.18 Average Annual Daily Solar Irradiance (W/m2) - 2023 – 2025 – Davis Weather Station
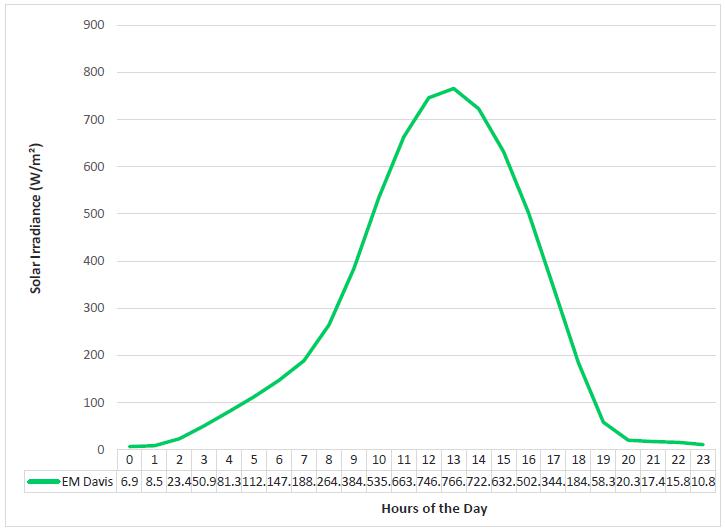
It is observed that the highest solar radiation values are recorded during midday and the early afternoon, around 4:00 PM, ranging between 500 and 700 W/m².
During 2024, a maximum solar radiation value of 1552 W/m² was recorded in February, coinciding with the warm season, at the Davis Station, located in Cauchari-Olaroz's operational area. The absolute maximum solar radiation values recorded are shown in Figure 4.19.
Lithium Argentina AG., 2026 Cauchari-Olaroz S-K 1300 Technical Report Cauchari-Olaroz Salars, Argentina | Page 78 of 418 |
Figure 4.19 Maximum Solar Radiation Recorded (W/m2) - Period 2023 – 2025 – Davis Weather Station
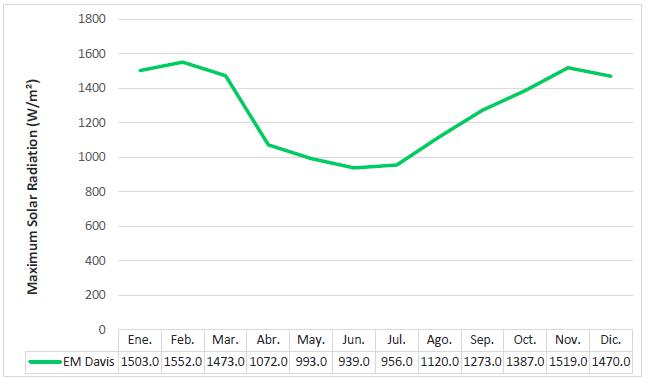
Figure 4.20 shows the average annual daily irradiance values, which correspond to the average daily solar irradiance value during the analyzed period (2024-2025) at the Campbell North Weather Station.
It can be observed that the highest solar radiation values are recorded during the midday hours and early afternoon, around 4:00 PM, ranging between 700 and 900 W/m².
Lithium Argentina AG., 2026 Cauchari-Olaroz S-K 1300 Technical Report Cauchari-Olaroz Salars, Argentina | Page 79 of 418 |
Figure 4.20 Average Annual Daily Solar Irradiance (W/m2) - Period 2024 to 2025 - Campbell North Weather Station
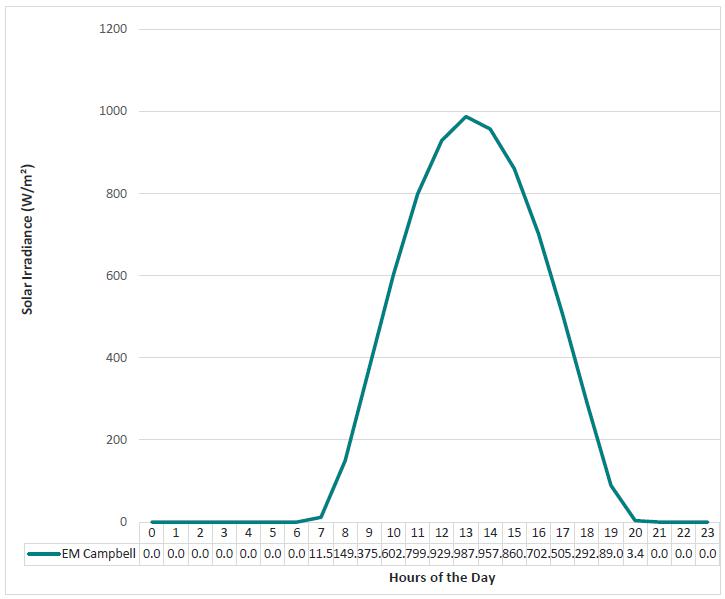
During 2025, a maximum solar radiation value of 1760 W/m² was recorded in January, coinciding with the warm season, at the Campbell Norte Monitoring Station, located in the northernmost part of the Cauchari-Olaroz basin. Figure 4.21 shows the absolute maximum solar radiation values recorded.
Lithium Argentina AG., 2026 Cauchari-Olaroz S-K 1300 Technical Report Cauchari-Olaroz Salars, Argentina | Page 80 of 418 |
Figure 4.21 Maximum Solar Radiation Recorded (W/m²) – 2024 to 2025 - Campbell North Weather Station
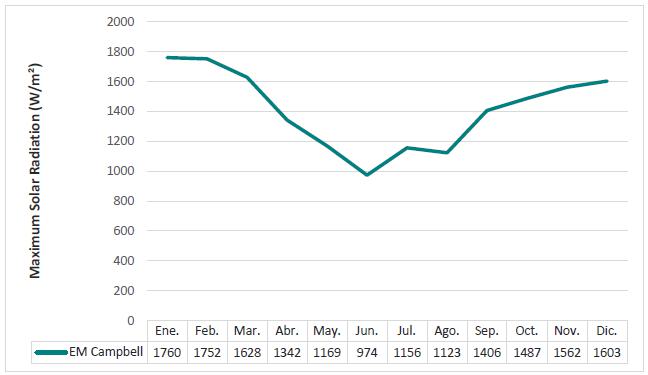
| 4.11 | Air Quality |
Air quality is protected by Law No. 5063 (General Environmental Law) and regulated by Decree 5980/06, which, among other things, determines the emission limits required for compliance with the environmental quality standards of the receiving bodies (Table 4.6).
| Table 4.6 Air Quality Guideline Levels | ||
| Contaminant | µg/m3 | Time Period |
| CO | 40 | 1 hour |
| 10 | 8 hours | |
| SO2 | 850 | 1 hour |
| 400 | 24 hours | |
| 80 | 1 year | |
| NO2 | 400 | 1 hour |
| 180 | 24 hours | |
| 100 | 1 year | |
| Lead | 1.5 | 3 months |
| Particulate Matter | 150 | 24 hours |
| Respirable Fraction | 50 | 1 year |
| Ozone | 235 | 1 hour |
| (photochemical oxidants) | 120 | 8 hours |
| SH2 | 8 | 30 minutes |
Lithium Argentina AG., 2026 Cauchari-Olaroz S-K 1300 Technical Report Cauchari-Olaroz Salars, Argentina | Page 81 of 418 |
For the characterization of air quality at the site of the Expansion Project, information generated by the company during participatory environmental monitoring was considered. The data corresponds to the period 2023-2025. Four sampling points were identified near the areas designated for this new project, and their locations are indicated in Table 4.7 and Figure 4.22.
| Table 4.7 Air Quality Sampling Points | |||||
| Site | Geographic Coordinates | Gauss-Krüger. Zone 3 (POSGAR 94) | |||
| Nomenclatura | Latitud S | Longitud O | Y | X | |
| CIO | CA-5 | 23°36'8,88" | 66°46'16,56" | 3421700 | 7390496 |
| Process Plant | CA-1 | 23°40'26,20" | 66°46'23,84" | 3421118 | 7382576 |
| Salar Cauchari | CA-4 | 23°37'7,58" | 66°43'21,42" | 3426256 | 7388713 |
| Cauchari South Zone (El Porvenir) | CA-2 | 23°48'50,42" | 66°45'41,96" | 3422218 | 7367071 |
In all monitoring activities, the recorded concentrations were consistently below the guideline values established in Decree 5980/06, Annex V, Table 58, with no exceedances or upward trends observed with respect to the reference limits.
The air quality values obtained from March 2023 to June 2025 are detailed below for each site and regulated pollutant (Table 4.8).
Lithium Argentina AG., 2026 Cauchari-Olaroz S-K 1300 Technical Report Cauchari-Olaroz Salars, Argentina | Page 82 of 418 |
Figure 4.22 Air Quality Sampling Points
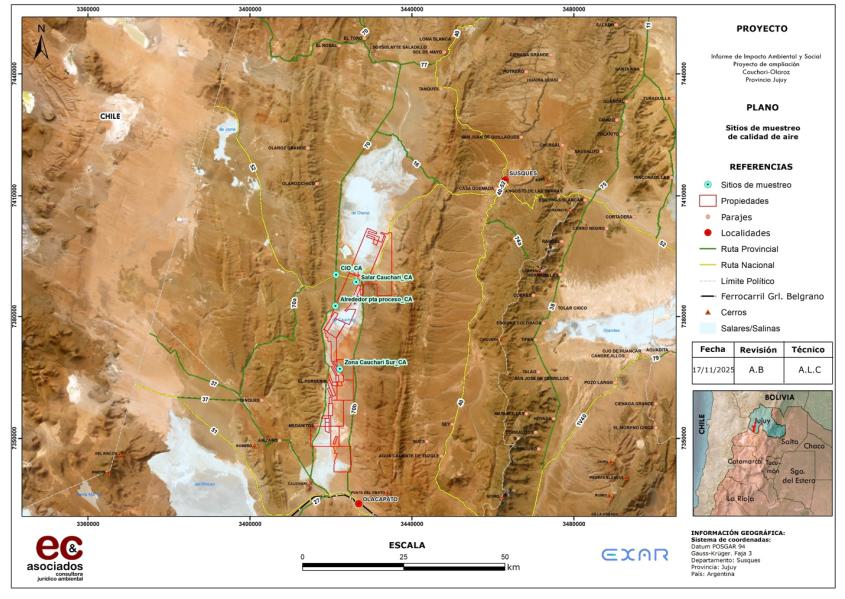
Lithium Argentina AG., 2026 Cauchari-Olaroz S-K 1300 Technical Report Cauchari-Olaroz Salars, Argentina | Page 83 of 418 |
| Table 4.8 Historical Air Quality Results | |||||||||||
| Site | Parameter | Mar-23 | Jun-23 | Sep-23 | Dec-23 | Mar-24 | Jun-24 | Sep-24 | Dec-24 | Mar-25 | Jun-25 |
| Cauchari Sur | CO (µg/m3) | 1200 | 1200 | 1200 | 1200 | 1200 | 1200 | 1200 | 1200 | 1200 | 1200 |
| Cauchari Sur | SO2 (µg/m3) | 50 | 50 | 50 | 50 | 50 | 50 | 50 | 50 | 50 | 50 |
| Cauchari Sur | NOx (µg/m3) | 50 | 50 | 50 | 50 | 50 | 50 | 50 | 50 | 50 | 50 |
| Cauchari Sur | O3 (µg/m3) | 100 | 100 | 100 | 100 | 100 | 100 | 100 | 100 | 100 | 100 |
| Cauchari Sur | SH2 (µg/m3) | 6 | 6 | 6 | 6 | 6 | 6 | 6 | 6 | 6 | 6 |
| CIO | CO (µg/m3) | 1200 | 1200 | 1200 | 1200 | 1200 | 1200 | 1200 | 1200 | 1200 | 1200 |
| CIO | SO2 (µg/m3) | 50 | 50 | 50 | 50 | 50 | 50 | 50 | 50 | 50 | 50 |
| CIO | NOx (µg/m3) | 50 | 50 | 50 | 50 | 50 | 50 | 50 | 50 | 50 | 50 |
| CIO | O3 (µg/m3) | 100 | 100 | 100 | 100 | 100 | 100 | 100 | 100 | 100 | 100 |
| CIO | SH2 (µg/m3) | 6 | 6 | 6 | 6 | 6 | 6 | 6 | 6 | 6 | 6 |
| New Plant | CO (µg/m3) | 1200 | 1200 | 1200 | 1200 | 1200 | 1200 | 1200 | 1200 | 1200 | 1200 |
| New Plant | SO2 (µg/m3) | 50 | 50 | 50 | 50 | 50 | 50 | 50 | 50 | 50 | 50 |
| New Plant | NOx (µg/m3) | 50 | 50 | 50 | 50 | 50 | 50 | 50 | 50 | 50 | 50 |
| New Plant | O3 (µg/m3) | 100 | 100 | 100 | 100 | 100 | 100 | 100 | 100 | 100 | 100 |
| New Plant | SH2 (µg/m3) | 6 | 6 | 6 | 6 | 6 | 6 | 6 | 6 | 6 | 6 |
| Salar Cauchari | CO (µg/m3) | 1200 | 1200 | 1200 | 1200 | 1200 | 1200 | 1200 | 1200 | 1200 | 1200 |
| Salar Cauchari | SO2 (µg/m3) | 50 | 50 | 50 | 50 | 50 | 50 | 50 | 50 | 50 | 50 |
| Salar Cauchari | NOx (µg/m3) | 50 | 50 | 50 | 50 | 50 | 50 | 50 | 50 | 50 | 50 |
| Salar Cauchari | O3 (µg/m3) | 100 | 100 | 100 | 100 | 100 | 100 | 100 | 100 | 100 | 100 |
| Salar Cauchari | SH2 (µg/m3) | 6 | 6 | 6 | 6 | 6 | 6 | 6 | 6 | 6 | 6 |
| Cauchari Sur | PM10 (µg/m3) | 50 | 50 | 50 | 50 | 50 | 50 | 50 | 50 | 50 | 50 |
| Cauchari Sur | Pb Aire (µg/m3) | 1 | 1 | 1 | 1 | 1 | 1 | 1 | 1 | 1 | 1 |
| CIO | PM10 (µg/m3) | 50 | 50 | 50 | 50 | 50 | 50 | 50 | 50 | 50 | 50 |
| CIO | Pb Aire (µg/m3) | 1 | 1 | 1 | 1 | 1 | 1 | 1 | 1 | 1 | 1 |
| New Plant | PM10 (µg/m3) | 50 | 50 | 50 | 50 | 50 | 50 | 50 | 50 | 50 | 50 |
Lithium Argentina AG., 2026 Cauchari-Olaroz S-K 1300 Technical Report Cauchari-Olaroz Salars, Argentina | Page 84 of 418 |
| Table 4.8 Historical Air Quality Results | |||||||||||
| Site | Parameter | Mar-23 | Jun-23 | Sep-23 | Dec-23 | Mar-24 | Jun-24 | Sep-24 | Dec-24 | Mar-25 | Jun-25 |
| New Plant | Pb Aire (µg/m3) | 1 | 1 | 1 | 1 | 1 | 1 | 1 | 1 | 1 | 1 |
| Salar Cauchari | PM10 (µg/m3) | 50 | 50 | 50 | 50 | 50 | 50 | 50 | 50 | 50 | 50 |
| Salar Cauchari | Pb Aire (µg/m3) | 1 | 1 | 1 | 1 | 1 | 1 | 1 | 1 | 1 | 1 |
Lithium Argentina AG., 2026 Cauchari-Olaroz S-K 1300 Technical Report Cauchari-Olaroz Salars, Argentina | Page 85 of 418 |
| 4.12 | Noise |
Environmental noise has become one of the most significant and disruptive pollutants in contemporary society, with direct effects on the well-being and health of the population. In addition to hearing damage resulting from excessive noise levels, it is essential to consider the non-auditory effects, both on humans and other species. In the ecological field, the study of the consequences of anthropogenic noise on fauna is still in its early stages, with a limited number of studies and only partial knowledge of the relationship between noise exposure levels and biological or behavioral responses in wildlife. This lack of information is largely due to the complexity of the environmental variables involved and the spatial variability of noise at the landscape scale (Fahrig, 2003; Coffin, 2007).
For the Puna region, the scientific literature does not report specific studies analyzing the acoustic effects of anthropogenic industrial activities on local fauna in this arid, high-mountain ecosystem.
In Argentina, there are no regulations governing this component, so international standards are used. International organizations such as the World Bank (WB) and the US National Association of Environmental Quality Standards (NAAQS) and the United States Environmental Protection Agency (USEPA), according to the International Finance Corporation (IFC, 2007), and the World Health Organization (WHO), have suggested sound thresholds depending on the area or activity taking place, in this case, industrial zones. These environmental regulations generally establish lower limits than those of labour laws because they consider factors such as tranquility and rest, not just hearing health. This is summarized in Table 4.9.
| Table 4.9 Comparison Standards for Noise Quality | ||
| Application Areas | Values Expressed in dBA | |
| Daytime Hours |
Nightime Hours | |
| World Bank | ||
| Residential - Institutional - Educational | 55 | 45 |
| Industrial - commercial | 70 | 70 |
| US-EPA | ||
| Residential | 75 | 65 |
| Industrial - commercial | 80 | 72 |
The baseline for current ambient noise levels in the area of influence of the expansion project is based on information obtained from participatory environmental monitoring reports conducted by the company. For this purpose, four sites were selected that are representative due to their proximity to the new project areas. The location of these points is shown in Figure 4.23 and Table 4.10.
Lithium Argentina AG., 2026 Cauchari-Olaroz S-K 1300 Technical Report Cauchari-Olaroz Salars, Argentina | Page 86 of 418 |
Figure 4.23 Ambient Noise Sampling Points
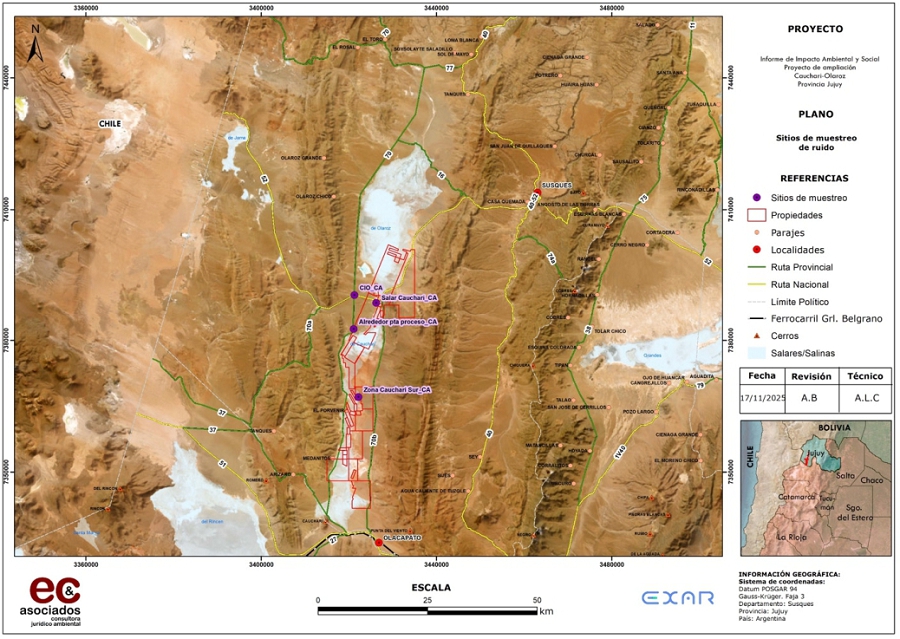
Lithium Argentina AG., 2026 Cauchari-Olaroz S-K 1300 Technical Report Cauchari-Olaroz Salars, Argentina | Page 87 of 418 |
| Table 4.10 Location of Noise Quality Sampling Points | |||||
| Site | Geographic Coordinates | Gauss-Krüger. Zone 3 (POSGAR 94) | |||
| Latitud S | Longitud O | Este | Norte | ||
| Near Processing Plant | R1 | 23°40'25,10" | 66°46'22,10" | 3421167,00 | 7382610,00 |
| CIO | R2 | 23°36'08,20" | 66°46'01,70" | 3421702,64 | 7390517,07 |
| Salar Cauchari | R4 | 23°37'06,40" | 66°43'19,50" | 3426310,41 | 7388750,40 |
| Cauchari South Zone (El Porvenir) | R7 | 23°48'50,89" | 66°45'41,67" | 3422218,09 | 7367071,11 |
The characterization was conducted between March 2023 and June 2025. The data obtained are summarized in Table 4.11, which also mentions the threshold values and highlights the cases in which these limits were exceeded.
| Table
4.11 Historical Noise Quality Results and the Thresholds Established by International Standards | ||||||||
| Monitoring | LAeq.10 | BM (dBA) |
USEPA (dBA) |
OMS | ||||
| R1 | R2 | R4 | R7 | Leq (dBA) |
LMax
(dBA) | |||
| Mar-23 | 40 | 41.7 | 29 | 22.9 | 70 | 80 | 70 | 110 |
| Jun-23 | 47.49 | 45.05 | 48.2 | 39.4 | 70 | 80 | 70 | 110 |
| Sep-23 | 57.07 | 58.38 | 60.5 | 76.47 | 70 | 80 | 70 | 110 |
| Dec-23 | 38 | 48.2 | 31.4 | 28 | 70 | 80 | 70 | 110 |
| Mar-24 | 53.8 | 54.06 | 48 | 51.9 | 70 | 80 | 70 | 110 |
| Jun-24 | 59.82 | 59.64 | 43.3 | 87.8 | 70 | 80 | 70 | 110 |
| Sep-24 | 41.64 | 57.43 | 24.7 | 42.2 | 70 | 80 | 70 | 110 |
| Dec-24 | 53.69 | 38.45 | 21.72 | 47.9 | 70 | 80 | 70 | 110 |
| Mar-25 | 43.71 | 43.29 | 42.17 | 15.51 | 70 | 80 | 70 | 110 |
| Jun-25 | 54.46 | 56.53 | 71.6 | 40.32 | 70 | 80 | 70 | 110 |
In most cases, the values are below the limits established by the regulations. Regarding the three values exceeding the limit, their corresponding reports indicate that they were associated with strong winds at the time of measurement. Figure 4.24 graphically presents the results obtained with respect to the reference limits considered.
Lithium Argentina AG., 2026 Cauchari-Olaroz S-K 1300 Technical Report Cauchari-Olaroz Salars, Argentina | Page 88 of 418 |
Figure 4.24 Historical Noise Quality Results and the Threshold Values Established by International Regulations
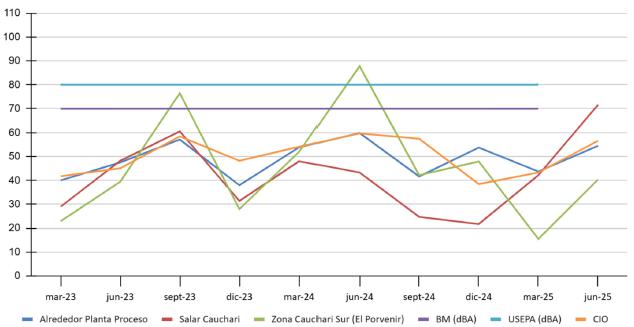
Lithium Argentina AG., 2026 Cauchari-Olaroz S-K 1300 Technical Report Cauchari-Olaroz Salars, Argentina | Page 89 of 418 |
5.0 History
Historically, Rio Tinto has mined borates on the western side of the Cauchari salar, at Yacimiento de Borato El Porvenir. Grupo Minero Los Boros S.A. mines a few thousand tonnes per year of ulexite on the east side of the Olaroz Salar. No other mining activity (including lithium production) has been recorded at the properties comprising Cauchari-Olaroz. Exar acquired Mining and Exploration Permits across the Cauchari and Olaroz Salars during 2009 and 2010. The Company completed a resource exploration program in 2009 and 2010 targeting both lithium and potassium.
In 2010, the Company filed a Measured, Indicated, and Inferred Mineral Resource report for both lithium and potassium (King, 2010b). An amended Inferred Mineral Resource report was filed later that year (King, 2010a). In 2012, the Company filed a feasibility study in accordance with NI 43-101 that presented a Mineral Resource and Mineral Reserve Estimate, proposed processing technology, environmental and permitting assessment, costing and economic analysis. In 2017, LAR filed a NI 43-101 compliant Feasibility Study, with an updated Mineral Reserve Estimate. In April of 2019, LAR filed a NI 43-101 compliant Updated Mineral Resource Estimate with an updated Mineral Resource Estimate. For reference purposes, the 2012 Mineral Resource Estimate is provided in Table 5.1 and the 2019 Mineral Resource Estimate is presented in Table 5.2 and Table 5.3. All past Mineral Resource and Mineral Reserve Estimates are no longer considered current and are superseded by the Mineral Resource Estimates presented in Section 11.0 and the Mineral Reserve Estimate presented in Section 12.0 of this Report.
| Table 5.1 Summary of 2012 Lithium Mineral Resource for Lithium (1-4) | ||||
| Classification | Average Lithium Concentration (mg/L) |
Mass Cumulated1 (cut-off 354 mg/L) |
Brine Volume (m³) | |
| Li (tonne) |
Li2CO3 (tonne) | |||
| 2012 Measured Mineral Resource | 630 | 576,000 | 3,039,000 | 9.1 x 10⁸ |
| 2012 Indicated Mineral Resource | 570 | 1,650,000 | 8,713,000 | 2.9 x 10⁹ |
| Total | 585 | 2,226,000 | 11,752,000 | 3.8 x 10⁸ |
| Notes: |
| 1. | The 2012 Mineral Resources are expressed relative to a lithium grade cut-off of ≥ 354 mg/L, which was identified as a brine processing constraint by LAR engineers, and with an effective date of July 11, 2012. | |
| 2. | Mineral Resources are not Mineral Reserves and do not have demonstrated economic viability. There is no certainty that all or any part of the Mineral Resource will be converted to Mineral Reserves. | |
| 3. | Lithium carbonate equivalent (“LCE”) is calculated based the following conversion factor: Mass of LCE = 5.323 x Mass of lithium metal. | |
| 4. | The values in the columns on Lithium Metal and Lithium Carbonate Equivalent above are expressed as total contained metals within the relevant cut-off grade. |
Lithium Argentina AG., 2026 Cauchari-Olaroz S-K 1300 Technical Report Cauchari-Olaroz Salars, Argentina | Page 90 of 418 |
| Table 5.2 Summary of 2019 Mineral Resource Estimate for Lithium Represented as LCE, Exclusive of Mineral Reserves (1-9) | ||
| Classification |
LCE (tonnes) |
LCE – LAR’s 44.8% Portion (tonnes) |
| Measured Resource | 3,040,109 | 1,361,969 |
| Indicated Resource | 13,177,246 | 5,903,406 |
| Measured + Indicated | 16,217,355 | 7,265,375 |
| Inferred | 4,722,700 | 2,115,769 |
| Notes: |
| 1. | S-K §229.1300 definitions were followed for Mineral Resources and Mineral Reserves. | |
| 2. | The Qualified Person for these Mineral Resources and Mineral Reserves for Cauchari Olaroz, Mr. Daniel S. Weber, P.G., RM-SME, reviewed and confirmed that there have been changes to data since the effective date of the estimates, however such changes are not material and the Mineral Resources and Mineral Reserves and the underlying material assumptions remain current as of December 31. 2024. | |
| 3. | The Mineral Resource Estimate is reported in-situ and exclusive of Mineral Reserves, where the lithium mass is representative of what remains in the reservoir after the LOM. To calculate Mineral Resources exclusive of Mineral Reserves, a direct correlation was assumed between Proven Mineral Reserves and Measured Mineral Resources, and similarly, between Probable Mineral Reserves and Indicated Mineral Resources. Proven Mineral Reserves (from the point of reference of brine pumped from the wellfield to the evaporation ponds) were subtracted. The average grade for Measured and Indicated Mineral Resources exclusive of Mineral Reserves was back-calculated based on the remaining brine volume and lithium mass. | |
| 4. | Lithium carbonate equivalent (“LCE”) is calculated using mass of LCE = 5.322785 multiplied by the mass of Lithium reported in Table 11.6. | |
| 5. | The Mineral Resource Estimate is not a Mineral Reserve Estimate and does not have demonstrated economic viability. There is no certainty that all or any part of the Mineral Resources will be converted to Mineral Reserves. Inferred Mineral Resources have great uncertainty as to their existence and whether they can be mined legally or economically. | |
| 6. | Calculated brine volumes only include Measured, Indicated, and Inferred Mineral Resource volumes above a lithium concentration cut-off grade of 300 mg/L. | |
| 7. | Comparisons of values may not add due to rounding of numbers and the differences caused by use of averaging methods. | |
| 8. | Processing efficiency is assumed to be 53.7%. | |
| 9. | The pricing, based on the estimates and the time frame for the economic viability, is described in Section 16.3 - Price Forecast. |
Lithium Argentina AG., 2026 Cauchari-Olaroz S-K 1300 Technical Report Cauchari-Olaroz Salars, Argentina | Page 91 of 418 |
| Table 5.3 Summary of 2019 Estimated Proven and Probable Mineral Reserves (Without Processing Efficiency) | ||||||
| Mineral Reserve Classification |
Production Period (years) |
Brine Pumped (m3) |
Average Lithium Concentration (mg/L) |
Lithium Metal (tonnes) |
LCE (tonnes) |
LCE – LAR’s 44.8% Portion (tonnes) |
| Proven | 0 through 5 | 156,875,201 | 616 | 96,650 | 514,450 | 230,474 |
| Probable | 6 to 40 | 967,767,934 | 606 | 586,270 | 3,120,590 | 1,398,024 |
| Total | 40 | 1,124,643,135 | 607 | 682,920 | 3,635,040 | 1,628,498 |
| Notes: |
| 1. | The Mineral Reserve Estimate has an effective date of May 7, 2019. The Qualified Person for these Mineral Resources and Mineral Reserves for Cauchari-Olaroz, Mr. Daniel S. Weber, P.G., RM-SME, reviewed and confirmed that the Mineral Reserves Estimates, along with the material assumptions related to them, as presented in the Cauchari-Olaroz Technical Report Summary (TRS), remained accurate as of the effective report date of December 31, 2024. |
| 2. | LCE is calculated using mass of LCE = 5.322785 multiplied by the mass of Lithium Metal. |
| 3. | The conversion to LCE is direct and does not account for estimated processing efficiency. |
| 4. | The values in the columns for “Lithium Metal” and “LCE” above are expressed as total contained metals. |
| 5. | The Production Period is inclusive of the start of the model simulation (Year 0). |
| 6. | The average lithium concentration is weighted by per well simulated extraction rates. |
| 7. | Tonnage is rounded to the nearest 10. |
| 8. | Comparisons of values may not be equivalent due to rounding of numbers and the differences caused by use of averaging methods. |
| 9. | Processing efficiency is assumed to be 53.7%. |
| 10. | The pricing, based on the estimates and the time frame for the economic viability, is described in Section 16.3 - Price Forecast. |
Lithium Argentina AG., 2026 Cauchari-Olaroz S-K 1300 Technical Report Cauchari-Olaroz Salars, Argentina | Page 92 of 418 |
6.0 Geological Setting, Mineralization and Deposit
The Central Andean Altiplano-Puna Plateau is the second-highest orogenic plateau globally, averaging 4000 meters above sea level, and the highest associated with extensive arc volcanism (Allmendinger et al., 1997; Pingel et al., 2023). The eastward-propagating fold and thrust belt defines a series of longitudinal tectonomorphic zones relevant to lithium (Li) brine formation, including, from east to west: the Precordillera and Cordillera de Domeyko; the Salar de Atacama (a distinct salt flat separate from the Altiplano-Puna basins), the Western Cordillera; the Altiplano-Puna; and the Eastern Cordillera (Figure 6.1; Allmendinger et al., 1997; Strecker et al., 2007; Victor et al., 2004; Carrapa et al., 2011). The Altiplano-Puna Plateau comprises high-elevation internally drained basins, arid climate conditions, and thick sedimentary accumulations conducive to Li brine generation and is geological setting of the Cauchari-Olaroz salar (Figure 6.1).
| 6.1 | Regional Structural and Volcanic Features |
The current relief of the Puna is characterized by north-south elongated mountain ranges separated by wide valleys often with endorheic depocenters (Figure 6.1). In most cases, the ranges are dominated by Paleozoic and Paleogene rocks unconformably overlain by Neogene sedimentary and volcanic rocks. Structures in the Neogene rocks are predominantly characterized by open folds and low-displacement thrust faults, contrasting with tight folds and high-displacement thrust faults exhibited by the Paleozoic to Paleogene units (Seggiaro et al., 2017). These basins have formed primarily in the eastern and central sectors of the Puna Plateau, through compressional Miocene-age orogeny (Helvaci and Alonso, 2000), and have been accumulation sites for numerous salars, including Cauchari and Olaroz.
Altiplano-Puna Plateau uplift timing and mechanisms remain debated. Paleoaltimetric, thermochronologic, and palinspastic reconstructions contend either rapid kilometer-scale uplift during the Middle-Late Miocene (Ghosh et al., 2006; Pingel et al., 2023) or a more gradual rise since at least the Eocene (Canavan et al., 2014; Carrapa et al., 2014). Most of the uplift of the Altiplano began in the Late Oligocene, migrating eastward to the Eastern Cordillera of NW Argentina by ~12 Ma, where exhumation continued through ~4 Ma (Allmendinger et al., 1997; Carrapa et al., 2011). Farther south in the Puna, major uplift initiated in the Miocene and lasted until ~1-2 Ma. (Allmendinger et al., 1997).
Eastward migration of the orogen was accompanied by voluminous ignimbrite volcanism covering >500,000 km2 (Allmendinger et al., 1997). Ignimbrites of the Altiplano-Puna Volcanic Complex (APVC), centered near the Argentina-Bolivia-Chile triple junction (Figure 6.1) erupted most extensively from large calderas between ~10-4 Ma (De Silva et al., 2006), and are often preserved as intercalated tuffs and tephra in Neogene sedimentary successions throughout the central Andes. Later Pliocene to Quaternary backarc volcanic centers and ignimbrite deposits became more subdued and more localized along NW-SE crustal lineaments such as Archibarca, Culampaja, Ojos del Salado, and Calama-Olacapato-El Toro (COT) lineaments (Figure 6.1; Richards and Villeneuve, 2002; Chen et al., 2020). These zones - including the Tocomar-Tuzgle area in the eastern Puna and the Cerro Galan Caldera in the Southern Puna (Figure 6.1) - reflect long-lived magmatism and hydrothermal activity in zones of elevated crustal permeability that likely contributed to Li mobilization and enrichment in adjacent basins.
Lithium Argentina AG., 2026 Cauchari-Olaroz S-K 1300 Technical Report Cauchari-Olaroz Salars, Argentina | Page 93 of 418 |
Figure 6.1 Regional Geology in the Vicinity of the Exar Project
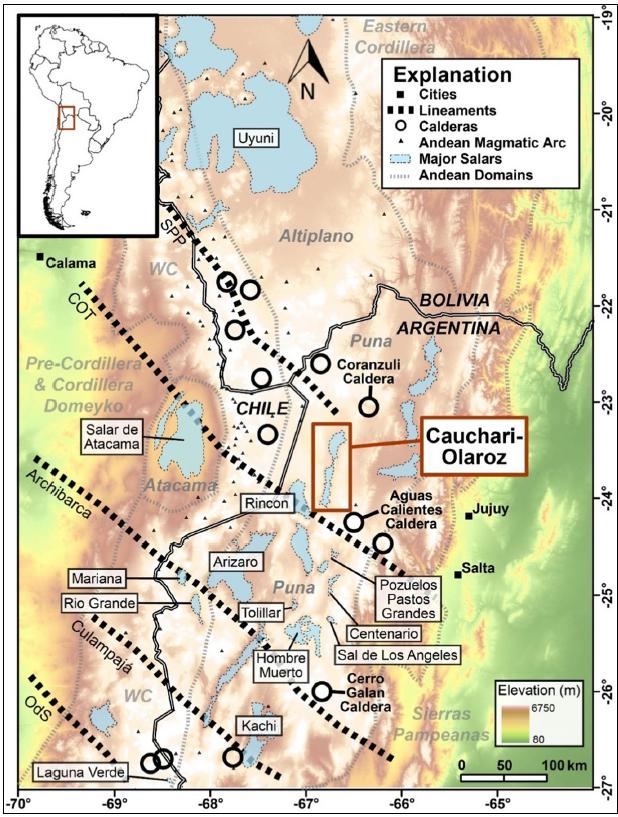
Source: Benson et al. (2026)
Lithium Argentina AG., 2026 Cauchari-Olaroz S-K 1300 Technical Report Cauchari-Olaroz Salars, Argentina | Page 94 of 418 |
| 6.2 | Regional Geology |
The regional geology of the Olaroz and Cauchari Salars is shown in Figure 6.2. The lithology in the region can broadly be defined into Ordovician metasedimentary basement locally intruded by igneous rocks of the Oire Complex, sediments of the Eocene Salta Group, Neogene sediments, Quaternary sediments, and volcanic rock, typically of Neogene to Pliocene age (Figure 6.2; Benson et al., 2026).
Figure 6.2 Structural Features in the Central Area of the Cauchari Basin
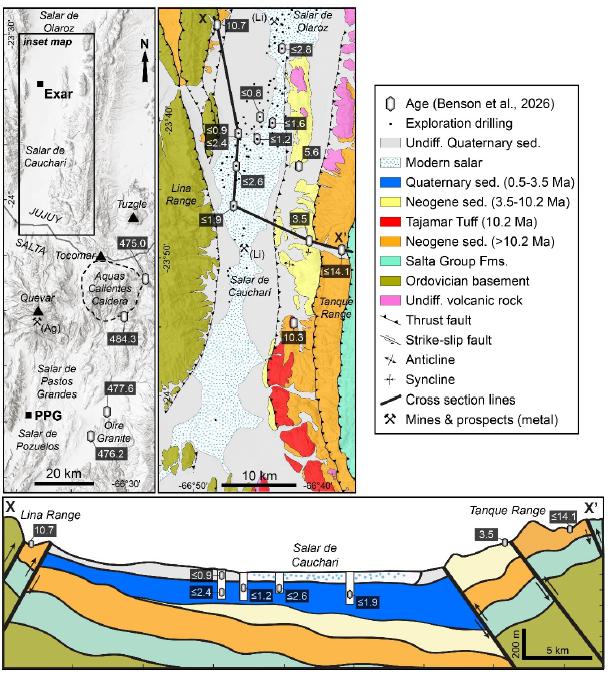
Source: Modified from Benson et al. (2026).
Lithium Argentina AG., 2026 Cauchari-Olaroz S-K 1300 Technical Report Cauchari-Olaroz Salars, Argentina | Page 95 of 418 |
| 6.3 | Geology of the Olaroz and Cauchari Salars |
| 6.3.1 | Conceptual Geology |
The margins of the north-south trending Cauchari and Olaroz salars (Figure 6.2) are dominantly composed of Ordovician metasedimentary rocks of the Coquena Formation (Seggiaro et al., 2015), which are overlain by Cretaceous to Eocene sedimentary rock formations of the Salta Group (Figure 6.2). A thick (>1km) sequence of variably folded and faulted Neogene sandstones, siltstones, and subordinate claystones and conglomerates overlies these sediments, locally referred to as Vizcachera and Sijes Formations (Seggiaro et al., 2015). This long-lived alluvial to fluvial setting preserved intercalated volcanic rocks and tephra sourced from intermediate to rhyolitic centers of the region, including the 11.8 Ma Yungara Volcanics (Schwab and Lippolt, 1976), 10.2 Ma Tajamar Tuff (Petrinovic et al., 2010), and 6.6 Ma Coranzuli Tuff (Seggiaro et al., 2019). New U-Pb zircon ages on surface outcrops of these marker beds indicate that alluvial fan sedimentation was active for at least ten million years from ~14.1-3.5 Ma (Figure 6.2; Benson et al., 2026). The Tajamar Tuff , sourced from the Aguas Calientes Caldera to the south of the Salar de Cauchari, is a key marker bed in the stratigraphy to help to discriminate the stratigraphy of Neogene sedimentation in the area (Figure 6.2). In places, a sharp angular unconformity separates the post-Tajamar Neogene sediments from older units, indicating that an uplift event occurred sometime after the deposition of the Tajamar Tuff, enabling the deposition of alluvial to fluvial sediments between 10.2 and 3.5 Ma.
Shortly after 3.5 Ma, based on the youngest dated tephra in folded outcropping Neogene sediments (Benson et al., 2026), another Andean tectonic event caused east-dipping thrust faulting and folding of these sediments and formation of the modern Cauchari and Olaroz salars (Figure 6.2). These Neogene sedimentary rocks correlate with compacted, inclined sediments in core intervals at ~200 m depth in the western salar and ~600 m in the center. To date, no holes deeper than 700m have been drilled in Cauchari, but the extrapolation of this trend eastward indicates this contact is >1000 m deep beneath modern sediments along the eastern margin (Figure 6.2). Equivalent sediments have not yet been intersected in the Olaroz salar, suggesting that these 10.2-3.5 Ma sediments are significantly deeper than in Cauchari.
Most drilling in the whole basin has been within the modern younger, unconsolidated, flat-lying sandstones, siltstones, and halite–claystone lacustrine units (Figure 6.2). These halite-bearing sediments contain thin primary and reworked volcanic ashes with eight new detrital zircon U-Pb ages ranging from 2.8 to 0.80 ± 0.1 Ma (Benson et al., 2026). This constrains the timing of basin formation and halite deposition to less than 3.5 Ma. The lack of halite deposition in Neogene sediments prior to this time suggests that these systems were not endorheic and therefore open to exporting solutes. Closed-basin Li enrichment in residual brine has been active since basin development and continues to the present day.
| 6.4 | Salar Surface Sediments and Mineralization |
The surface distribution of alluvium, salar sediments, and basement rock in the central zone of the Cauchari Basin is shown in Figure 6.3. This zone is shown because it is the focus of the Mineral Reserve Estimate (Section 12.0). Flat-lying salar deposits occur throughout the salars, at the lowest ground surface elevation in the basin. Alluvial deposits intrude into these salar deposits to varying degrees, depending on location. The alluvium surface slopes upward from the salar surface and extends outside the basin perimeter. Raised bedrock exposures also occur outside the salar basin.
Lithium Argentina AG., 2026 Cauchari-Olaroz S-K 1300 Technical Report Cauchari-Olaroz Salars, Argentina | Page 96 of 418 |
The most extensive intrusion of alluvium into the basin occurs on the Archibarca Fan (Figure 6.2), which partially separates the Olaroz and Cauchari Salars. Route 52 is constructed across this alluvial fan. The Archibarca Fan developed during the late-Holocene. In addition to this major fan, much of the perimeter zone of both salars exhibits encroachments of alluvial material forming fans of varying sizes. Alluvium deposition is interpreted to range from early- to late-Holocene.
A range of dominant sediment types and characteristic mineral assemblages are found across the surface of the Olaroz and Cauchari Salars. In the Olaroz Salar and the southern part of the Cauchari Salar, particularly in marginally elevated areas, buff clays occur, interlayered with dirty calcite travertine sand with irregular calcite cementation produced mainly by hydrothermal activity (calcareous sinters). Ulexite concretions with or without gypsum and mirabilite are occasionally associated with the carbonate deposits.
Borax is common throughout both salars, occuring as small, rounded concretions in red and brown clays along a narrow and discontinuous strip on the western border of Cauchari Salar and in the eastern and central area of the Olaroz Salar. In some areas of the central Olaroz Salar, surficial borax alters to form evaporitic ulexite. When this mineral occurs in significant concentrations it forms large ulexite concretions or “papas” that expand the associated black or red clays, creating a hummocky surface. In the subsurface, borax commonly occurs as concretions and as an in-filling of corrosion holes in halite. In some locations, borax has been replaced by ulexite and/or tincal.
Gypsum is the primary sulphate mineral in the surficial muds and the crystals commonly have a small, bladed habit. In some locations, mirabilite and trona are associated with the gypsum-bearing layers. Trona is more abundant in the Cauchari Salar, although neither salar is known to contain exploitable amounts.
Halite occurs throughout the surface of both salars but is more dominant on the Olaroz Salar where a well-formed, polygonal-cracked, salt hardpan is present. In contrast, the surface layer across much of the Cauchari Salar consists of a thin, red silt / halite, polygonal-cracked crust over brine-saturated red plastic silt.
Distinctive accessory minerals occur within the red surface silt of the Cauchari Salar. Gypsum and minor glaserite are the main accessory phases in the southern area of the salar. In the central area, halite is a primary accessory mineral and gypsum is secondary. Ulexite, mirabilite, and trona are the primary accessory phases in the northern area of Cauchari.
In the zone where the recent alluvial fans merge with the salar sediments, the salar sediments often exhibit evidence of biological activity (bioturbation and rootlets) and are typically devoid of borate concretions and gypsum.
Lithium Argentina AG., 2026 Cauchari-Olaroz S-K 1300 Technical Report Cauchari-Olaroz Salars, Argentina | Page 97 of 418 |
Figure 6.3 Surficial Geology in the Central Area of the Cauchari Basin
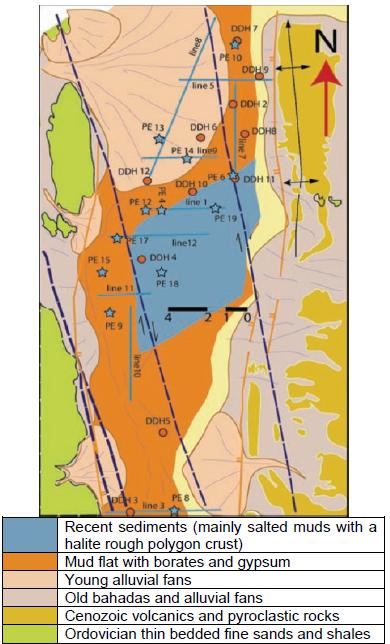
Source: King, Kelley, Abbey, (2012).
| 6.5 | Salar Lithostratigraphic Units |
The following five informal lithological units are interpreted from the drill core in 2012:
| · | Unit 1. Red silts with minor clay and sand; | |
| · | Unit 2. Banded halite beds with clay, silt, and minor sand; | |
| · | Unit 3. Fine sands with minor silt and salt beds; | |
| · | Unit 4. Massive halite and banded halite beds with minor sand; and | |
| · | Unit 5. Medium and fine sands. |
Lithium Argentina AG., 2026 Cauchari-Olaroz S-K 1300 Technical Report Cauchari-Olaroz Salars, Argentina | Page 98 of 418 |
The hydrostrartigraphic units (HSUs) described briefly below according to the 2025 Conceptual Model (Montgomery, 2025):
| · | HSU 1 – Upper Proximal Alluvial: This unit consists mainly of red to grayish-brown silty layers with minor clay, interbedded with fine to coarse sand and trace gravel. Surface features include mud cracks and bioturbation, while deeper levels contain carbonate concretions and occasional gypsum crystals. Borate concretions are common, and halite occurs locally. Clay mineralogy is dominated by illite with minor kaolinite, smectite, and chlorite, indicating a Neogene volcanic source. Hydrogeologically, this unit exhibits hydraulic conductivity (K) ranging from approximately 2 to 120 m/d and storativity (S) on the order of 4 × 10⁻², representing a high-permeability unit. |
| · | HSU2–Intermediate Alluvial: This unit is characterized by stratified halite with interbeds of reddish clay or silt and massive fine-grained sand layers, locally cemented by halite. Minor evaporites, silts, and sands are also present. The unit typically reaches thicknesses of 50–60 m and is more clay-rich than HSU 1. Hydraulic conductivity (K) ranges from approximately 0.9 to 12 m/d, with storativity on the order of 4 × 10⁻². Based on these properties, HSU 2 is classified as an aquifer with good hydrogeological potential. |
| · | HSU 3 – Upper Distal Alluvial: This unit comprises massive, light gray to brownish-gray fine-grained sands interbedded with evaporite layers, mainly halite. Thin red silt horizons occur locally. The sand is composed of quartz, feldspar, mafic minerals, magnetite, and volcanic glass, with minor halite, gypsum, and borates. Hydrogeological parameters indicate K values ranging from approximately 0.006 to 18 m/d and storativity on the order of 3 × 10⁻³. This unit is therefore considered to have low hydrogeological potential. |
| · | HSU 4 – Evaporite–Alluvial Interbedded Unit: This unit is dominated by stratified and massive halite beds interlayered with sand, with individual layers typically 1–3 m thick, locally reaching much greater thicknesses. Red clay layers, borate concretions, and occasional carbonate horizons are present. Hydraulic conductivity (K) ranges from approximately 0.04 to 2 m/d, with storativity on the order of 1 × 10⁻³. Due to these characteristics, HSU 4 is classified as a low-potential aquifer. |
| · | HSU 5 – Lower Alluvial fan: This unit consists of thick-bedded fine-grained sands alternating with massive light red silts, with coarser sand toward the base. The mineralogy indicates volcanic source rocks, with minor bioturbation and rare halite and gypsum crystals. Hydraulic conductivity (K) ranges from approximately 0.4 to 2 m/d, with storativity on the order of 2 × 10⁻². This unit is also classified as an aquifer with low hydrogeological potential. |
| · | HSU 6 – Base of the Current Aquifer for Resource Estimation: This unit represents the hydrogeological base of the current aquifer system for the purposes of the Mineral Resource estimation and is interpreted as the basal boundary of the aquifer system. |
Refer to Section 11.2.1 and Section 12.7 for a more detailed breakdown of the stratigraphic and hydrostratigraphic units used in the Mineral Resource Estimate and Mineral Reserve Estimate, respectively.
Lithium Argentina AG., 2026 Cauchari-Olaroz S-K 1300 Technical Report Cauchari-Olaroz Salars, Argentina | Page 99 of 418 |
| 6.5.1 | Sedimentation Cycles |
Sedimentation cycles were evaluated for the salar sediments, as a supportive step for understanding, delineating, and grouping the important hydrostratigraphic units. The energy level and RBRC curves help to explain the vertical variations observed in the salar sediments. The RBRC curves show the distribution of measured RBRC, expressed over 10 m intervals. The collection and analysis of the RBRC samples are described in Section 8.9.2. The energy level curves represent a qualitative measure of depositional energy, expressed over five-meter intervals. The lithology-based scale used to rank the energy level is summarized below:
| 0 - | Massive halite beds (> 5 cm thick); | |
| 1 - | Halite in thin beds (< 5 cm), including banded halite with thin sand, silt, or clay partitions; | |
| 3 - | Silt with root marks or bioturbation; silty clay beds with or without halite crystals and borate concretions; silt or clay with plant remains; thin and irregular clay or halite bedding; | |
| 4 - | Silt with or without halite crystals and borate concretions; | |
| 5 - | Fine-grained sands; | |
| 7 - | Medium-grained sands; and | |
| 8 - | Coarse-grained sand with or without gravel. |
This scale is qualitative and was developed as an aid for interpreting sedimentary cycles in the salar. The exclusion of Levels 2 and 6 is intended to represent a large energy level increase between Levels 1 and 3, and Levels 5 and 7, relative to the other levels.
The energy level measurements in DDH10 exhibit a repeating pattern, between the upper 130 m of the borehole and the lower part of the borehole. This pattern is considered to represent two distinct sedimentation cycles: an Upper Salt Generation Cycle (“USGC”) and a Lower Salt Generation Cycle (“LSGC”), with the division between the two occurring at approximately 130 mbgs. These cycles are used as an aid to interpret the progression of sediment deposition throughout the Project area, and to support the development of a hydrostratigraphic model.
| 6.5.2 | Sedimentary Facies Analysis and In-filling History |
The figures referred to in this subsection are from a sedimentology report prepared on behalf of Exar (Bossi, 2011).
The distribution of dominant geologic materials within the LSGC (defined as > 130 mbgs) is shown in Figure 6.4. Materials are divided into fractions of three end members that exhibit unique porosity profiles: sand, silt, and halite. Isopleth maps of salt and sand thickness within the LSGC are shown in Figure 6.5 and Figure 6.6, respectively. These maps were used to infer the primary locations where salt deposition occurred within the basin, and where sand entered the basin.
A central elongated salt deposition zone dominates the LSGC, as shown in Figure 6.4. This salt body is continuous, but irregular in the fraction that it comprises of the LSGC. As shown in Figure 6.5, elongated zones of relatively more dominant salt deposits occur in the southern, central, and northern areas of the salar. The northern zone is displaced towards the east, due to the strong influence of clastic sedimentation associated with the Archibarca Fan.
Lithium Argentina AG., 2026 Cauchari-Olaroz S-K 1300 Technical Report Cauchari-Olaroz Salars, Argentina | Page 100 of 418 |
Figure 6.4 Facies Map of the Lower Salt Cycle Showing Line 1 Crossing a Thick Salt Succession
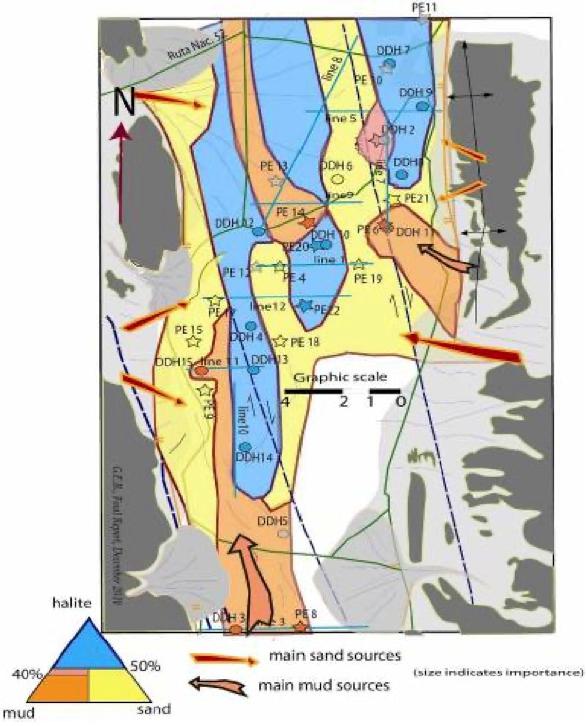
Source: Bossi, (2011)
Lithium Argentina AG., 2026 Cauchari-Olaroz S-K 1300 Technical Report Cauchari-Olaroz Salars, Argentina | Page 101 of 418 |
Figure 6.5 Isopleth Curves of Salt Percent in the Facies Triangle
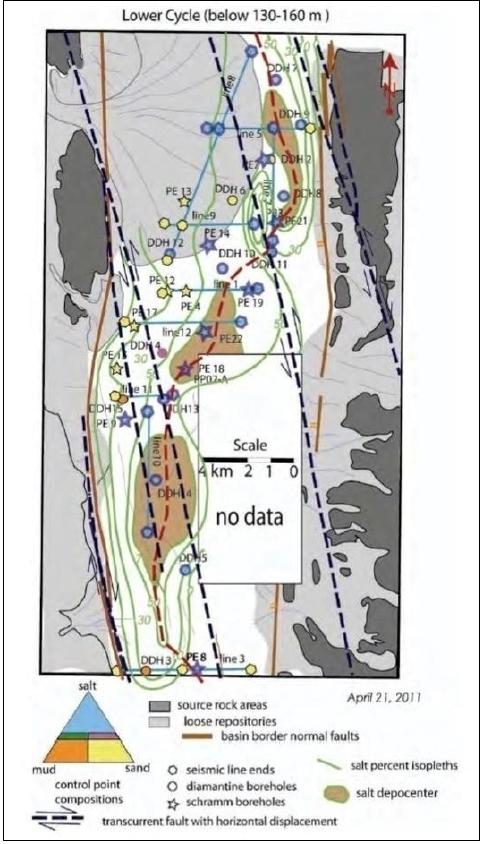
Source: Bossi, (2011)
Lithium Argentina AG., 2026 Cauchari-Olaroz S-K 1300 Technical Report Cauchari-Olaroz Salars, Argentina | Page 102 of 418 |
Figure 6.6 Main Salt Sources of the Lower Cycle
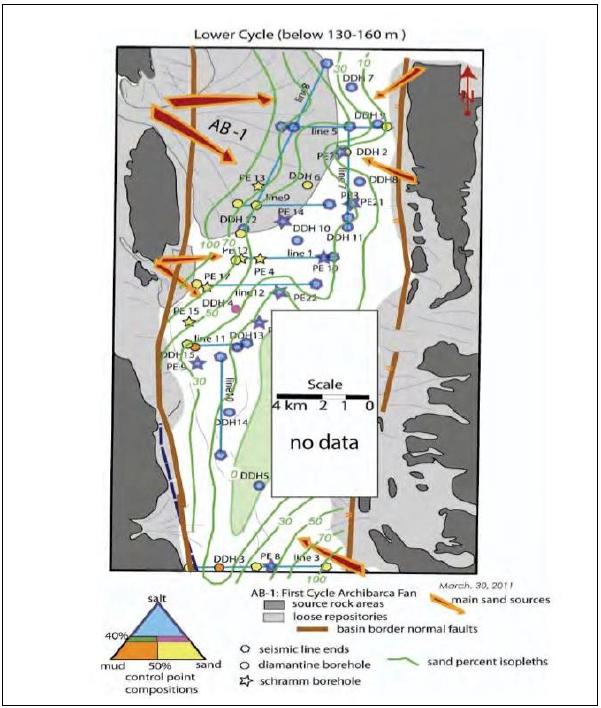
Source: Bossi, (2011)
Clastic contributions to the LSGC originated from various locations around the salar (Figure 6.6). However, the main sand source was located in the mountains to the west of the salar and is responsible for the LSGC occurrence of the Archibarca Fan. The influence of this source is indicated by the increasing sand fraction in the vicinity of the fan (Figure 6.6). The main mud source is south of the salar, with an additional source located to the west.
Lithium Argentina AG., 2026 Cauchari-Olaroz S-K 1300 Technical Report Cauchari-Olaroz Salars, Argentina | Page 103 of 418 |
The distribution of materials in the LSGC is related to the equilibrium between subsidence and clastic supply. Brine became concentrated in the dropped zones, and extensive halite beds were formed through evaporation. Conversely, the horsts were relatively elevated and primarily received muds (silts) or sands. LSGC deposits were formed during the Late/Middle Pleistocene when the Puna region was situated at lower altitudes. At that time, cooler climatic conditions and rain-shadow effects associated with the eastern Pampean Ranges resulted in enhanced aridity. Climatic conditions cycled between relatively wet and dry periods.
The wet periods were characterized by the development of permanent shallow lakes with high evaporation rates and the dry periods by ephemeral lagoons. Saltpan formation was enhanced during the wet periods, and the salt deposited at these times tends to be white to grey in colour and lacking in clastic components. Conversely, banded halite and associated reddish-coloured clastic materials were likely crystallized and deposited in drier periods.
The distribution of materials in the USGC (defined as <130 mbgs) is shown in Figure 6.7. For these more recent deposits, the supply of clastic sediments is greater, particularly in association with the Archibarca Fan. Consequently, the saltpan is located mainly in the southern area of the salar with a minor isolated zone in the north, probably connected with the Olaroz Basin.
The distribution of salt in the LSGC follows a relatively regular pattern (Figure 6.8), probably due to the smoothing effect of the final subsidence stage. The two southern loci of salt deposits in the LSGC (Figure 6.5) unify into one in the USGC (Figure 6.8,) that occupies a broader zone in the central area of the basin. A remnant small salt zone persists in the northeastern area of the salar close to the eastern border and in front of the Archibarca Fan.
Figure 6.9 shows locations where sand entered the salar basins during the USGC deposition period. Similar to the LSGC, the primary location is at the Archibarca Fan (below the present-day fan), as indicated by the high sand fraction extending into the salar. Secondary locations occur at another fan system originating from the eastern mountains, and at two locations along the western basin border south of the Archibarca Fan. Penetration of the Archibarca Fan into the basin reaches a maximum during the period represented by the USGC. During this period, most mud still originated from the south with minor contributions from the mountains located on the western border.
Lithium Argentina AG., 2026 Cauchari-Olaroz S-K 1300 Technical Report Cauchari-Olaroz Salars, Argentina | Page 104 of 418 |
Figure 6.7 Facies Map of the Upper Cycle
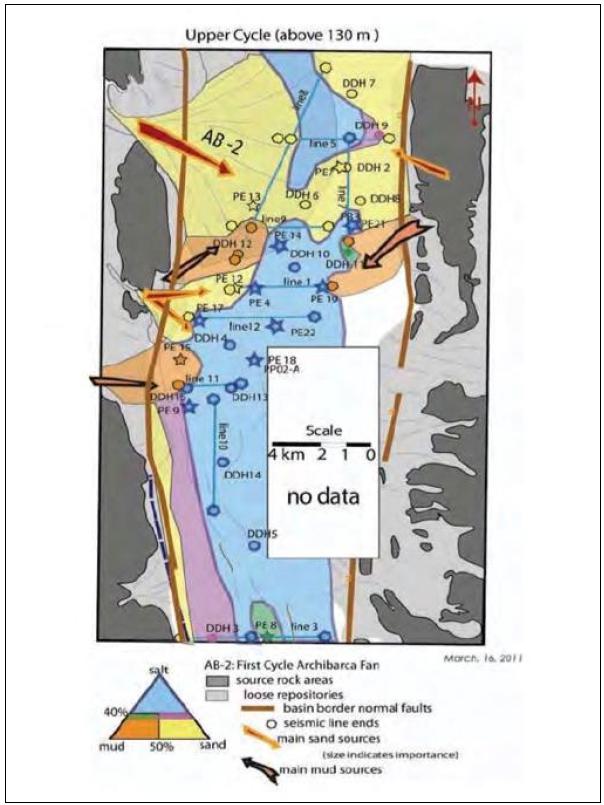
Source: Bossi, (2011)
Lithium Argentina AG., 2026 Cauchari-Olaroz S-K 1300 Technical Report Cauchari-Olaroz Salars, Argentina | Page 105 of 418 |
Figure 6.8 Salt Percent Isopleths of the Upper Cycle
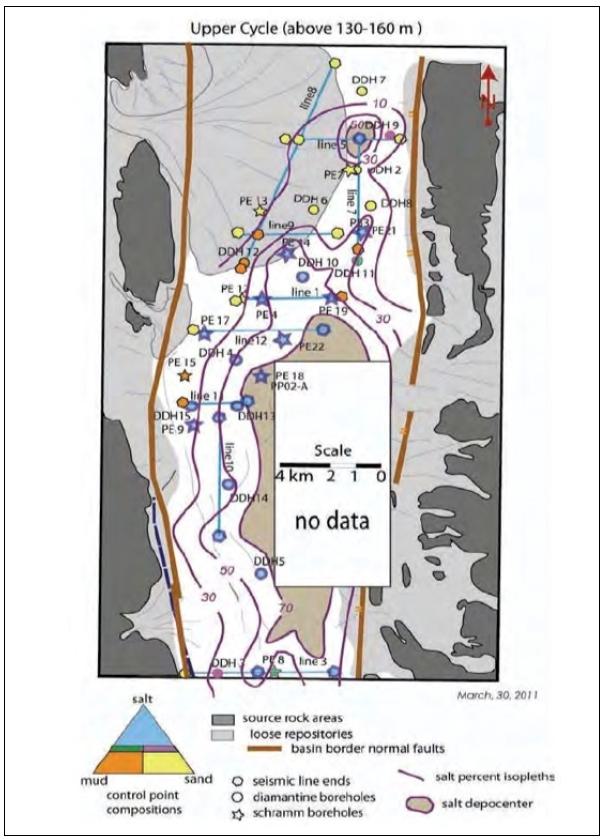
Source: Bossi, (2011)
Lithium Argentina AG., 2026 Cauchari-Olaroz S-K 1300 Technical Report Cauchari-Olaroz Salars, Argentina | Page 106 of 418 |
Figure 6.9 Isopleth Map of Sand Percents of the Upper Cycle Sedimentation Stage
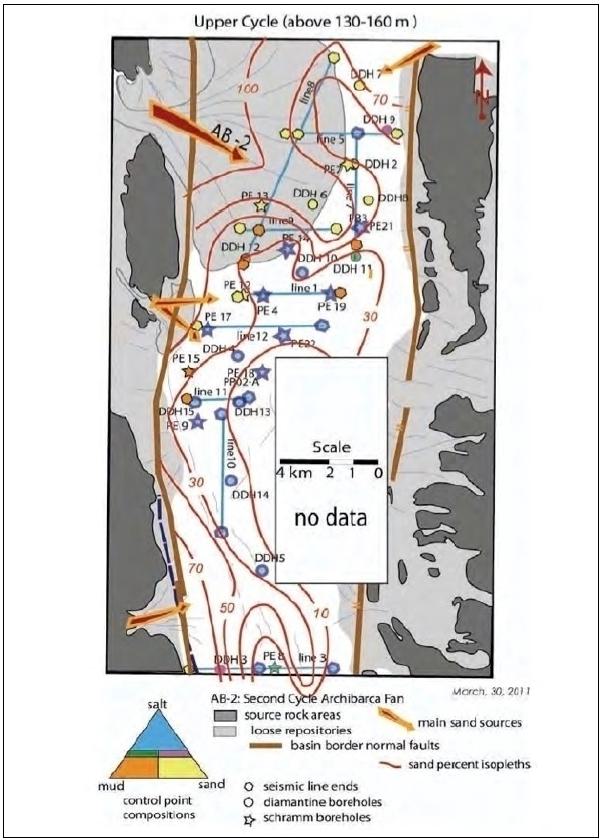
Source: Bossi, (2011)
Lithium Argentina AG., 2026 Cauchari-Olaroz S-K 1300 Technical Report Cauchari-Olaroz Salars, Argentina | Page 107 of 418 |
| 6.6 | Surface Water |
The Cauchari-Olaroz watershed is shown in Figure 6.10. The watershed is an elongated depression with a length of approximately 150 km in a north-south direction and a width of 30 to 40 km in an east-west direction and covering approximately 4,500 km2. The surface water network within the watershed eventually flows into the Olaroz or Cauchari Salars. There is no surface water outflow from the salars. These rivers are the main freshwater inflows into the salar and have been monitored since 2009.
The primary surface waterways within the watershed basin are Rios El Rosario, Ola, and Tocomar. Rio Rosario, which is locally called Rio El Toro, originates in the northern part of the watershed, at an elevation of 4,500 m. The river flows south-southeast for 55 km, past the village of El Toro, before it enters into the Olaroz Salar.
Rio Ola, which is locally called Rio Lama, originates just south of Cerro Bayo Archibarca, at an elevation of around 4,500 m, and flows east for 20 km. It enters the salars on top of the Archibarca Fan that separates Olaroz from Cauchari on the western flank of the basin.
Rio Tocomar, which is locally called Rio Olacapato, originates some 10 km west of Alto Chorillo at an elevation of around 4,360 m. The river flows west for approximately 30 km before it enters the Cauchari Salar from the southeast.
In addition to the surface waterways noted above which enter the salars, there is an area in the central southern part of the Cauchari Salar some 15 km north of the village of Cauchari, where surface water originates from an array of springs. Discharge from these springs is naturally channelled into a central stream that flows north for several kilometers and then gradually seeps back underground.
Chemistry and flow monitoring results from the Surface Water Sampling Program conducted throughout the Cauchari-Olaroz watershed are presented in Section 7.12.
Lithium Argentina AG., 2026 Cauchari-Olaroz S-K 1300 Technical Report Cauchari-Olaroz Salars, Argentina | Page 108 of 418 |
Figure 6.10 Caucharri-Olaroz Watershed
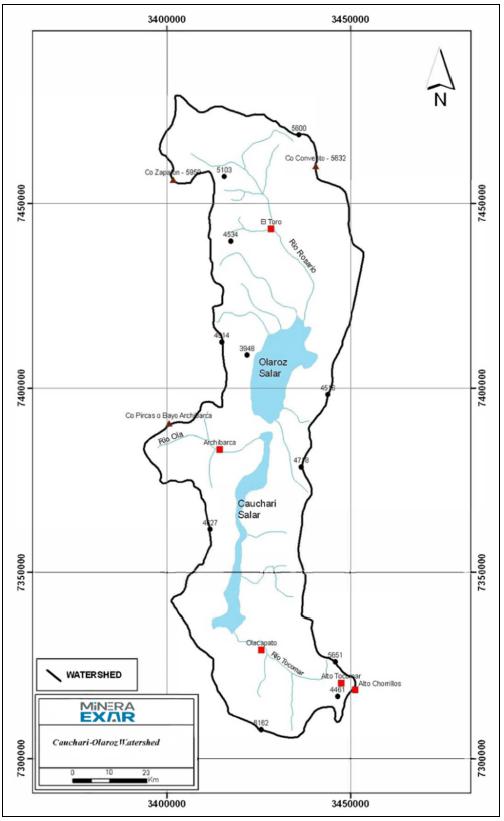
Note: black dot with a number beside it = meteorological station, red square = town.
Source: Burga et al. (2019)
Lithium Argentina AG., 2026 Cauchari-Olaroz S-K 1300 Technical Report Cauchari-Olaroz Salars, Argentina | Page 109 of 418 |
| 6.7 | Mineralization |
The brines from Cauchari are saturated in sodium chloride with total dissolved solids (TDS) on the order of 27% (324 to 335 g/L) and an average density of about 1.215 g/cm3. The other primary components of these brines are common to brines in other salars in Argentina, Bolivia, and Chile, and include potassium, lithium, magnesium, calcium, sulphate, HCO3, and boron as borates and free H3BO3.
A Janecke Projection comparing the chemistry of several brine deposits is shown in Figure 6.11. This type of figure can be used as a visualization tool for mineral crystallization. The diagram represents an aqueous five-component system (Na+, K+, Mg++, SO4=, and Cl–) saturated in sodium chloride. The aqueous system can be represented in this simplified manner, due to the higher content of the ions Cl–, SO4=, K+, Mg++, Na+ compared with other elements (e.g., Li, B, Ca). In Figure 6.11, each corner of the triangle represents one of three pure components (Mg, SO4 and K2), in mol%. The sides of the triangle represent sodium chloride-saturated solutions, with two reciprocal salt pairs (MgCl2 + Na2SO4), (Na2SO4+KCl) and a quaternary system with a common ion (MgCl2+KCl+NaCl).
The inner regions of the diagram show expected crystallization fields for minerals precipitating from the brine. Since the brines are saturated in NaCl, halite precipitates during evaporation in all the cases. In addition, the Cauchari brine is predicted to initially precipitate ternadite (Na2SO4). The brines of Guayatayoc, Silver Peak, Hombre Muerto, Olaroz, and Rincon would initially precipitate glaserite (K3Na(SO4)2). Atacama, Uyuni, and Salinas Grandes brines would initially precipitate silvite (KCl).
In addition to the primary minerals indicated in the diagram, a wide range of secondary salts may precipitate from these brines, depending on various factors including temperature and dissolved ions. The additional salts could include: astrakanite (Na2Mg(SO4)2·4H2O), schoenite (K2Mg(SO4)2·6H2O), leonite (K2Mg(SO4)2·4H2O), kainite (MgSO4·KCl·3H2O), carnalite (MgCl2·KCl·6H2O), epsomite (MgSO4·7H2O), and bischofite (MgCl2·6H2O).
Lithium Argentina AG., 2026 Cauchari-Olaroz S-K 1300 Technical Report Cauchari-Olaroz Salars, Argentina | Page 110 of 418 |
Figure 6.11 Janecke Classification of Brines
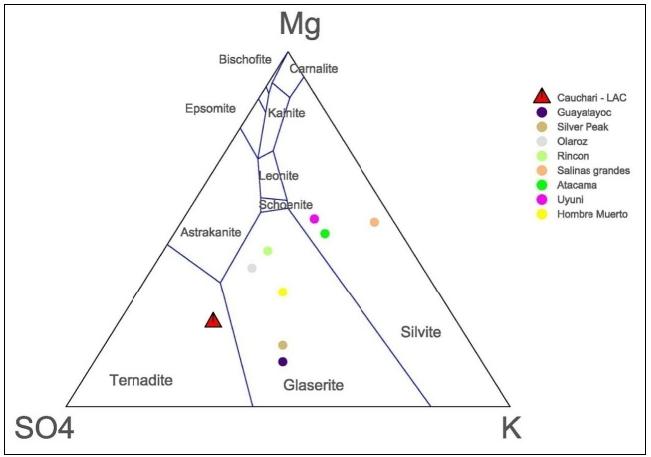
References as per Table 8.1, with the addition of information from Houston (2010b) for Salinas Grandes and Guayatayoc.
Source: King, Kelley, Abbey, (2012).
| 6.8 | Deposit Types |
The Cauchari and Olaroz Salars are classified as “Silver Peak, Nevada” type terrigenous salars. Silver Peak, Nevada in the USA was the first lithium-bearing brine deposit in the world to be exploited. These deposits are characterized by restricted basins within deep structural depressions in-filled with sediments differentiated as inter-bedded units of clays, salt (halite), sands and gravels. In the Cauchari and Olaroz Salars, lithium-bearing aquifers have developed during arid climatic periods as halite precipitation drove up Li concentration in residual brine. Within the basin, brines migrated to free and forced convection (Tyler et al., 2006) and because of the high density, brines tend to sink. As a result, the brine-bearing aquifers occur laterally and beneath halite bodies as a function of the permeability subsurface stratigraphy (Benson et al., 2026). On the surface, the salars are presently covered by carbonate, borax, sulphate, clay, and sodium chloride facies. A detailed description of the geology of the Olaroz and Cauchari Salars is provided in Section 6.0.
Cauchari and Olaroz have relatively high sulphate contents and therefore both salars can be further classified as “sulphate type brine deposits”. Section 7.16 provides detailed further discussion of the chemistry of Cauchari and Olaroz.
Lithium Argentina AG., 2026 Cauchari-Olaroz S-K 1300 Technical Report Cauchari-Olaroz Salars, Argentina | Page 111 of 418 |
Table 6.1 compares mean values for hydrochemical compositions of brines from Andean salt pans. It should be noted that the Qualified Person, Mr. David Burga, has been unable to verify the information for other properties listed in Table 6.1 and that the information is not necessarily indicative of the mineralization on the Property that is the subject of the Technical Report but is presented for reference purposes only.
Lithium Argentina AG., 2026 Cauchari-Olaroz S-K 1300 Technical Report Cauchari-Olaroz Salars, Argentina | Page 112 of 418 |
Table
6.1
Comparative Chemical Composition of Andean Salt Pans
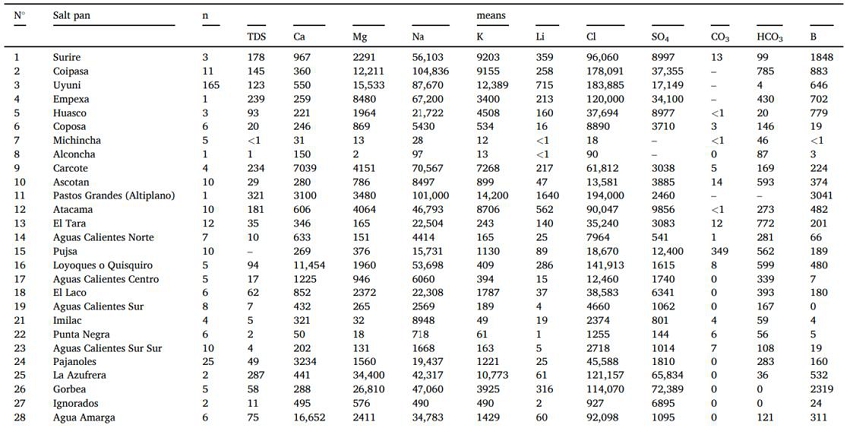
Lithium Argentina AG., 2026 Cauchari-Olaroz S-K 1300 Technical Report Cauchari-Olaroz Salars, Argentina | Page 113 of 418 |
Table
8.1
Comparative Chemical Composition of Andean Salt Pans
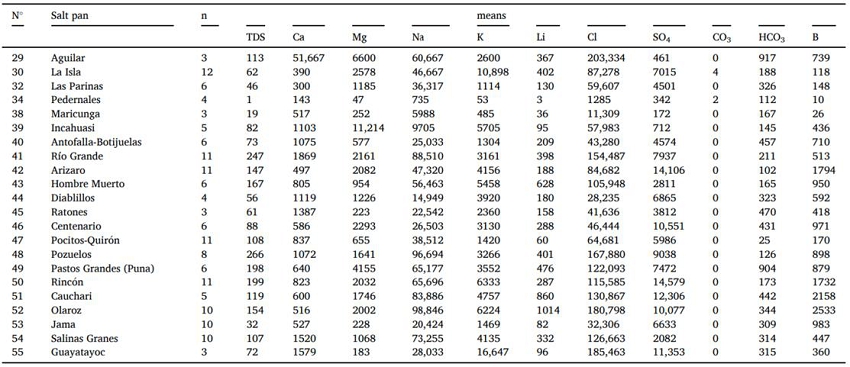
Notes:
| (A) | n = number of samples | |
| (B) | Total Dissolved Solids (TDS) is reported in g/L | |
| (C) | Remaining concentrations in mg/L |
Lithium Argentina AG., 2026 Cauchari-Olaroz S-K 1300 Technical Report Cauchari-Olaroz Salars, Argentina | Page 114 of 418 |
| 7.0 | Exploration |
The work described in this Section, other than the 2024 VES survey, was done for Exar and reported by LAR prior to the creation of LAR in 2023.
| 7.1 | Overview |
The following exploration programs have been conducted to evaluate the lithium brine and freshwater development potential of the Project area:
| · | Surface Brine Program – Brine samples were collected from shallow pits throughout the salars to obtain a preliminary indication of lithium occurrence and distribution. |
| · | Seismic Geophysical Program – Seismic surveying was conducted to support delineation of basin geometry, mapping of basin-fill sequences, and siting borehole locations. |
| · | Gravity Survey – A limited gravity test survey was completed to evaluate the utility of this method for determining depths to basement. |
| · | TEM Survey – TEM surveying was conducted to attempt to define freshwater / brine interfaces around the salar perimeter. This work was conducted by Quantec Geoscience. |
| · | VES Survey – A VES survey was conducted to attempt to define freshwater and brine interfaces, and extensive freshwater occurrences. |
| · | Surface Water Sampling Program – An ongoing program is conducted to monitor the flow and chemistry of surface water entering the salars. |
| · | Pumping Test Program – Pumping and monitoring wells were installed, and pumping tests were conducted at five locations, to estimate aquifer properties related to brine recovery and freshwater supply. |
| · | Reverse Circulation (RC) Borehole Program – Dual tube reverse circulation drilling was conducted to develop vertical profiles of brine chemistry at depth in the salars and to provide geological and hydrogeological data. |
| · | Diamond Drilling (DD) Borehole Program – This program was conducted to collect continuous cores for geotechnical testing (RBRC, grain size and density) and geological characterization. Some of the boreholes were completed as observation wells for future brine sampling and monitoring. |
Samples were representative and no known biases were introduced due to sampling procedures. Details of the drilling programs are discussed in Section 7.16.
| 7.2 | Surface Brine Program |
In 2009, a total of 55 surface brine samples were collected from shallow hand-dug test pits excavated throughout the Project area. Results from this early program indicated favourable potential for significant lithium grades at depth. Additional exploration work was initiated on the basis of these results. A full description of the Surface Brine Program is provided in the Inferred Mineral Resource Estimate Report for the Project (King, 2010a).
Lithium Argentina AG., 2026 Cauchari-Olaroz S-K 1300 Technical Report Cauchari-Olaroz Salars, Argentina | Page 115 of 418 |
| 7.3 | Seismic Geophysical Program |
A high-resolution seismic tomography survey was conducted primarily on the Cauchari Salar and to a lesser extent on the Olaroz Salar, during 2009 and 2010. The survey was contracted to Geophysical Exploration Consulting (GEC) of Mendoza, Argentina. Measurements were conducted along 12 survey lines, as shown in Figure 7.1. Nine lines are oriented east-west (1, 2, 3, 4, 5, 6, 9, 11, and 12), two lines (7 and 10) have a north-south orientation, and Line 8 is a northeast trending diagonal line parallel to the western property boundary and covering the Archibarca Fan. A total of 62,500 m of seismic survey data was acquired.
The survey configuration utilized a five-meter geophone separation, and a semi-logarithmic expanding drop-weight source array symmetrically bounding the central geophone array. The geophone array comprised 48 mobile measurement sites utilizing Geode Geoelectrics 8 Hz geophones. Symmetrically surrounding the 48 geophones were accelerated, 150 kg drop-weight sites moving away from the geophone array as follows: 15, 30, 60, 90, 120, 150, 250, 500, 750, and 900 m. Based on standard methods for depth resolution, the outer drop-weight positions would provide sufficient velocity detail to depths on the order of 500 to 600 m. The seismic survey data supported the identification of drilling sites for the RC and DD Programs in 2009 and into 2010. The seismic inversions are shown in Figure 7.2.
The maximum interpreted depth of the salars for each of the twelve seismic lines ranged from approximately 300 to 600 m. This variance in the apparent depth of the basin is attributed to two factors: 1) actual basin depth, and 2) property limitations which restricted the placement of the source hammer, and therefore the depth of exploration.
Lithium Argentina AG., 2026 Cauchari-Olaroz S-K 1300 Technical Report Cauchari-Olaroz Salars, Argentina | Page 116 of 418 |
Figure 7.1 Seismic Tomography Lines – 2009 and 2010
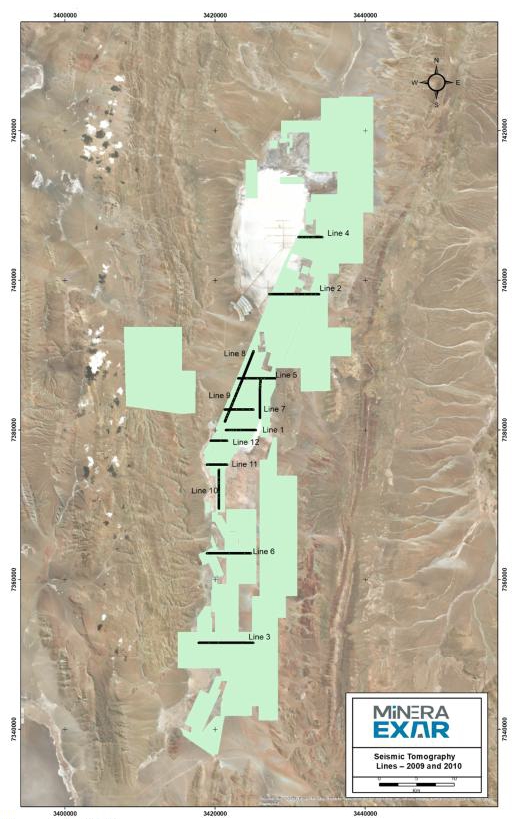
Source: Burga et al. (2020)
Lithium Argentina AG., 2026 Cauchari-Olaroz S-K 1300 Technical Report Cauchari-Olaroz Salars, Argentina | Page 117 of 418 |
Figure 7.2 Seismic Tomography Results for the 12 Survey Lines in Figure 7.1
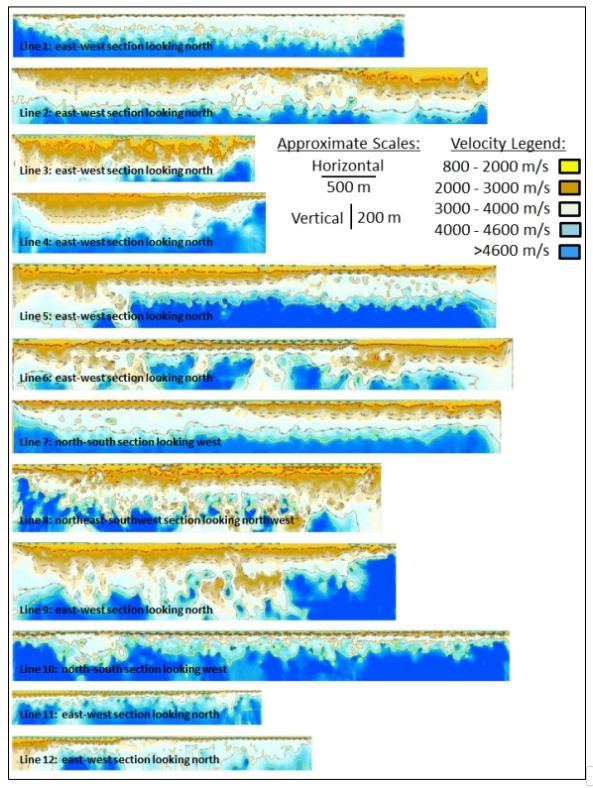
Source: King, Kelley, Abbey, (2012).
Lithium Argentina AG., 2026 Cauchari-Olaroz S-K 1300 Technical Report Cauchari-Olaroz Salars, Argentina | Page 118 of 418 |
| 7.4 | Gravity Survey |
A reconnaissance gravity survey was completed at the Cauchari Salar during July of 2010. The survey was a test to evaluate the effectiveness of the gravity method to define basement morphology and grabens that could represent favourable settling areas for dense brine. Data were collected at 200 m intervals along the two survey profiles shown in Figure 7.3. These profiles extended to outcrop locations outside the salar limits, to facilitate final gravity data processing and inversion.
Instrumentation used for the survey was a La Coste and Romberg #G-470 gravimeter with an accuracy of ± 0.01 mGal. The gravity survey field procedure included repetition of survey control points at intervals of less than five hours, to minimize instrument drift control errors. Initial gravity data processing was completed with Oasis software, using the Gravity and Terrain Correction module. Inversions were also produced with Oasis software, using the gravity module GM-SYS.
Differential GPS measurements provided the station control with an accuracy level of ± 1 cm. A GPS base station using a Trimble DGPS 5700 model was employed in two locations within five kilometers of the survey lines and operated continuously during the measurement of the survey GPS points along the gravity traverses. A Trimble model R3 was used for the gravity station placement.
Modelling results for the northeast oriented gravity survey line (GRAV 1) are shown in Figure 7.4. The image shows the location of boreholes, the input densities used for model generation, and the calculated Bouger results from the field data. The upper profiles indicate an excellent fit of observed and modeled data based on the coloured model shown in the lower part of the figure. The lower red portion is the modeled depth to basement, or denser lithologies, using the starting model densities and the observed field data. There is good correlation between the gravity and seismic results which indicate changes in density and velocity, respectively, at approximately 300 m depth. It is interpreted that this approximate depth represents an increase in compaction of the sand-salt mix encountered during drilling.
Modelling results for the north-south gravity profile (GRAV 2) across the southwest portion of the Mineral Resource Estimate zone are shown in Figure 7.5. Drilling results for DDH-4 show a change at 160 m depth to thick and dense halite with low porosity. This is marginally higher than the red area indicated by the gravity inversion modelling program. Similarly, for DDH-12, the intersection of the massive halite is slightly different from the model results but is within acceptable limits. Overall, an excellent fit is apparent between the observed and modeled data as seen in the profile on the upper section of the figure. This image demonstrates that the gravity method is effective for identifying relative density changes associated with different lithologies or increased compaction with depth in the salar.
Lithium Argentina AG., 2026 Cauchari-Olaroz S-K 1300 Technical Report Cauchari-Olaroz Salars, Argentina | Page 119 of 418 |
Figure 7.3 Location of Gravity Survey Lines at the Cauchari Salar
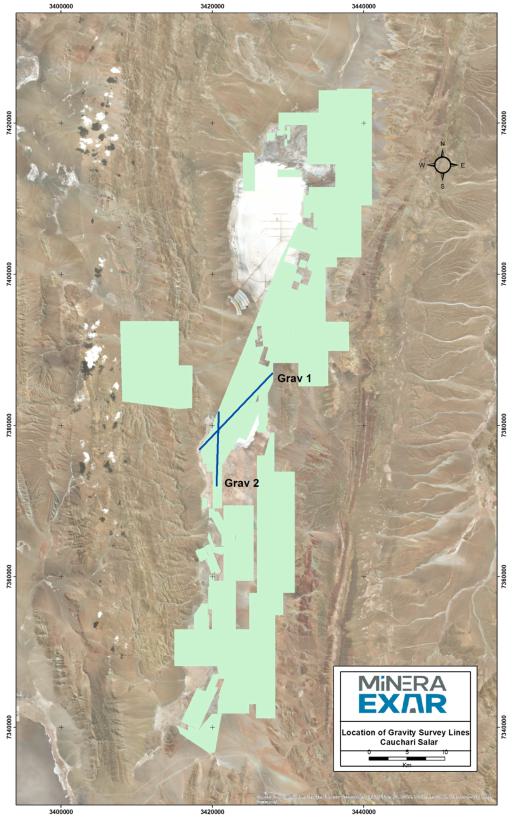
Source: Burga et al. (2020)
Lithium Argentina AG., 2026 Cauchari-Olaroz S-K 1300 Technical Report Cauchari-Olaroz Salars, Argentina | Page 120 of 418 |
Figure 7.4 Modeling Results for the Northeast Oriented Gravity Line (Grav 1) Over the Mineral Resource Estimate
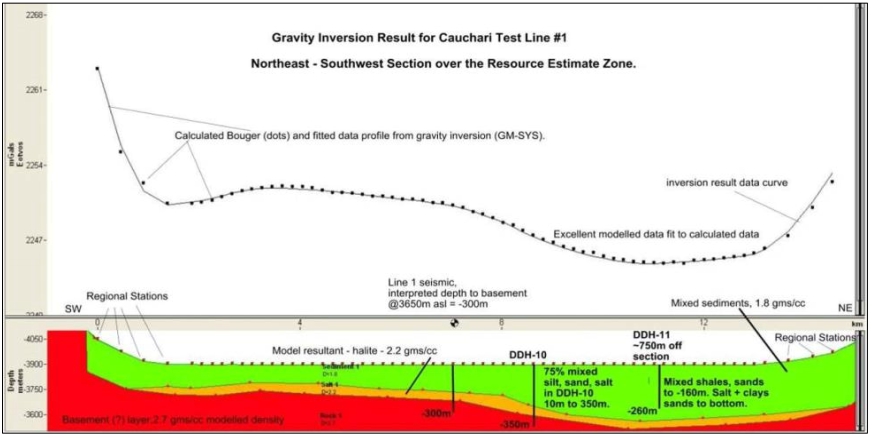
Source: King, Kelley, Abbey, (2012).
Lithium Argentina AG., 2026 Cauchari-Olaroz S-K 1300 Technical Report Cauchari-Olaroz Salars, Argentina | Page 121 of 418 |
Figure 7.5 Modeling Results for the North-South Gravity Line (Grav 2) Across the Southwest Portion of the Mineral Resource Estimate
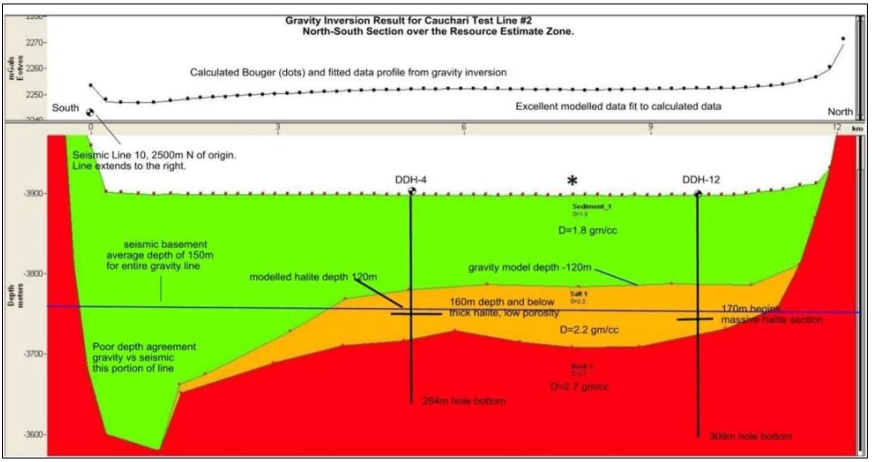
Source: King, Kelley, Abbey, (2012).
Lithium Argentina AG., 2026 Cauchari-Olaroz S-K 1300 Technical Report Cauchari-Olaroz Salars, Argentina | Page 122 of 418 |
| 7.5 | TEM Survey |
A Time Domain Electromagnetic (TEM) survey was conducted in the Cauchari Salar during July 2010, along the five TEM lines shown in Figure 7.6. The main objective of the survey was to test the applicability of this method for determining resistivity contrasts that may relate to changes in groundwater salinity. In general, it is expected that saline brines will be more conductive (lower resistivity), whereas areas of freshwater will be less conductive (higher resistivity). The TEM survey parameters included:
| · | The use of Zonge GDP-16 Rx and GGT-20 Tx instrumentation; |
| · | In-loop sounding configuration using 200 m ´ 200 m square transmitting loops and a base transmitting frequency of 4 Hz; |
| · | Soundings completed at 100 m station intervals from 45 ms to 48 ms; and |
| · | Completion of a total of 12.6 linear survey kilometers. |
Line TEM 1 (Figure 7.7) – Borehole logs and brine sampling results for PE-07 and DDH-02 indicate that the top of the brine aquifer is at approximately 40 m depth. This is reasonably consistent with the low resistivity values seen in the inversion at this location where the resistivity drops in the presence of brine. For DDH-09, there is sand present to approximately 60 m depth, followed by variable salt, silt, and sand past the bottom of the TEM inversion depth. The resistivity section is supported by the logging results. Notably on this TEM line is the area on the west (left) side of the image, which corresponds to a portion of the alluvial Archibarca Fan, where freshwater inflow occurs. The higher resistivity values in this area are consistent with the inflow of freshwater. The profile also shows two low resistivity anomalies that may be attributable to occurrence of brines at depth, possibly related to structures that intersect the TEM profile orthogonally at these locations.
Lithium Argentina AG., 2026 Cauchari-Olaroz S-K 1300 Technical Report Cauchari-Olaroz Salars, Argentina | Page 123 of 418 |
Figure 7.6 Location of TEM Sounding Profiles Conducted at the Cauchari Salar
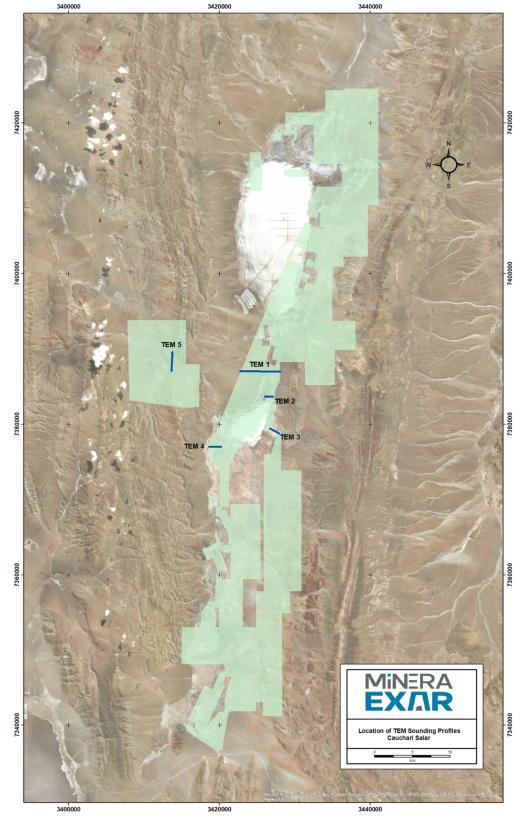
Source: Burga et al. (2019)
Lithium Argentina AG., 2026 Cauchari-Olaroz S-K 1300 Technical Report Cauchari-Olaroz Salars, Argentina | Page 124 of 418 |
Figure 7.7 2010 Survey Results for Line TEM 1
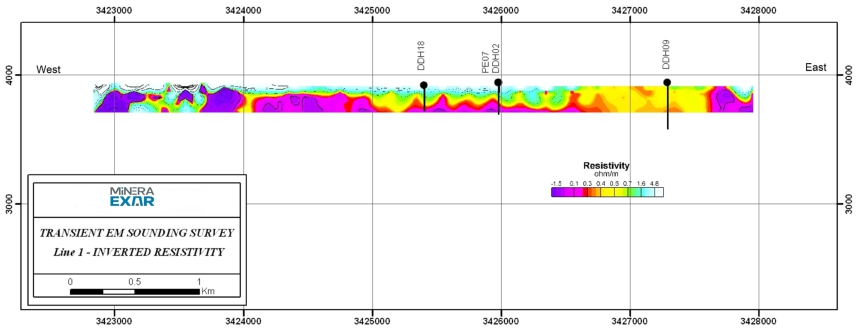
Source: Exar.
Line TEM 2 (Figure 7.8) – This TEM image shows a typical layered model in the vicinity of DDH-08 where sandy layers containing the brine resource are situated at 20 m depth. The deeper, low resistivity region associated with DDH-08 is associated with the sandy brine-containing layers continuing to depth. Further to the east (right) there is indication of another low resistivity, high conductivity source. The higher resistivity values in the center of the image may be associated with compacted halite, possibly related to a horst.
Lithium Argentina AG., 2026 Cauchari-Olaroz S-K 1300 Technical Report Cauchari-Olaroz Salars, Argentina | Page 125 of 418 |
Figure 7.8 2010 Survey Results for Line TEM 2
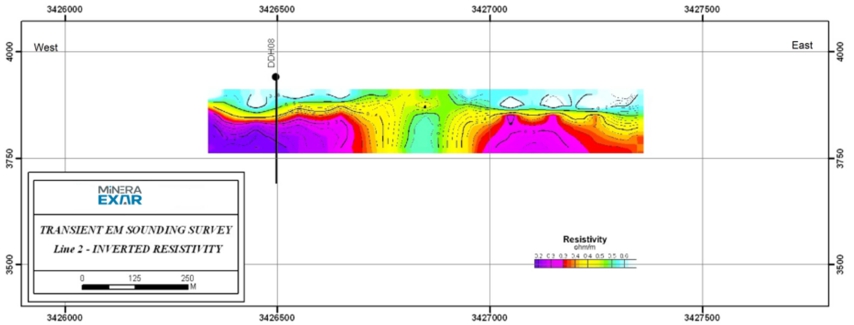
Source: Exar.
Line TEM 3 (Figure 7.9) – This northwest-southeast oriented line is situated in the eastern sector of the Cauchari Salar, where no drilling has occurred. It was selected to investigate the possibility of freshwater inflow and/or the presence of brine. The resistivity data suggest that both scenarios occur. Higher resistivity values are likely attributable to freshwater inflow from one of the alluvial fans in the area. The lower resistivity values may be related to brines, with typical resistivity values of < 1.0 ohm/m, associated with interpreted structural features within the basin.
Lithium Argentina AG., 2026 Cauchari-Olaroz S-K 1300 Technical Report Cauchari-Olaroz Salars, Argentina | Page 126 of 418 |
Figure 7.9 2010 Survey Results for Line TEM 3
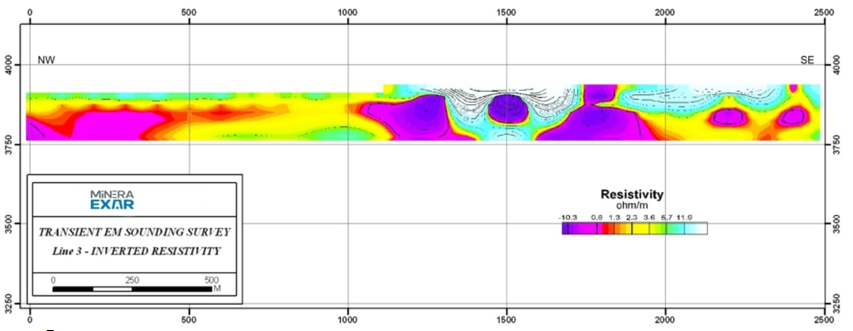
Source: Exar.
Line TEM 4 (Figure 7.10) – This line is situated along the western margin of the Cauchari Salar. PE-15 is cased from the surface to a depth of 65 m. Sampling results indicate the presence of a brine aquifer at the bottom of the casing. The resistivity values suggest continuity of the brine to surface. Below 65 m the lithology is characterized by high halite content. The resistivity values at this point are around 1 ohm/m, which is slightly more resistive than sandy brine responses, and consistent with high halite content. Further to the west (left) of the boreholes, a low resistivity zone may indicate brine in a structural feature along the margin of the salar. The higher resistivity at the left end of the section may indicate freshwater moving into the salar.
Lithium Argentina AG., 2026 Cauchari-Olaroz S-K 1300 Technical Report Cauchari-Olaroz Salars, Argentina | Page 127 of 418 |
Figure 7.10 2010 Survey Results for Line TEM 4
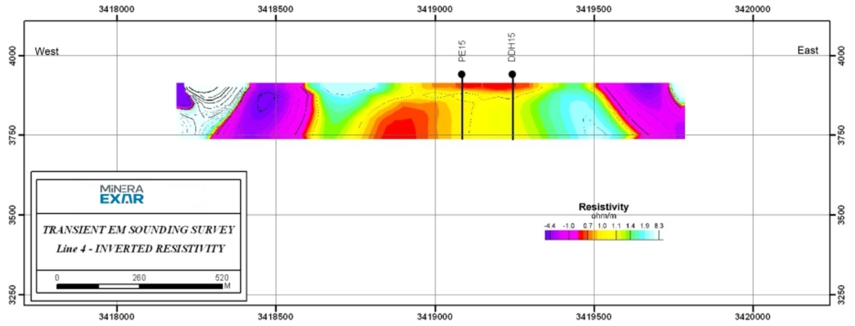
Source: Exar.
Line TEM 5 (Figure 7.11) – This line was located to investigate groundwater composition under the Archibarca Fan. The central portion of the inversion shows an area of higher resistivity extending from the surface to a depth of approximately 75 m. Laterally, this zone could approach one kilometer in width. The resistivity values decrease under this interpreted body of freshwater, but not to the degree that would indicate brine presence. They may represent either background resistivity, or the transition to more saline water at depth. Some of the resistivity zones on this TEM line are greater than 1,000 ohm/m, clearly indicating a highly resistive environment that is in contrast with the conductive brines of Cauchari. The higher resistivity values on the right side of the section may relate to the near-surface occurrence of bedrock.
Lithium Argentina AG., 2026 Cauchari-Olaroz S-K 1300 Technical Report Cauchari-Olaroz Salars, Argentina | Page 128 of 418 |
Figure 7.11 2010 Survey Results for Line TEM 5
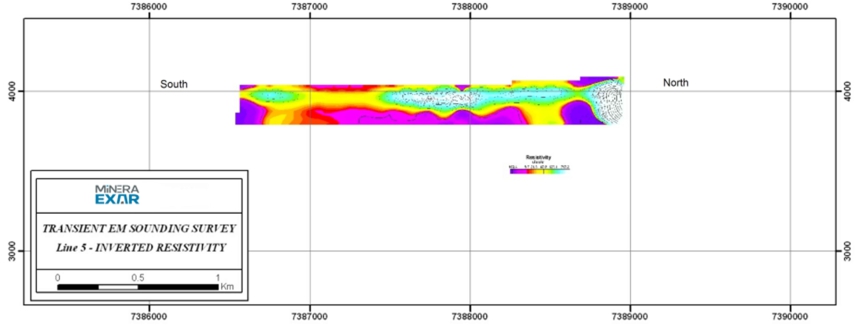
Source: Exar.
Lithium Argentina AG., 2026 Cauchari-Olaroz S-K 1300 Technical Report Cauchari-Olaroz Salars, Argentina | Page 129 of 418 |
In December 2017, another campaign was conducted in the Cauchari south and Olaroz Salar. There were three lines completed with a total of 98 TEM surveys, shown in Figure 7.12 to Figure 7.14.
The TEM survey successfully mapped the resistivity to different depths in the area of salt depending on the conductivity of the area considered. In more conductive areas, such as the profile 1, the signal penetrates only up to about 300 m depth, while, in the southern area of the Project, in profiles 2 and 3, models can be defined up to about 800 m or more.
Figure 7.12 2017 Survey Results for Line TEM 1
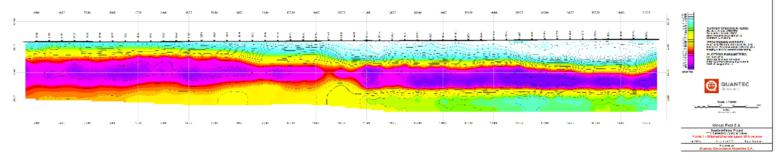
Source: Exar.
Figure 7.13 2017 Survey Results for Line TEM 2
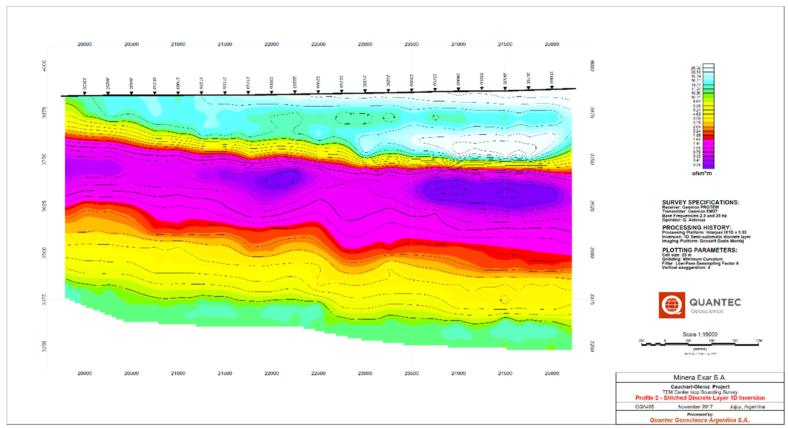
Source: Exar.
Lithium Argentina AG., 2026 Cauchari-Olaroz S-K 1300 Technical Report Cauchari-Olaroz Salars, Argentina | Page 130 of 418 |
Figure 7.14 2017 Survey Results for Line TEM 3
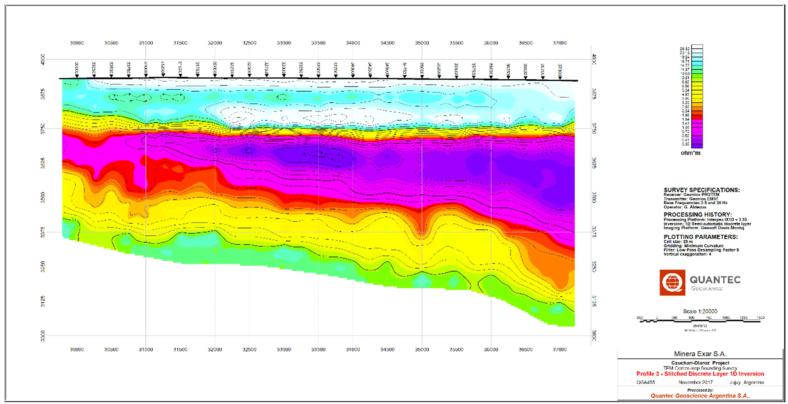
Source: Exar.
In conclusion, the TEM survey results indicate that the method can be used to determine resistivity contrasts within the salar. However, resolution may be limited to depths on the order of 75 m to 100 m, due to the broad presence of low resistivity materials, as indicated by ambient resistivity values of near sub-ohm/m in many areas of the salar.
| 7.6 | Vertical Electrical Sounding Survey (VES) |
A Vertical Electrical Sounding (VES) survey was conducted at perimeter locations on the Cauchari-Olaroz Salar, from November 2010 to May 2011. The extended survey period was due to recurring weather conditions that were unfavourable for surveying. The objectives of this program were to: 1) explore potential shallow freshwater sources on the Archibarca Fan, for future industrial purposes; and 2) evaluate salar boundary conditions related to the configuration of the brine/freshwater interface.
The survey was conducted using a 4-point light HP, which provides a simultaneous reading of intensity and potential that directly yields apparent resistivity. Data collected in the field were interpreted using RESIX 8.3 software, producing a graph of points representing the field measurements, and a solid line curve corresponding to the physical-mathematical model. Survey locations are shown on Figure 7.15.
Lithium Argentina AG., 2026 Cauchari-Olaroz S-K 1300 Technical Report Cauchari-Olaroz Salars, Argentina | Page 131 of 418 |
Figure 7.15 2010-2011 Map of VES Survey Area
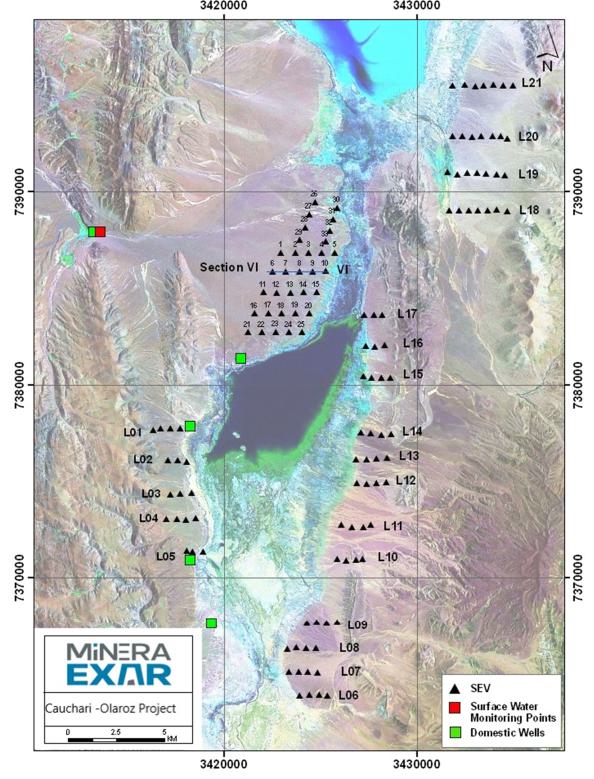
Source: Burga et al. (2019)
Lithium Argentina AG., 2026 Cauchari-Olaroz S-K 1300 Technical Report Cauchari-Olaroz Salars, Argentina | Page 132 of 418 |
The VES results enable the differentiation of the following five zones on the Archibarca Fan and the salar perimeter locations, as shown in Figure 7.16 through to Figure 7.19:
| · | An upper unsaturated layer, with relatively high resistance; |
| · | An upper saturated aquifer containing freshwater; |
| · | A lower conductive layer, interpreted as containing brine; |
| · | An interface or mixed zone, grading from freshwater to brine; and |
| · | A lower resistive zone, only detected in three VES lines and in which the degree of saturation and water salinity is unknown. |
The first three of these were encountered on most lines and are interpreted to be relatively continuous on the Archibarca Fan and the salar perimeter. The latter two were discontinuous. On the Archibarca Fan, the VES results indicate the occurrence of freshwater to an average depth of 50 m below surface. Below the freshwater layer, a gradational interface often occurs between shallow freshwater and deeper brine, from approximately 20 to 70 m depth.
The upper zone, interpreted as freshwater, is present throughout the investigated area of the fan and has potentially favourable characteristics for water supply. This zone is a target for expansion of the freshwater supply at PB-I (Section 7.14). The occurrence of freshwater on the Archibarca Fan indicates with the inflow of freshwater into the shallow sandy fan sediments from upgradient areas. The VES results are consistent with existing drilling results and are useful for evaluating the potential thickness of the freshwater wedge.
Additional potential zones of freshwater were also identified on other smaller alluvial fans and also other non-fan perimeter locations (e.g., Figure 7.16, Figure 7.17, Figure 7.18 and Figure 7.19). The water supply potential of these additional zones appears to be lower than that of the Archibarca, due to more limited lateral and/or vertical extent of the interpreted freshwater zone. Nevertheless, these occurrences may yield useful quantities of freshwater, and would be worthwhile to evaluate further, depending on final water supply results from the Archibarca Fan.
The VES results are also useful for general delineation of the freshwater/brine interface on the salar boundary. They were used to identify follow-up sampling locations at perimeter drilling and test pitting locations (see Section 7.11). Subsequently, the VES results and the follow-up sampling were used to define grade boundary conditions along the salar perimeter.
Lithium Argentina AG., 2026 Cauchari-Olaroz S-K 1300 Technical Report Cauchari-Olaroz Salars, Argentina | Page 133 of 418 |
Figure 7.16 2010-2011 VES Survey Interpretation on the Archibarca Fan, Along Line VI
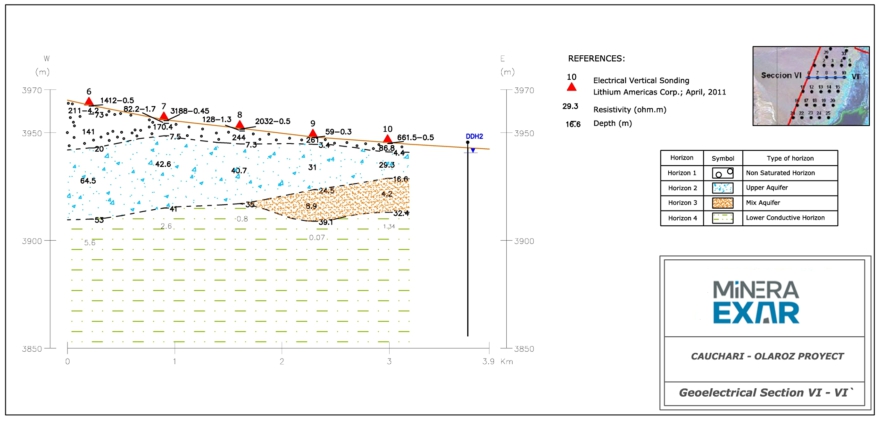
Source: Exar.
Lithium Argentina AG., 2026 Cauchari-Olaroz S-K 1300 Technical Report Cauchari-Olaroz Salars, Argentina | Page 134 of 418 |
Figure 7.17 2010-2011 VES Survey Interpretation Along Line 2
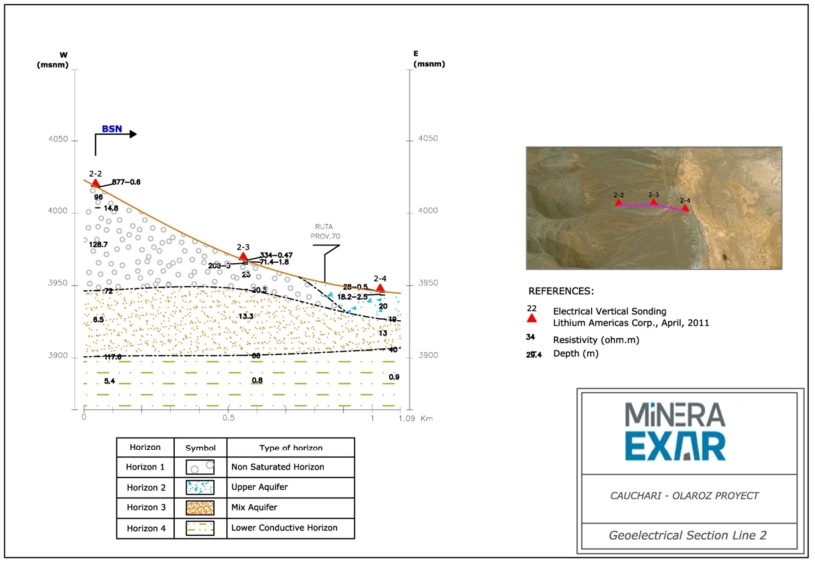
Source: Exar.
Lithium Argentina AG., 2026 Cauchari-Olaroz S-K 1300 Technical Report Cauchari-Olaroz Salars, Argentina | Page 135 of 418 |
Figure 7.18 2010-2011 VES Survey Interpretation Along Line 8
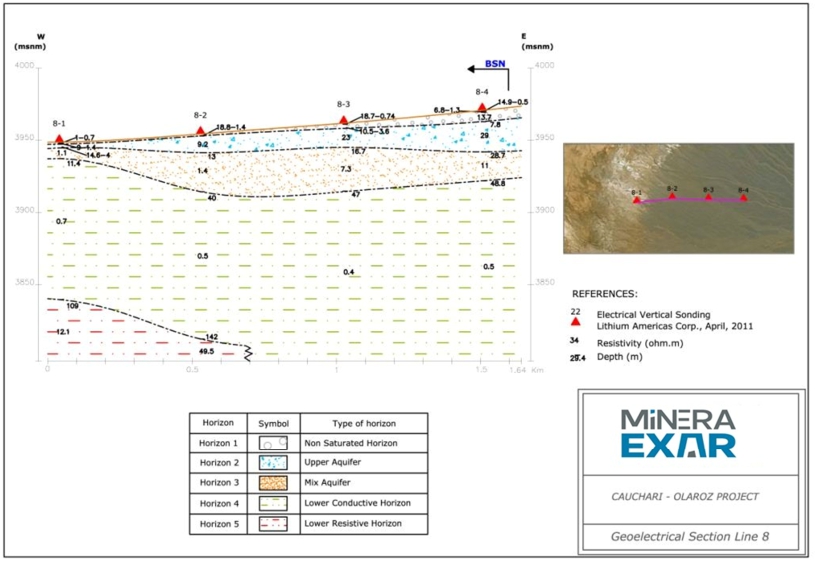
Source: Exar.
Lithium Argentina AG., 2026 Cauchari-Olaroz S-K 1300 Technical Report Cauchari-Olaroz Salars, Argentina | Page 136 of 418 |
Figure 7.19 2010-2011 VES Survey Interpretation Along Line 20
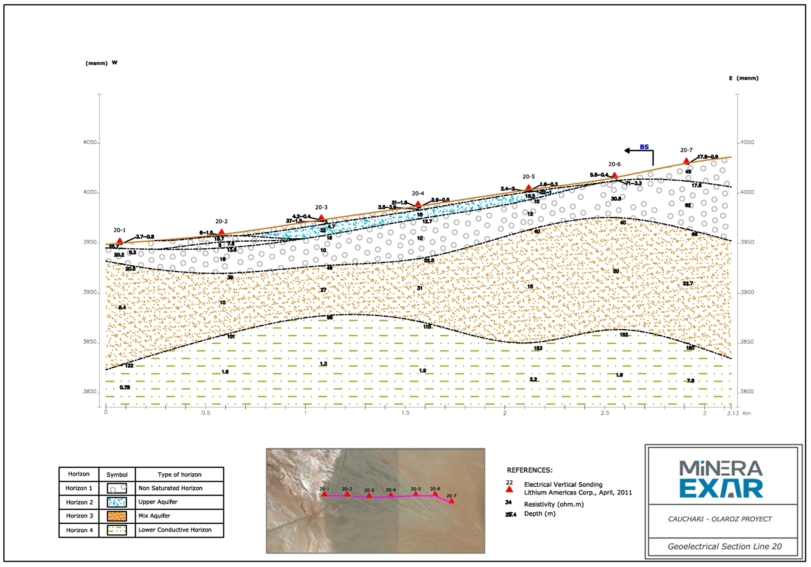
Source: Exar.
Lithium Argentina AG., 2026 Cauchari-Olaroz S-K 1300 Technical Report Cauchari-Olaroz Salars, Argentina | Page 137 of 418 |
| 7.7 | 2019 Vertical Electrical Sounding Survey (VES) |
In 2019, Geoelectric prospecting hydrogeological in Cauchari salar. In the study area, 42 Vertical Electrical Surveys were carried out. The objectives of this program were to: 1) explore potential shallow freshwater sources on the basin edges, for future industrial purposes; and 2) evaluate salar boundary conditions related to the configuration of the brine/freshwater interface. The survey lines and results are presented in Figure 7.20 to Figure 7.31.
Figure 7.20 2019 VES Survey Area
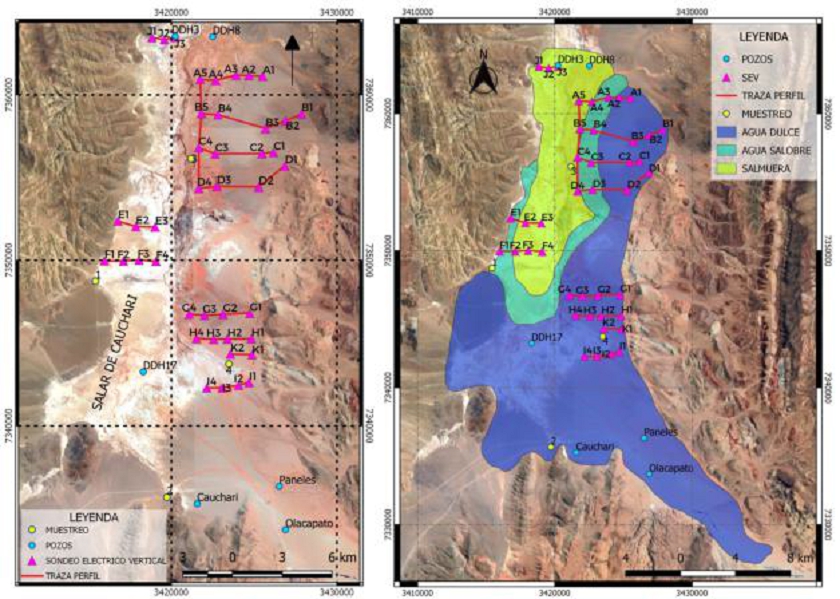
Source: Exar (2024)
Lithium Argentina AG., 2026 Cauchari-Olaroz S-K 1300 Technical Report Cauchari-Olaroz Salars, Argentina | Page 138 of 418 |
Figure 7.21 2019 VES Survey Interpretation Along Line A
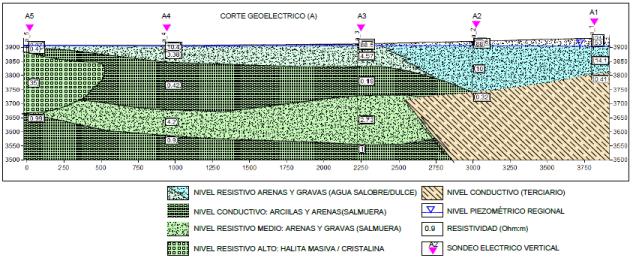
Source: Exar
Figure 7.22 2019 VES Survey Interpretation Along Line B
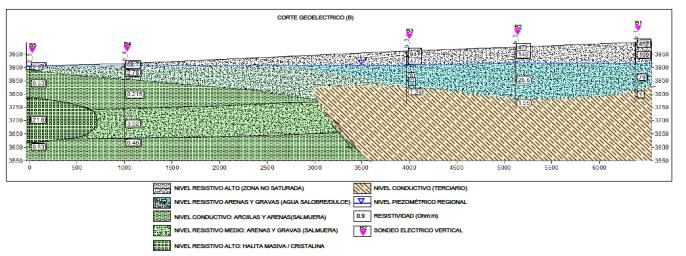
Source: Exar
Figure 7.23 2019 VES Survey Interpretation Along Line C
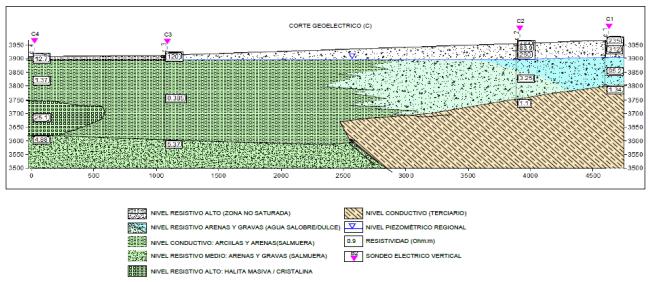
Source: Exar
Lithium Argentina AG., 2026 Cauchari-Olaroz S-K 1300 Technical Report Cauchari-Olaroz Salars, Argentina | Page 139 of 418 |
Figure 7.24 2019 VES Survey Interpretation Along Line D
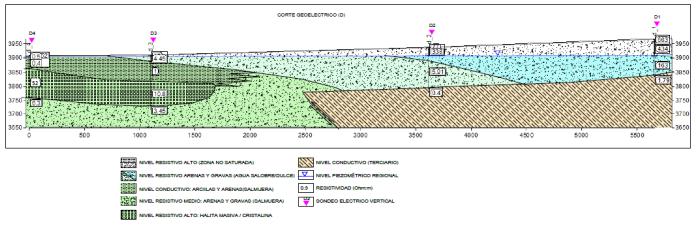
Source: Exar
Figure 7.25 2019 VES Survey Interpretation Along Line E
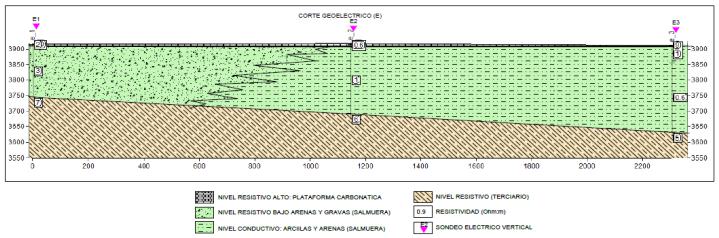
Source: Exar
Figure 7.26 2019 VES Survey Interpretation Along Line F
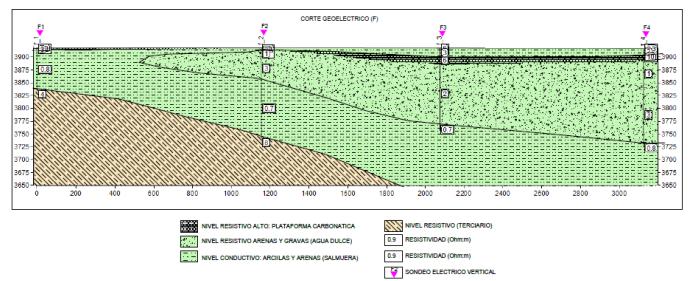
Source: Exar
Lithium Argentina AG., 2026 Cauchari-Olaroz S-K 1300 Technical Report Cauchari-Olaroz Salars, Argentina | Page 140 of 418 |
Figure 7.27 2019 VES Survey Interpretation Along Line G
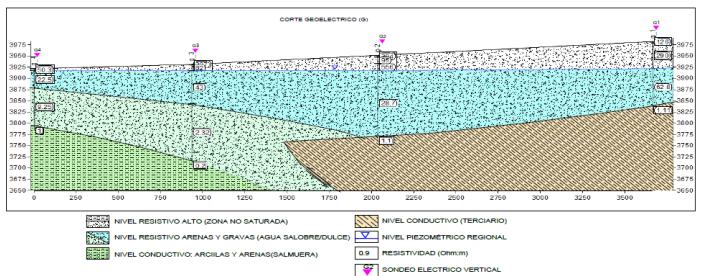
Source: Exar
Figure 7.28 2019 VES Survey Interpretation Along Line H
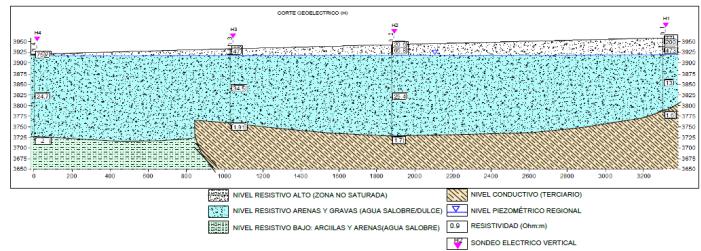
Source: Exar
Figure 7.29 2019 VES Survey Interpretation Along Line I
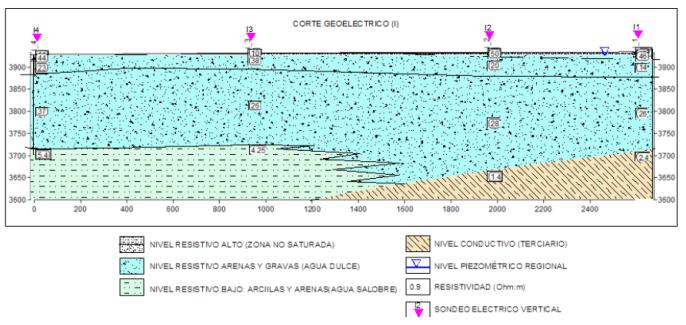
Source: Exar
Lithium Argentina AG., 2026 Cauchari-Olaroz S-K 1300 Technical Report Cauchari-Olaroz Salars, Argentina | Page 141 of 418 |
Figure 7.30 2019 VES Survey Interpretation Along Line J
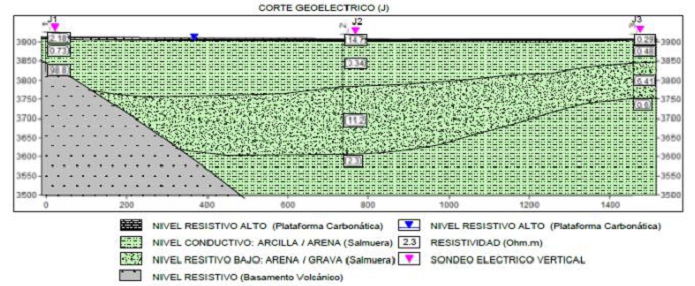
Source: Exar
Figure 7.31 2019 VES Survey Interpretation Along Line K
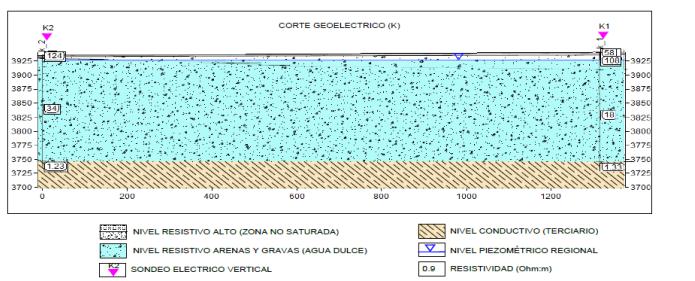
Source: Exar
| 7.8 | 2020 Vertical Electrical Sounding Survey (VES) |
During 2020, Geoelectric hydrogeological prospecting was conducted in the Rosario River, alluvial fan, Salar de Olaroz. The study was carried out with the objective of identifying, based on geophysics, the different sedimentological units and especially the units that can behave as freshwater aquifers for industrial use. In the study area, 20 (twenty) Vertical Electrical Surveys were carried out. The survey lines and results are presented in Figure 7.32 to Figure 7.39.
Lithium Argentina AG., 2026 Cauchari-Olaroz S-K 1300 Technical Report Cauchari-Olaroz Salars, Argentina | Page 142 of 418 |
Figure 7.32 2020 VES Survey Area
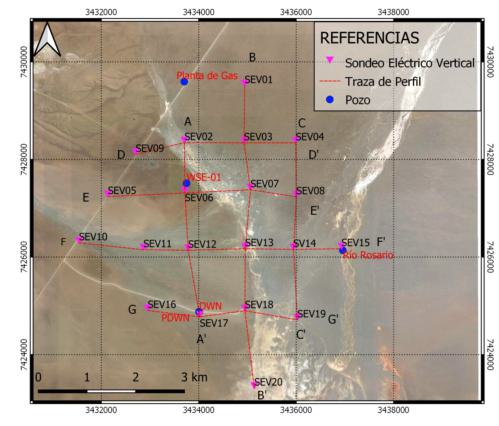
Source: Exar (2024)
Figure 7.33 2020 VES Survey Interpretation Along Line A-A’
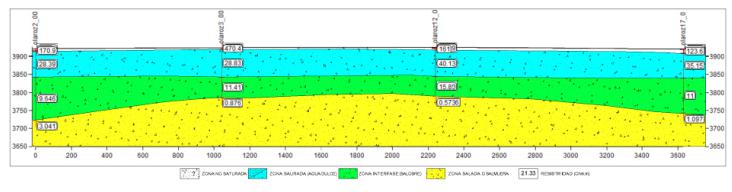
Source: Exar
Figure 7.34 2020 VES Survey Interpretation Along Line B-B’
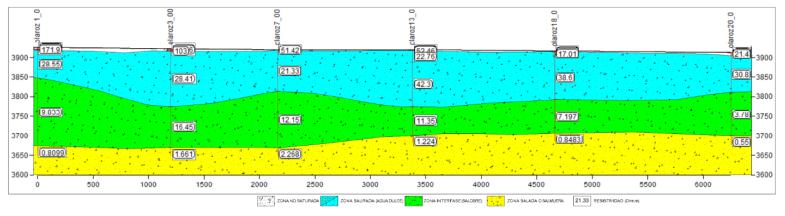
Source: Exar
Lithium Argentina AG., 2026 Cauchari-Olaroz S-K 1300 Technical Report Cauchari-Olaroz Salars, Argentina | Page 143 of 418 |
Figure 7.35 2020 VES Survey Interpretation Along Line C-C’
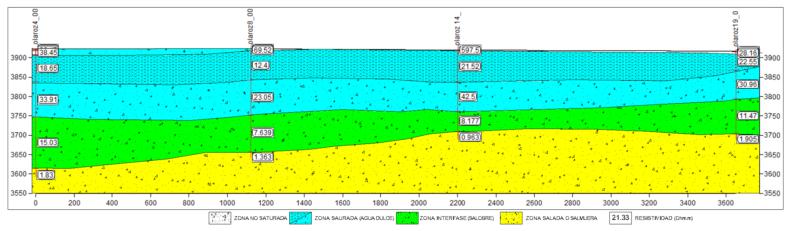
Source: Exar
Figure 7.36 2020 VES Survey Interpretation Along Line D-D’
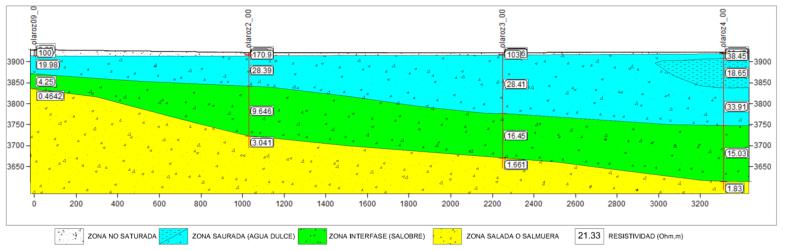
Source: Exar
Figure 7.37 2020 VES Survey Interpretation Along Line E-E’
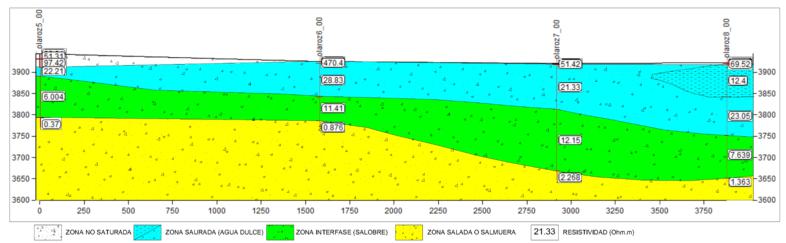
Source: Exar
Lithium Argentina AG., 2026 Cauchari-Olaroz S-K 1300 Technical Report Cauchari-Olaroz Salars, Argentina | Page 144 of 418 |
Figure 7.38 2020 VES Survey Interpretation Along Line F-F’
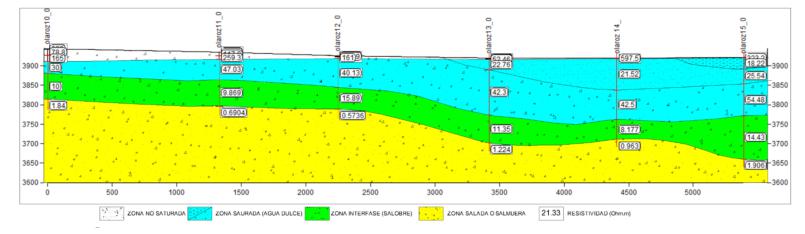
Source: Exar
Figure 7.39 2020 VES Survey Interpretation Along Line G-G’
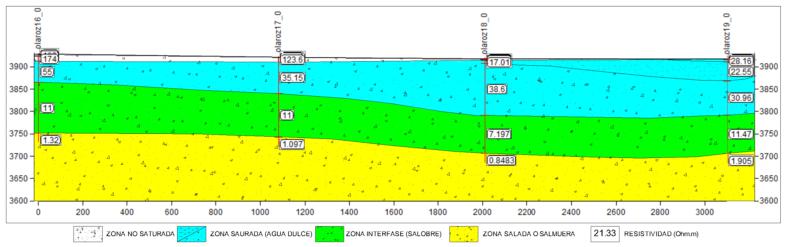
Source: Exar
Lithium Argentina AG., 2026 Cauchari-Olaroz S-K 1300 Technical Report Cauchari-Olaroz Salars, Argentina | Page 145 of 418 |
| 7.9 | 2021 Vertical Electrical Sounding Survey (VES) |
In 2021, a new geolectric campaign was carried out. Geoelectric hydrogeological prospecting in mina Irene, Salar de Olaroz. The objective was to identify, based on geophysics, the different sedimentological units and especially the units that can behave as aquifers with different characteristics, such as freshwater, brackish water or brine. In the study area, 6 (six) Vertical Electrical Surveys were carried out. The survey lines and results are presented in Figure 7.40 to Figure 7.42.
Figure 7.40 2021 VES Survey Area
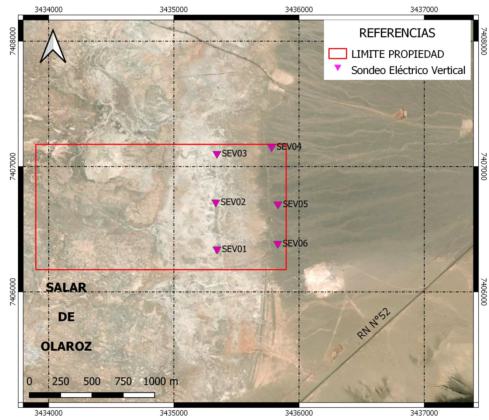
Source: Exar (2024)
Figure 7.41 2021 VES Survey Interpretation Along Line A
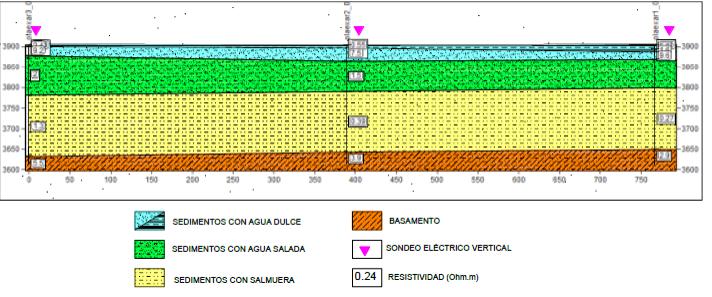
Source: Exar
Lithium Argentina AG., 2026 Cauchari-Olaroz S-K 1300 Technical Report Cauchari-Olaroz Salars, Argentina | Page 146 of 418 |
Figure 7.42 2021 VES Survey Interpretation Along Line B
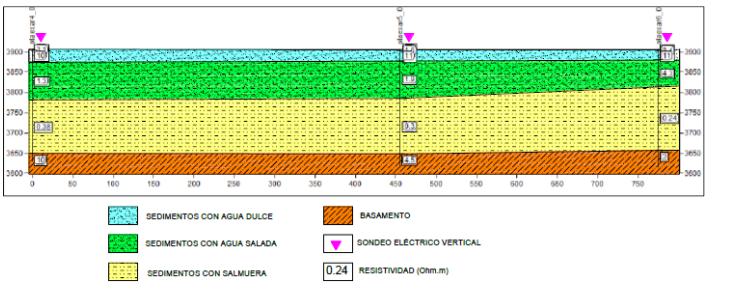
Source: Exar
| 7.10 | 2024 Vertical Electrical Sounding Survey (VES) |
Finaly in 2024, a new geophysics study was made, the objective of the study was the characterization of the sedimentological units through geophysical techniques, with a special focus on the identification of those with the potential to act as aquifers for industrial water use, in order to adjust a potential drilling target, in the Salar of Cauchari, geoelectric prospecting hydrogeological, southeast sector, Salar Cauchari
In the study area, 9 Vertical Electrical Surveys were carried out. The survey lines and results are presented in Figure 7.43 and Figure 7.44.
Lithium Argentina AG., 2026 Cauchari-Olaroz S-K 1300 Technical Report Cauchari-Olaroz Salars, Argentina | Page 147 of 418 |
Figure 7.43 2024 VES Survey Area
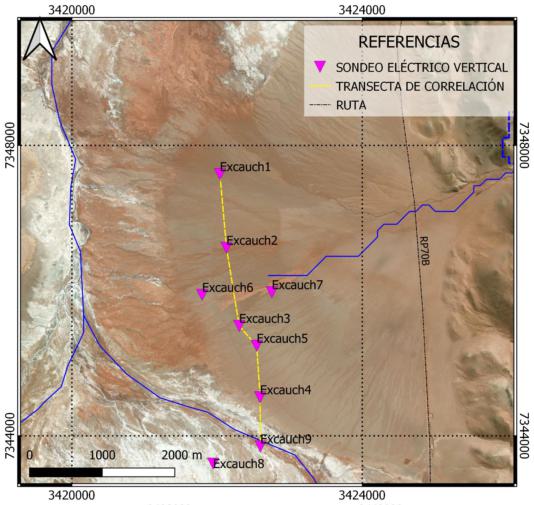
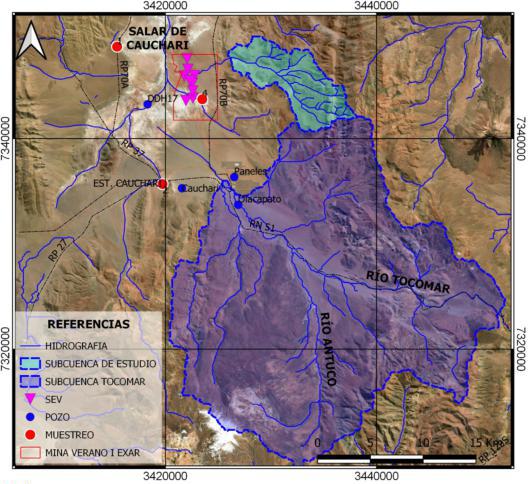
Source: Exar (2024)
Lithium Argentina AG., 2026 Cauchari-Olaroz S-K 1300 Technical Report Cauchari-Olaroz Salars, Argentina | Page 148 of 418 |
This study recommends carrying out exploratory drilling in the southern sector of the alluvial fan, in the vicinity of the Excauch4, Excauch5, Excauch8, Excauch9 and Excauch4 boreholes, where the greatest thicknesses of the zone saturated with freshwater were interpreted.
Figure 7.44 2024 VES Survey Interpretation
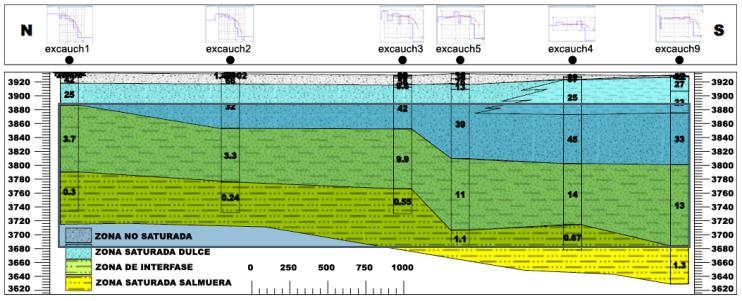
Source: Exar
| 7.11 | Boundary Investigation |
The Boundary Investigation was conducted to further assess the configuration of the freshwater/brine interface, at the salar surface and at depth, at selected locations on the salar perimeter. Data from this program were interpreted in conjunction with the VES survey (described in the previous section). Information from these two programs supported the extension of the hydrostratigraphic model and the lithium grade interpolation to the outer boundaries of the salar, and the evaluation of numerical model boundary conditions for lithium (Section 12.0).
Test pits and monitoring wells advanced for the Boundary Investigation are shown in Figure 7.45, and were advanced in two successive steps. In the first step, test pits were excavated along lateral transects at salar boundary locations (T3 through T6) or on the edge of the Archibarca Fan (T1 and T2). The purpose of the test pits was to identify the shallow transition zone from brine to freshwater. Test pits were excavated until water was reached, and water samples were collected from the bottom of the pits.
Water samples were sent to Alex Stewart Laboratory for major ion analysis. Field parameters, including conductivity, density, and temperature, were also measured and were used for assessing if the transition zone was captured by the transect in real time. For the salar perimeter transects, the capability to fully capture the transition zone was limited by the edge of the Exar claim boundary (T3, T4, and T5) or by difficult access conditions (T6). A summary of test pit transect data for Total Dissolved Solids (TDS) and lithium is provided in Table 7.1.
Lithium Argentina AG., 2026 Cauchari-Olaroz S-K 1300 Technical Report Cauchari-Olaroz Salars, Argentina | Page 149 of 418 |
Figure 7.45 Boundary Investigation Map Showing Test Pit Transects and Multi-level Monitoring Well Nests
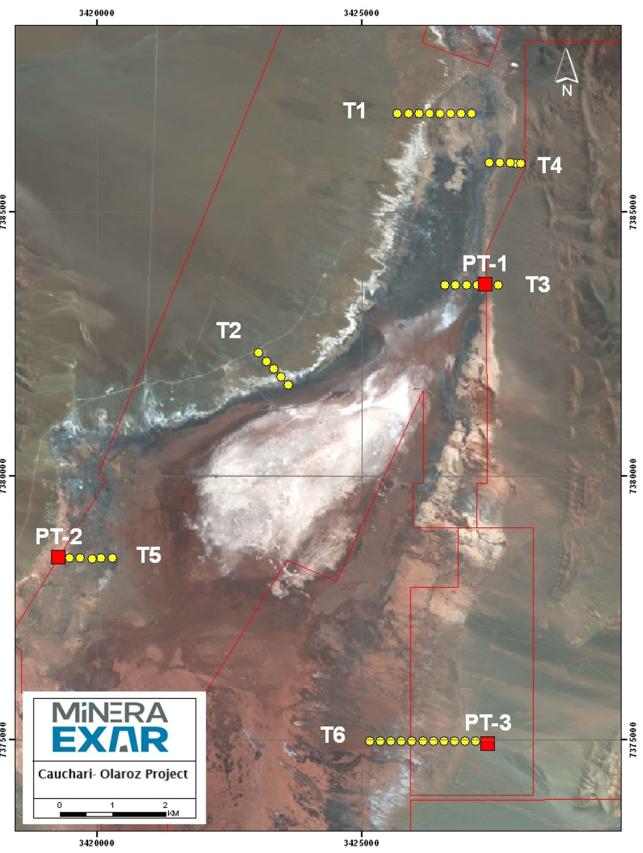
Source: Burga et al. (2020)
Lithium Argentina AG., 2026 Cauchari-Olaroz S-K 1300 Technical Report Cauchari-Olaroz Salars, Argentina | Page 150 of 418 |
| Table 7.1 Test Pit Transect Results for TDS and Lithium | |||||
|
Transect Test Pit |
TDS (mg/L) |
Lithium (mg/L) |
Transect Test Pit |
TDS (mg/L) |
Lithium (mg/L) |
| T1-1 | 1,120 | ND | T4-3 | 23,260 | 33 |
| T1-2 | 1,420 | ND | T4-4 | 110,980 | 175 |
| T1-3 | 720 | ND | T4-5 | 215,740 | 402 |
| T1-4 | 64,860 | 112 | T5-1 | 12,560 | 18 |
| T1-5 | 114,740 | 194 | T5-2 | 30,220 | 52 |
| T1-6 | 175,340 | 328 | T5-3 | 106,080 | 240 |
| T1-7 | 256,540 | 631 | T5-4 | 128,500 | 261 |
| T1-8 | 182,680 | 327 | T5-5 | 227,200 | 442 |
| T2-1 | 1,100 | ND | T5-6 | 292,580 | 619 |
| T2-2 | 3,640 | ND | T6-1 | No water | |
| T2-3 | 2,780 | ND | T6-2 | 4,200 | ND |
| T2-4 | 2,300 | ND | T6-3 | 6,280 | ND |
| T2-5 | 59,500 | 101 | T6-4 | 7,580 | ND |
| T3-1 | No water | T6-5 | 21,640 | 25 | |
| T3-2 | 33,300 | 45 | T6-6 | 26,860 | 29 |
| T3-3 | 84,260 | 140 | T6-7 | 26,980 | 34 |
| T3-4 | 207,920 | 301 | T6-8 | 22,460 | 26 |
| T3-5 | 251,160 | 362 | T6-9 | 22,200 | 26 |
| T3-6 | 237,180 | 472 | T6-10 | 26,000 | 35 |
| T4-1 | No water | T6-11 | No water | ||
| T4-2 | No water | ND – below detection limit. | |||
The goal of the second step of the investigation was to install multi-level monitoring well nests at the locations identified as central to the freshwater/brine transition zone. In execution, the nests could not be installed directly on the shallow transition zones, due to access restrictions. Well nests were installed on three of the test pit transects and, within each nest the wells were screened at different levels, to enable an evaluation of depth trends in brine strength and lithium grade. Drilling was completed by Andina Perforaciones SRL using rotary methods. A summary of well specifications and sampling results for TDS and lithium is provided in Table 7.2.
Lithium Argentina AG., 2026 Cauchari-Olaroz S-K 1300 Technical Report Cauchari-Olaroz Salars, Argentina | Page 151 of 418 |
| Table 7.2 Test Pit Transect Results for TDS and Lithium with Depths | |||||
| Drill Hole ID |
Depth of Screened Interval (m) |
Casing Diameter (in) |
Lithology of Screened Interval |
TDS1 (mg/L) |
Lithium1 (mg/L) |
| PT1 | 59.0–63.0 | 4.0 | Medium to fine sand |
265,380 263,120 267,920 |
559 541 545 |
| PT1A | 39.5–43.5 | 4.0 | Sand and Gravel |
243,520 243,140 246,260 |
471 464 457 |
| PT2 | 39.0–49.0 | 4.5 | Medium to fine sand |
190,120 190,640 189,520 |
372 365 365 |
| PT2A | 21.5–29.5 | 4.5 | fine gravel sandy clay matrix |
119,280 128,040 123,400 |
230 250 237 |
| PT2B | 11.5–15.5 | 4.0 | fine gravel sandy clay matrix |
39,160 39,100 46,040 |
76 76 87 |
| PT2C | 3.5–5.5 | 4.0 | clay |
99,600 55,540 |
197 111 |
| PT3 | 47.5–77.5 | 2.0 | Inter-bedded sand and clay |
19,940 18,920 |
38 36 |
| PT3 2” | 11.5–33.5 | 4.5 | Coarse sand and gravel | 18,700 | 35 |
| PT3 4” | Dry well | ||||
| (1) | Triplicate, duplicate or single samples were collected. |
| 7.12 | Surface Water Monitoring Program |
A Surface Water Monitoring Program was initiated in early 2010 to record the flow and chemistry of surface water in the vicinity of the Cauchari-Olaroz salars. Measurements were taken at each monitoring location for pH, conductivity, dissolved oxygen, and temperature. A subsequent Surface Water Monitoring Program, measuring identical parameters, was initiated in 2017 with the new drilling and was ongoing as of the effective date of this report. Flow rates are being monitored monthly. Measurements were made by monitoring flow velocity across a measured channel cross-sectional area at each site. Where the flow was too small to measure, it was estimated qualitatively. Monitoring locations are shown in Figure 7.46. Table 7.3 shows the results of this program for every month and the results with different methodologies used to measure the flows. The following methods were used to estimate the flow rates:
| • | Volumetric Method - consisting in a section of a known volume and measurement of time; |
| • | Float Method - recording the time it takes a float to pass along a known volumetric section of stream; and |
| • | Flow meter - a mechanical spinner tool which measuring the velocity of surface water passing through a known section of stream width. |
These parameters are somewhat elevated in surface water inflows at the north and south ends of the salars, relative to other surface water inflows.
The data acquired from this program supported the water balance calibration and numerical groundwater modeling.
Lithium Argentina AG., 2026 Cauchari-Olaroz S-K 1300 Technical Report Cauchari-Olaroz Salars, Argentina | Page 152 of 418 |
Figure 7.46 Surface Water Flow Monitoring Sites
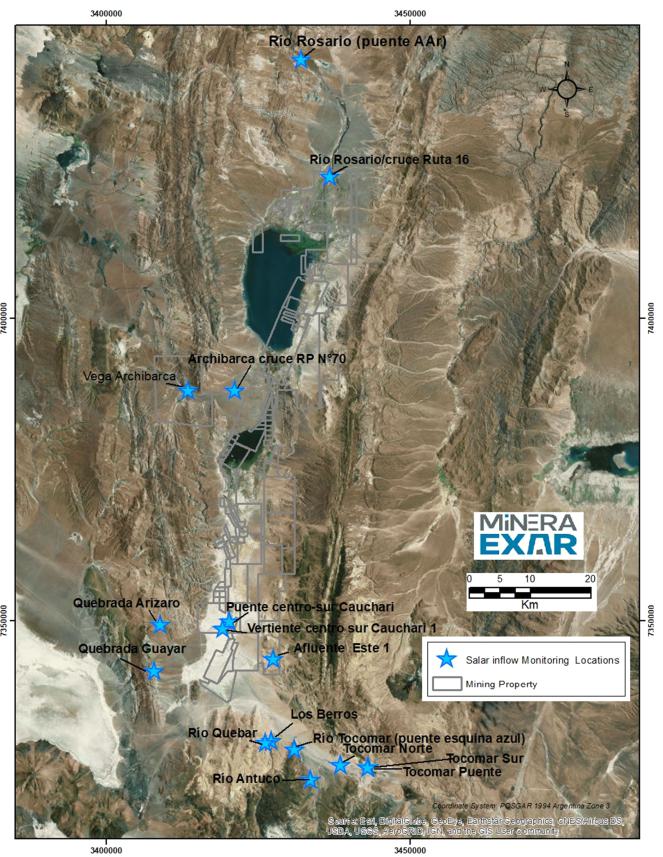
Source: Burga et al. (2020)
Lithium Argentina AG., 2026 Cauchari-Olaroz S-K 1300 Technical Report Cauchari-Olaroz Salars, Argentina | Page 153 of 418 |
| Table 7.3 Average Surface Water Flow Rates | ||||||||||
| Year | 2017 | 2018 | 2019 | |||||||
| Month |
Volumetric (L/s) |
Float (L/s) |
Flow Meter (L/s) |
Volumetric (L/s) |
Float (L/s) |
Flow Meter (L/s) |
Volumetric (L/s) |
Float (L/s) |
Flow Meter (L/s) |
Monthly Average (L/s) |
| Tocomar Norte | ||||||||||
| April | 9.46 | 8.8 | 9,14 | 9.13 | ||||||
| May | 7.25 | 7.34 | 7,00 | 7.19 | ||||||
| June | 11.30 | 13.47 | 3.33 | 6.43 | 9.52 | 8.81 | ||||
| July | 6.62 | 4.53 | 3.335 | 4.83 | ||||||
| August | 8.65 | 13.36 | 7.80 | 5.33 | 8.78 | |||||
| September | 9.77 | 26.14 | 20.21 | 18.71 | ||||||
| October | 8.93 | 8.65 | 15.61 | 18.13 | 12.78 | 12.82 | ||||
| November | 7.58 | 10.21 | 14.88 | 8.71 | 10.35 | |||||
| December | 5.92 | 9.74 | 8.34 | 14.87 | 9.72 | |||||
| January | 9.67 | 20.83 | 15.25 | |||||||
| February | 7.92 | 8.6 | 7.66 | 3.47 | 6.91 | |||||
| March | 8.4 | 8.8 | 7,11 | 8.10 | ||||||
| Tocomar Sur | ||||||||||
| April | 51.40 | 49.40 | 35,09 | 45,29 | ||||||
| May | 24.62 | 29.42 | 30,50 | 28,18 | ||||||
| June | 66.83 | 62.66 | 29.27 | 28.53 | 46.82 | |||||
| July | 45.08 | 44.01 | 44.55 | |||||||
| August | 46.00 | 29.02 | 46.89 | 40.64 | ||||||
| September | 46.12 | 40.64 | 40.27 | 42.34 | ||||||
| October | 36.14 | 34.37 | 22.28 | 28.49 | 30.32 | |||||
| November | 30.32 | 23.84 | 23.34 | 21.45 | 24.74 | |||||
| December | 8.03 | 33.55 | 31.97 | 24.51 | ||||||
Lithium Argentina AG., 2026 Cauchari-Olaroz S-K 1300 Technical Report Cauchari-Olaroz Salars, Argentina | Page 154 of 418 |
| Table 7.3 Average Surface Water Flow Rates | ||||||||||
| Year | 2017 | 2018 | 2019 | |||||||
| Month |
Volumetric (L/s) |
Float (L/s) |
Flow Meter (L/s) |
Volumetric (L/s) |
Float (L/s) |
Flow Meter (L/s) |
Volumetric (L/s) |
Float (L/s) |
Flow Meter (L/s) |
Monthly Average (L/s) |
| January | 38.29 | 45.30 | 41.80 | |||||||
| February | 28.08 | 33.60 | 46.22 | 62.66 | 42.64 | |||||
| March | 64.30 | 48.90 | 29,96 | 47.72 | ||||||
| Tocomar Puente | ||||||||||
| April | 102.8 | 96.45 | 103,74 | 116,54 | 104,88 | |||||
| May | 84 | 63.46 | 102,69 | 83,33 | ||||||
| June | 194.15 | 40.64 | 81.45 | 81.22 | 99.36 | |||||
| July | 234.99 | 161.6 | 135.07 | 177.22 | ||||||
| August | 82.28 | 62.17 | 147.34 | 152.9 | 111.17 | |||||
| September | 113.10 | 44.07 | 49.33 | 68.83 | ||||||
| October | 73.11 | 42.90 | 49.86 | 55.29 | ||||||
| November | 64.59 | 43.75 | 43.02 | 50.45 | ||||||
| December | 30.68 | 51.68 | 25.75 | 26.61 | 33.68 | |||||
| January | 55.49 | 82.88 | 41.01 | 40.64 | 55.01 | |||||
| February | 37.36 | 27.8 | 47.62 | 37.59 | ||||||
| March | 90.42 | 60.2 | 25,12 | 58,58 | ||||||
| Afluente Este 1 | ||||||||||
| April | 4.99 | 4.15 | 0,65 | 3,26 | ||||||
| May | 2.65 | 4,89 | 3,77 | |||||||
| June | 16.55 | 11.45 | 2.74 | 10.25 | ||||||
| July | 6.18 | 6.18 | ||||||||
| August | 27.33 | 5.38 | 16.36 | |||||||
| September | 6.47 | 8.34 | 4.15 | 7.98 | 6.74 | |||||
| October | 11.31 | 7.37 | 7.75 | 8.81 | ||||||
Lithium Argentina AG., 2026 Cauchari-Olaroz S-K 1300 Technical Report Cauchari-Olaroz Salars, Argentina | Page 155 of 418 |
| Table 7.3 Average Surface Water Flow Rates | ||||||||||
| Year | 2017 | 2018 | 2019 | |||||||
| Month |
Volumetric (L/s) |
Float (L/s) |
Flow Meter (L/s) |
Volumetric (L/s) |
Float (L/s) |
Flow Meter (L/s) |
Volumetric (L/s) |
Float (L/s) |
Flow Meter (L/s) |
Monthly Average (L/s) |
| November | 9.54 | 9.58 | 5.21 | 8.11 | ||||||
| December | 5.37 | 7.72 | 6.54 | |||||||
| January | 11.05 | 26.13 | 18.59 | |||||||
| February | 1.84 | 1.38 | 5.86 | 3.03 | ||||||
| March | 1.33 | 6,46 | 3,89 | |||||||
| Afluente Este 1R | ||||||||||
| April | 0.75 | 1,68 | 1,21 | |||||||
| May | 0.54 | 1,04 | 0.79 | |||||||
| June | 0.60 | 0.52 | 0.56 | |||||||
| July | 0.92 | 0.59 | 0.76 | |||||||
| August | 0.67 | 0.56 | 0.62 | |||||||
| September | 1.17 | 1.59 | 1.38 | |||||||
| October | 0.81 | 1.33 | 1.07 | |||||||
| November | 0.87 | 0.85 | 0.86 | |||||||
| December | 0.68 | 1.53 | 1.10 | |||||||
| January | 0.57 | 0.57 | ||||||||
| February | 0.53 | 0.53 | ||||||||
| March | 0.43 | 0,65 | 0.54 | |||||||
| Los Berros | ||||||||||
| April | 2.40 | 1.74 | 26,34 | 10.16 | ||||||
| May | 0.60 | 0.60 | ||||||||
| June | 10.53 | 8.77 | 9.65 | |||||||
| July | 27.22 | 27.22 | ||||||||
| August | 11.76 | 11.76 | 23.43 | 15.65 | ||||||
Lithium Argentina AG., 2026 Cauchari-Olaroz S-K 1300 Technical Report Cauchari-Olaroz Salars, Argentina | Page 156 of 418 |
| Table 7.3 Average Surface Water Flow Rates | ||||||||||
| Year | 2017 | 2018 | 2019 | |||||||
| Month |
Volumetric (L/s) |
Float (L/s) |
Flow Meter (L/s) |
Volumetric (L/s) |
Float (L/s) |
Flow Meter (L/s) |
Volumetric (L/s) |
Float (L/s) |
Flow Meter (L/s) |
Monthly Average (L/s) |
| September | 4.65 | 6.15 | 5.40 | |||||||
| October | 1.33 | 1.74 | 3.78 | 2.28 | ||||||
| November | 0.16 | 1.08 | 0.62 | |||||||
| December | 0.19 | 0.17 | 0.18 | |||||||
| January | ||||||||||
| February | 5.97 | 4.68 | 4.83 | 5.16 | ||||||
| March | 7.29 | 12,05 | 9,67 | |||||||
| Puente Centro Sur Cauchari | ||||||||||
| April | 11.36 | 10.98 | 11.17 | |||||||
| May | 1.70 | 1.70 | ||||||||
| June | 0.33 | 20.45 | 10.39 | |||||||
| July | 16 | 16.00 | ||||||||
| August | 11.03 | 11.03 | ||||||||
| September | 6.96 | 15.29 | 15.91 | 12.72 | ||||||
| October | 0.77 | 18.16 | 9.46 | |||||||
| November | 3.35 | 3.35 | ||||||||
| December | 2.23 | 2.23 | ||||||||
| January | 2.73 | 9.66 | 6.19 | |||||||
| February | 10.60 | 2.90 | 6.75 | |||||||
| March | 5.29 | 5.85 | 11,67 | 7.60 | ||||||
| Quebrada Arizaro | ||||||||||
| April | 0.33 | 0,61 | 0.47 | |||||||
| May | 0.52 | 0,27 | 0.39 | |||||||
| June | 0.92 | 0.85 | 0.88 | |||||||
Lithium Argentina AG., 2026 Cauchari-Olaroz S-K 1300 Technical Report Cauchari-Olaroz Salars, Argentina | Page 157 of 418 |
| Table 7.3 Average Surface Water Flow Rates | ||||||||||
| Year | 2017 | 2018 | 2019 | |||||||
| Month |
Volumetric (L/s) |
Float (L/s) |
Flow Meter (L/s) |
Volumetric (L/s) |
Float (L/s) |
Flow Meter (L/s) |
Volumetric (L/s) |
Float (L/s) |
Flow Meter (L/s) |
Monthly Average (L/s) |
| July | ||||||||||
| August | 0.83 | 0.83 | 1.35 | 1.00 | ||||||
| September | 0.96 | 1.20 | 1.08 | |||||||
| October | 0.60 | 1.35 | 0.97 | |||||||
| November | 0.19920319 | 0.25 | 0.22 | |||||||
| December | 0.12 | 0.12 | 0.12 | |||||||
| January | 2.94 | 2.94 | ||||||||
| February | 1.35 | 2.55 | 1.95 | |||||||
| March | 0.53 | 0,31 | 0.42 | |||||||
| Quebrada Guayar | ||||||||||
| April | 0.38 | 0,53 | 0.45 | |||||||
| May | 0.40 | 0,24 | 0.32 | |||||||
| June | 1.28 | 0.33 | 0.80 | |||||||
| July | 1.79 | 0.24 | 1.01 | |||||||
| August | 1.15 | 1.15 | 0.22 | 0.84 | ||||||
| September | 0.38 | 0.22 | 0.30 | |||||||
| October | 0.39 | 0.21 | 0.30 | |||||||
| November | 0.29 | 0.29 | 0.29 | |||||||
| December | 0.31 | 0.24 | 0.27 | |||||||
| January | 0.27 | 0.27 | ||||||||
| February | 0.46 | 0.46 | ||||||||
| March | 0.31 | 0,43 | 0.37 | |||||||
Lithium Argentina AG., 2026 Cauchari-Olaroz S-K 1300 Technical Report Cauchari-Olaroz Salars, Argentina | Page 158 of 418 |
| Table 7.3 Average Surface Water Flow Rates | ||||||||||
| Year | 2017 | 2018 | 2019 | |||||||
| Month |
Volumetric (L/s) |
Float (L/s) |
Flow Meter (L/s) |
Volumetric (L/s) |
Float (L/s) |
Flow Meter (L/s) |
Volumetric (L/s) |
Float (L/s) |
Flow Meter (L/s) |
Monthly Average (L/s) |
|
Río Antuco | ||||||||||
| April | 12.00 | 11.19 | 85,21 | 36.13 | ||||||
| May | 4.58 | 7.5 | 16,18 | 9,42 | ||||||
| June | 29.46 | 7.6 | 4.00 | 13.69 | ||||||
| July | 15.53 | 8.53 | 9.8 | 11.29 | ||||||
| August | 27.91 | 13.89 | 20.90 | |||||||
| September | 10.62 | 12.03 | 11.32 | |||||||
| October | 16.36 | 15.28 | 17.05 | 16.23 | ||||||
| November | 12.88 | 12.78 | 12.83 | |||||||
| December | 12.60 | 13.45 | 11.15 | 14.11 | 12.83 | |||||
| January | 9.44 | 10.64 | 7.60 | 9.23 | ||||||
| February | 15.4 | 13.27 | 11.15 | 9.42 | ||||||
| March | 9.35 | 5.9 | 9,28 | 8.17 | ||||||
| Río Quebar | ||||||||||
| April | 56.37 | 39.80 | 48.09 | |||||||
| May | 35.40 | 29.32 | 32.36 | |||||||
| June | 85.50 | 22.08 | 66.04 | 77.42 | 62.76 | |||||
| July | 76.56 | 67.63 | 65.20 | 69.80 | ||||||
| August | 86.32 | 33.86 | 38.61 | 42.90 | 50.42 | |||||
| September | 65.09 | 44.85 | 44.15 | 51.36 | ||||||
| October | 51.86 | 52.57 | 52.22 | |||||||
| November | 51.05 | 55.63 | 41.71 | 49.46 | ||||||
| December | 20.1 | 33.82 | 20.82 | 22.68 | 24.36 | |||||
| January | 20.39 | 39.81 | 34.71 | 31.64 | ||||||
| February | 57.80 | 35.47 | 46.64 | |||||||
| March | 76.65 | 89.25 | 82.95 | |||||||
Lithium Argentina AG., 2026 Cauchari-Olaroz S-K 1300 Technical Report Cauchari-Olaroz Salars, Argentina | Page 159 of 418 |
| Table 7.3 Average Surface Water Flow Rates | ||||||||||
| Year | 2017 | 2018 | 2019 | |||||||
| Month |
Volumetric (L/s) |
Float (L/s) |
Flow Meter (L/s) |
Volumetric (L/s) |
Float (L/s) |
Flow Meter (L/s) |
Volumetric (L/s) |
Float (L/s) |
Flow Meter (L/s) |
Monthly Average (L/s) |
| Río Rosario (Puente Aar) | ||||||||||
| April | 334 | 255 | 277,49 | 309,25 | 293,93 | |||||
| May | 276.67 | 288.95 | 228.811 | 208,38 | 244,32 | 249.42 | ||||
| June | 427.33 | 338.56 | 382.95 | |||||||
| July | 393.19 | 418.76 | 405.98 | |||||||
| August | 331.18 | 224.52 | 577.86 | 377.85 | ||||||
| September | 114.36 | 391.75 | 380.72 | 295.61 | ||||||
| October | 33.15 | 42.37 | 229.39 | 235.13 | 135.01 | |||||
| November | 32.27 | 36.61 | 131.01 | 119.09 | 79.75 | |||||
| December | 704.3 | 459.59 | 96.87 | 73.03 | 333.45 | |||||
| January | 92.40 | 67.90 | 80.15 | |||||||
| February | 439 | 426.17 | 548.11 | 216.15 | 407.36 | |||||
| March | 973 | 781 | 903,16 | 885.72 | ||||||
| Río Tocomar (Puente Esquina Azul) | ||||||||||
| April | 114.75 | 117.55 | 116.15 | |||||||
| May | 159.6 | 159.79 | 159.70 | |||||||
| June | ||||||||||
| July | 12.67 | 12.67 | ||||||||
| August | ||||||||||
| September | ||||||||||
| October | ||||||||||
| November | ||||||||||
| December | ||||||||||
| January | ||||||||||
| February | 14.43 | 14.43 | ||||||||
| March | 151.2 | 157.6 | 154.40 | |||||||
Lithium Argentina AG., 2026 Cauchari-Olaroz S-K 1300 Technical Report Cauchari-Olaroz Salars, Argentina | Page 160 of 418 |
| 7.13 | Brine Level Monitoring Program |
The static level of subsurface brine was monitored every month from an array of accessible wells within the salars. Monitoring was also conducted at domestic water wells just outside the Cauchari Salar. Measurements were taken with a Solinst Model 101 Water Level Meter. Some wells with difficult access used a Solinst Levelogger, model 3001, which records brine levels once a day.
Table 7.4 shows the average depth to static levels observed in the monitoring wells between 2010-2019. Variations in average fluid density and electrical conductivity monitored during sampling and testing were found to be negligible.
The data from the Brine Level Monitoring Program was used to calibrate the numerical groundwater model to long-term static conditions. Extensive monitoring of dynamic brine levels (i.e., in response to pumping) was also conducted, for the Pumping Test Program described in Section 7.14.
| Table 7.4 Static Water Level Measurements for the Period from January 2010 to February 2019 | ||
| Borehole ID |
Monitoring Period (mm/yy) |
Average Water Level (m below ground surface) |
| DL-001 | 12/17 - 02/19 | 6.02 |
| ML-001 | 10/17 - 02/19 | 7.98 |
| SL-001 | 09/17 - 02/19 | 2.05 |
| W-01 | 02/18 - 02/19 | 7.95 |
| DL-002 | 12/17 - 02/19 | 14.43 |
| ML-002 | 01/18 - 02/19 | 12.56 |
| SL-002 | 10/17 - 02/19 | 4.73 |
| W-02 | 02/18 - 02/19 | 13.34 |
| ML-003 | 09/17 - 02/19 | 11.96 |
| DL-003 | 09/17 - 02/19 | 14.51 |
| DL-003B | 01/18 - 02/19 | 26.39 |
| DL-004B | 03/18 - 02/19 | 12.47 |
| ML-004 | 09/17 - 02/19 | 4.52 |
| SL-004 | 09/17 - 02/19 | 2.35 |
| SL-004B | 03/18 - 02/19 | 2.43 |
| DL-005 | 03/18 - 02/19 | 17.22 |
| ML-005 | 12/17 - 02/19 | 16 |
| W-05 | 02/18 - 02/19 | 23.81 |
| DL-006 | 12/17 - 02/19 | 11.46 |
Lithium Argentina AG., 2026 Cauchari-Olaroz S-K 1300 Technical Report Cauchari-Olaroz Salars, Argentina | Page 161 of 418 |
| Table 7.4 Static Water Level Measurements for the Period from January 2010 to February 2019 | ||
| Borehole ID |
Monitoring Period (mm/yy) |
Average Water Level (m below ground surface) |
| ML-006 | 11/17 - 02/19 | 3.11 |
| SL-006 | 09/17 - 02/19 | 0.79 |
| SL-007 | 09/17 - 02/19 | 3.11 |
| ML-007 | 12/17 - 02/19 | 8.67 |
| DL-007 | 12/17- 02/19 | 15.90 |
| DL-008 | 03/18 - 02/19 | 14.1 |
| ML-008 | 10/17 - 02/19 | Artesian |
| DL-009 | 12/17 - 02/19 | 18.42 |
| ML-009 | 12/17 - 2/19 | 7.68 |
| SL-009 | 09/17 - 02/19 | 4.72 |
| DL-010 | 01/18 - 02/19 | 8.66 |
| ML-010 | 09/17 - 02/19 | 5.39 |
| SL-010 | 12/17 - 11/18 | 3.3 |
| DL-011 | 01/18 - 02/19 | 13.01 |
| ML-011 | 10/17 - 02/19 | 5.46 |
| DL-012 | 01/18 - 02/19 | 5.70 |
| ML-012 | 04/18 - 02/19 | 11.96 |
| DL-013 | 01/18 - 02/19 | 8.85 |
| ML-013 | 01/18 - 02/19 | 7.06 |
| SL-013 | 01/18 - 02/19 | Artesian |
| SL-014 | 01/18 - 02/19 | 2.41 |
| ML-014 | 01/18 - 02/19 | 9.53 |
| DL-014 | 01/18 - 02/19 | 12.72 |
| DDH-04A | 01/10 - 01/19 | 3.22 |
| DDH-05 | 01/09 - 01/19 | 1.92 |
| DDH-06A | 02/10 - 02/19 | 3.69 |
| DDH-07 | 01/10 - 02/19 | 1.54 |
| DDH-08 | 02/10 - 02/19 | 1.05 |
| DDH-09A | 04/10 - 02/19 | 2.64 |
| DDH-11 | 06/10 - 02/19 | 9.36 |
Lithium Argentina AG., 2026 Cauchari-Olaroz S-K 1300 Technical Report Cauchari-Olaroz Salars, Argentina | Page 162 of 418 |
| Table 7.4 Static Water Level Measurements for the Period from January 2010 to February 2019 | ||
| Borehole ID |
Monitoring Period (mm/yy) |
Average Water Level (m below ground surface) |
| DDH-12A | 05/10 - 02/19 | 5.72 |
| DDH-13 | 06/10 - 01/19 | 4.23 |
| DDH-14 | 07/10 - 12/18 | 7.39 |
| DDH-15 | 08/10 - 12/18 | 2.09 |
| DDH-16 | 07/10 - 02/19 | 10.90 |
| DDH-17 | 08/10 - 02/19 | Artesian |
| DDH-18 | 08/10 - 02/19 | 4.21 |
| DDH-1 | 08/10 - 02/29 | 11.40 |
| PP-20 | 03/14 - 02/19 | 18.00 |
Figure 7.47, Figure 7.48 and Figure 7.49 show the average depth of water levels for observation wells drilled in the shallow part of the aquifer (50 m deep), intermediate parts of the aquifer (250 to 300 m deep) and in the deeper parts of the aquifer (450 and 600 m deep).
Lithium Argentina AG., 2026 Cauchari-Olaroz S-K 1300 Technical Report Cauchari-Olaroz Salars, Argentina | Page 163 of 418 |
Figure 7.47 Average Depth to Static Water Levels in Shallow Wells (50 m)
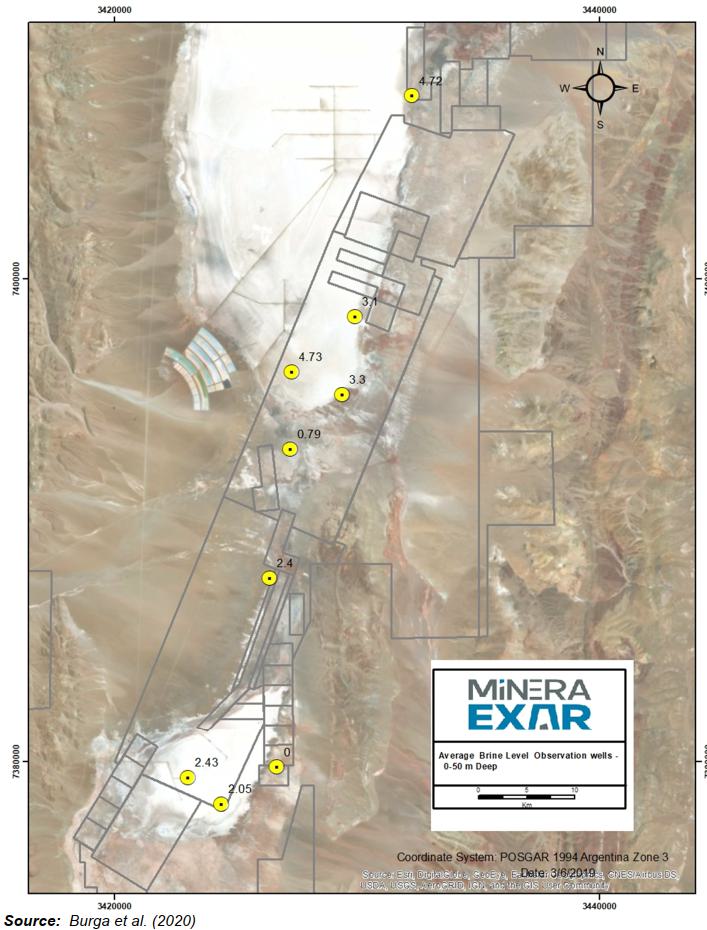
Lithium Argentina AG., 2026 Cauchari-Olaroz S-K 1300 Technical Report Cauchari-Olaroz Salars, Argentina | Page 164 of 418 |
Figure 7.48 Average
Depth to Static Water Levels in Intermediate Depth Wells
(250 - 300 m)
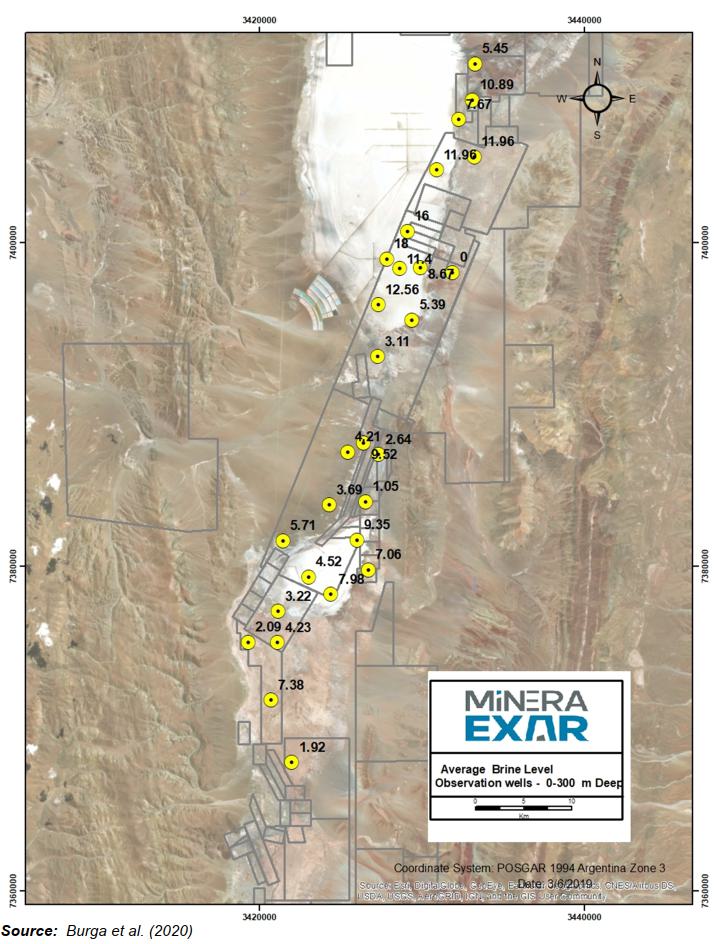
Lithium Argentina AG., 2026 Cauchari-Olaroz S-K 1300 Technical Report Cauchari-Olaroz Salars, Argentina | Page 165 of 418 |
Figure 7.49 Average Depth to Static Water Levels in Deep Wells (450 - 600 m)
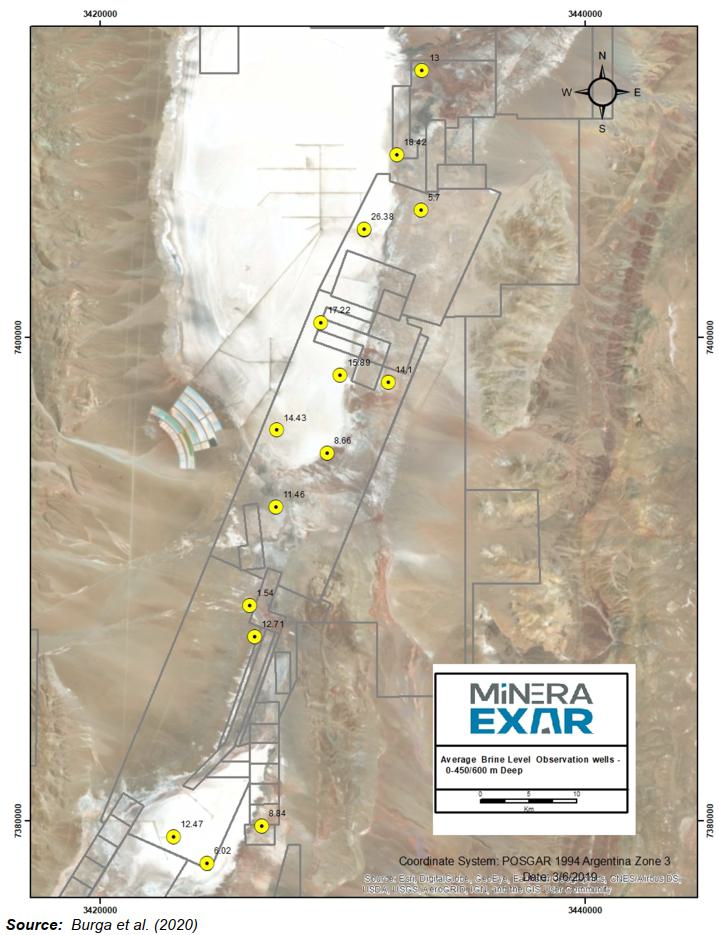
Lithium Argentina AG., 2026 Cauchari-Olaroz S-K 1300 Technical Report Cauchari-Olaroz Salars, Argentina | Page 166 of 418 |
| 7.14 | Pumping Test Program |
| 7.14.1 | Overview |
Based on exploration results in 2017-2019, production wells drilled after the 2011 production wells penetrate deeper parts of the aquifer. Deeper production wells increase the depth of the extractable part of the aquifer. A total of ten pumping wells and associated observation wells were installed at the site from 2011 to 2019 at the locations shown in Figure 7.50.
The pumping tests were conducted with two main objectives. The first objective was to develop broad-scale estimates of K (from Transmissivity (T)) and Ss (from Storativity (S)), for use in the numerical groundwater model. The second objective was to assess hydraulic interconnections between hydrostratigraphic units, to assist in understanding the overall flow system and in developing the groundwater model.
Drilling and testing in 2011 was conducted by Andina Perforaciones of Salta, Argentina, under field supervision by Conhidro of Salta, Argentina; in 2018-2019 by Hidrotec Perforaciones and Wichi Toledo. The drilling method was direct rotary. Field supervision of the pumping tests was provided by Exar personnel. The constant rate pumping tests were preceded by step tests, to determine appropriate pumping rates for the constant rate tests.
The 2011 pumping test analysis was conducted independently by both Conhidro and Matrix Solutions Inc.; in 2018-2019 the pumping test analysis is being conducted by Exar with technical review by Montgomery.
A summary of the pumping tests carried out during 2011-2019 is provided in Appendix 1.
Lithium Argentina AG., 2026 Cauchari-Olaroz S-K 1300 Technical Report Cauchari-Olaroz Salars, Argentina | Page 167 of 418 |
Figure 7.50 Production Wells
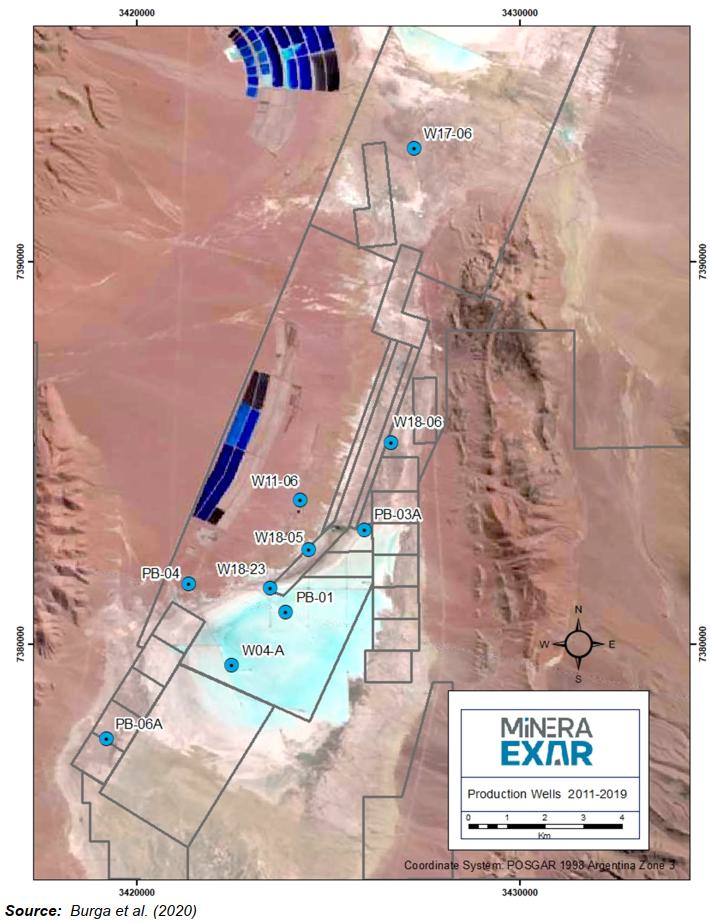
Lithium Argentina AG., 2026 Cauchari-Olaroz S-K 1300 Technical Report Cauchari-Olaroz Salars, Argentina | Page 168 of 418 |
| 7.15 | Chemistry of Samples Collected During Pump Tests |
A plot of lithium results for samples collected during 2018-2019 pumping tests is provided in Figure 7.51. The record of concentration is relatively stable for each well.
Figure 7.51 Lithium Concentrations in Samples Collected During Pump Tests
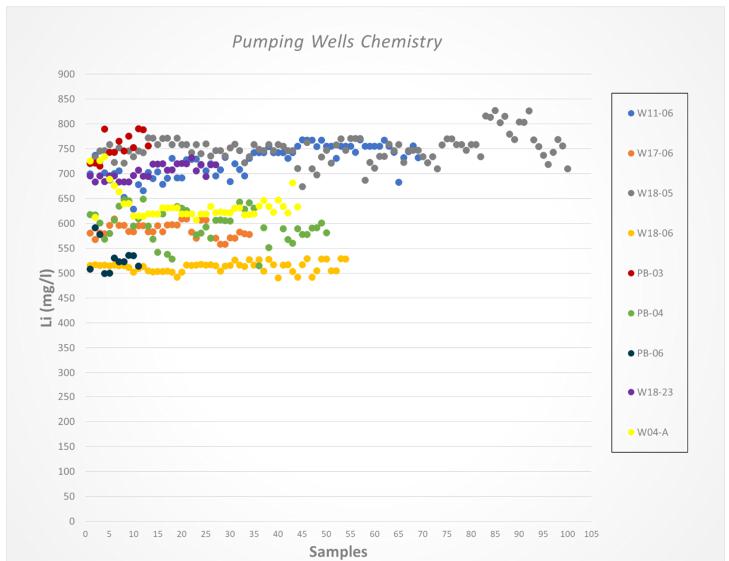
| * | Data points show samples taken hourly at the beginning of the pumping test and daily after two days. In some cases, the pumping test stopped due to mechanical reasons and the sampling resumed when the pumping re-started. |
Source: Exar.
A plot of lithium results for samples collected during 2024-2025 pumping tests is provided in Figure 7.52 and Figure 7.53 for Cauchari and Olaroz wells, respectively. The record of concentration is relatively stable for each well.
Lithium Argentina AG., 2026 Cauchari-Olaroz S-K 1300 Technical Report Cauchari-Olaroz Salars, Argentina | Page 169 of 418 |
Figure 7.52 Lithium Concentrations in Pump Test Samples – Cauchari
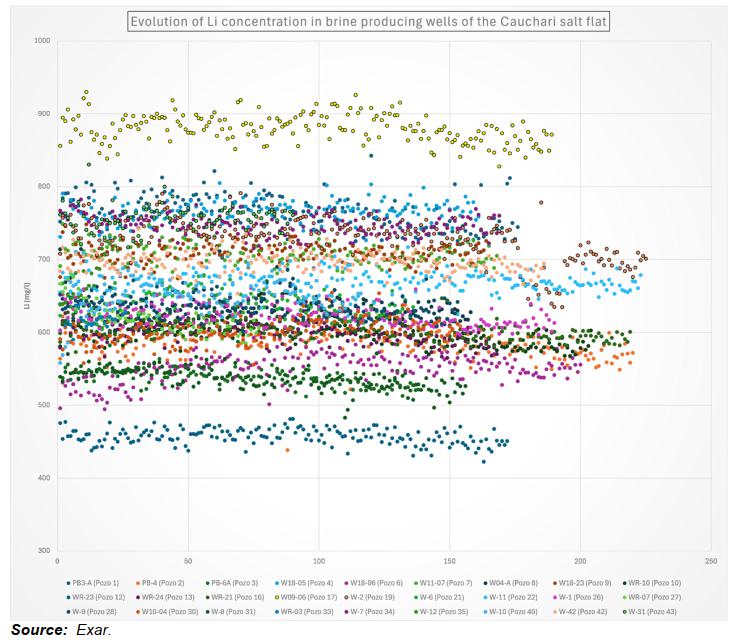
Lithium Argentina AG., 2026 Cauchari-Olaroz S-K 1300 Technical Report Cauchari-Olaroz Salars, Argentina | Page 170 of 418 |
Figure 7.53 Lithium Concentrations in Pump Test Samples – Olaroz
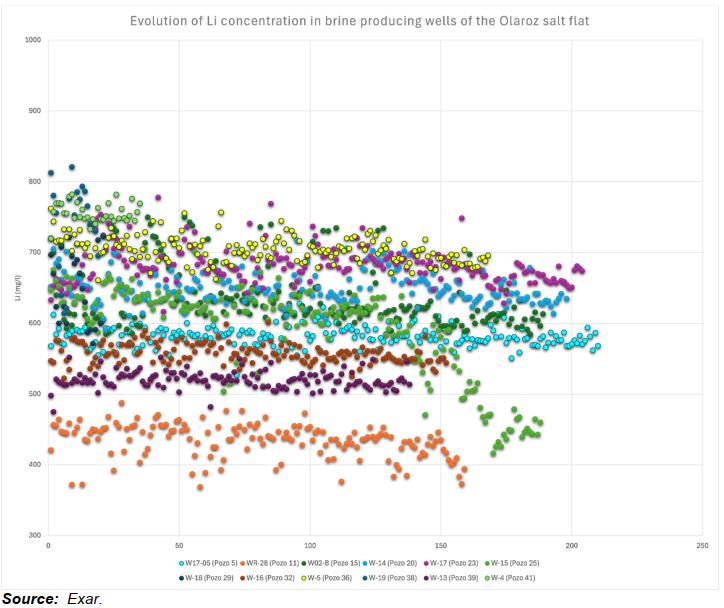
| 7.16 | Drilling |
| 7.16.1 | Reverse Circulation (RC) Borehole Program 2009-2010 |
The objectives of this program were to: 1) develop vertical profiles of brine chemistry at depth in the salars, and 2) provide geological and hydrogeological data. This program was conducted between September 2009 and August 2010 and the drilling is summarized in Table 7.5. Twenty-four RC boreholes (PE-01 through PE-22, plus two twin holes) were completed during this period, for total drilling of 4,176 m. Borehole depths range from 28 m (PE-01) to 371 m (PE-10).
Lithium Argentina AG., 2026 Cauchari-Olaroz S-K 1300 Technical Report Cauchari-Olaroz Salars, Argentina | Page 171 of 418 |
| Table 7.5 Borehole Drilling Summary for the RC Borehole Program Conducted in 2009 and 2010 | |||||||
| RC Borehole ID |
Drilling Interval | Drilling Length (m) |
RC Borehole ID |
Drilling Interval | Drilling Length (m) | ||
| From (m) |
To (m) |
From (m) |
To (m) | ||||
| PE-01 | - | 28 | 28 | PE-13 | - | 209 | 209 |
| PE-02 | - | 40 | 40 | PE-14 | - | 144 | 144 |
| PE-03 | - | 90 | 90 | PE-14A | 144 | 228 | 84 |
| PE-04 | - | 187 | 187 | PE-15 | - | 205 | 205 |
| PE-05 | - | 210 | 210 | PE-16 | - | 64 | 64 |
| PE-06 | - | 165 | 165 | PE-17 | - | 246 | 246 |
| PE-07 | 78.9 | 249 | 170.1 | PE-17A | - | 220 | 220 |
| PE-08 | - | 194 | 194 | PE-18 | - | 312 | 312 |
| PE-09 | - | 198 | 198 | PE-19 | - | 267 | 267 |
| PE-10 | - | 371 | 371 | PE-20 | - | 204 | 204 |
| PE-11 | - | 80 | 80 | PE-21 | - | 222 | 222 |
| PE-12 | - | 36 | 36 | PE-22 | - | 230 | 230 |
| Total Boreholes: 24 / Total drilling: 4,176 m | |||||||
Note: RC = reverse circulation.
Major Drilling, a Canadian drilling company with operations in Argentina, was contracted to carry out the RC drilling using a Schramm T685W rig and support equipment. The holes were initially drilled using ODEX and open-hole RC drilling methods at 10”, 8”, and 6” diameters. No drilling additives were used. A change was later made from ODEX and open-hole RC drilling to tri-cone bits of 17½” 16”, 9½”, 7⅞”, 6”, and 5½” diameters. Bit diameters were selected based on ambient lithological conditions at each borehole, with the objective of maximizing the drilling depth.
During drilling, chip and brine samples are collected from the cyclone at one-meter intervals. Occasionally, lost circulation resulted in the inability to collect samples from some intervals. Brine sample collection is summarized in Table 7.6. A total of 1,487 brine samples were collected from 15 of the RC boreholes and submitted for laboratory chemical analyses. For each brine sample, field measurements were conducted on an irregular basis, for potassium (by portable XRF analyzer), and regularly for electrical conductivity, pH and temperature. Sample collection, preparation and analytical methods are described in Section 8.0.
Lithium Argentina AG., 2026 Cauchari-Olaroz S-K 1300 Technical Report Cauchari-Olaroz Salars, Argentina | Page 172 of 418 |
| Table 7.6 Summary of Brine Samples Collected and Submitted for Laboratory Analysis from the RC and DDH Borehole Programs | |
| Description | Brine Samples |
| Total Field Samples | 1,614 |
| Total RC Borehole Program Field Samples | 1,487 |
| Total DDH Borehole Program Field Samples | 127 |
| Total Samples (Including QC) | 2,390 |
| Total Field Duplicates | 260 |
| Total Blanks | 263 |
| Total Standards | 253 |
| Note: RC = reverse circulation, DDH = diamond drill hole. | |
Air-lift flow measurements were conducted at six-meter intervals in six RC boreholes, when circulation was adequate. Daily static water level measurements were carried out inside the drill string at the start of each drilling shift, using a water level tape. Boreholes were completed with steel surface casing, a surface sanitary cement seal, and a lockable cap.
Average concentrations and chemical ratios of brine samples are shown in Table 7.7, for sampled intervals in 14 of the 15 sampled RC boreholes. Results for PE-3 (a flowing artesian well) are not included in the table because it receives freshwater from the alluvial cone adjacent to its position on the eastern margin of the Olaroz Salar. The sampled brines have a relatively low Mg/Li ratio (lower than most sampling intervals), indicating that the brines would be amenable to a conventional lithium recovery process. RC borehole logs are provided by King (2010b), including available brine sampling results.
Lithium Argentina AG., 2026 Cauchari-Olaroz S-K 1300 Technical Report Cauchari-Olaroz Salars, Argentina | Page 173 of 418 |
| Table 7.7 Brine Concentrations (mg/L) and Ratios Averaged Across Selected Depth Intervals for RC Program Boreholes | ||||||||||
| Borehole ID |
Depth (m) |
Length (m) |
B | K | Li | Mg | SO4 | Mg/Li | K/Li | SO4/Li |
| PE-04 | 11-32 | 21 | 795 | 5,987 | 692 | 2,458 | 20,498 | 4 | 8.652 | 29.621 |
| 59-79 | 20 | 1,033 | 7,225 | 759 | 1,993 | 24,114 | 3 | 9.519 | 31.770 | |
| 83-187 | 89 | 935 | 6,226 | 623 | 1,844 | 22,568 | 3 | 9.994 | 36.246 | |
| PE-06 | 18-21 | 3 | 729 | 7,060 | 834 | 2,737 | 18,234 | 3 | 8.465 | 21.872 |
| 54-165 | 111 | 1,261 | 6,982 | 870 | 2,031 | 16,731 | 2 | 8.025 | 19.240 | |
| PE-07 | 78-108 | 20 | 824 | 3,520 | 380 | 907 | 14,388 | 2 | 9.263 | 37.867 |
| 109-113 | 4 | 1,078 | 5,328 | 768 | 1,924 | 16,961 | 3 | 6.938 | 22.075 | |
| 117-136 | 19 | 1,019 | 3,887 | 448 | 1,151 | 13,238 | 3 | 8.676 | 29.530 | |
| 145-205 | 54 | 1,054 | 4,558 | 579 | 1,461 | 16,420 | 3 | 7.872 | 28.351 | |
| 207-248 | 38 | 1,030 | 4,205 | 490 | 1,080 | 15,326 | 2 | 8.582 | 31.247 | |
| PE-09 | 72-105 | 33 | 921 | 4,229 | 530 | 1,482 | 17,379 | 3 | 7.979 | 32.800 |
| 109-163 | 54 | 809 | 4,998 | 646 | 2,126 | 23,746 | 3 | 7.737 | 36.755 | |
| 164-197 | 33 | 827 | 5,998 | 741 | 1,734 | 16,445 | 2 | 8.094 | 22.196 | |
| PE-10 | 60-152 | 92 | 1,041 | 4,051 | 396 | 174 | 17,495 | 0 | 10.230 | 44.183 |
| 152-234 | 82 | 1,398 | 6,072 | 598 | 1,144 | 20,401 | 2 | 10.154 | 34.106 | |
| PE-13 | 102-105 | 3 | 655 | 3,963 | 505 | 1,383 | 16,225 | 3 | 7.848 | 32.129 |
| 108-120 | 12 | 751 | 4,433 | 533 | 1,379 | 20,465 | 3 | 8.317 | 38.431 | |
| PE-14 | 147-179 | 32 | 860 | 6,572 | 733 | 1,918 | 23,359 | 3 | 8.966 | 31.853 |
| 179-192 | 13 | 874 | 6,287 | 681 | 1,821 | 20,763 | 3 | 9.232 | 30.499 | |
| 192-228 | 36 | 861 | 6,152 | 712 | 1,842 | 21,222 | 3 | 8.640 | 29.813 | |
| PE-15 | 62-92 | 30 | 981 | 5,096 | 527 | 1,174 | 16,079 | 2 | 9.670 | 30.527 |
| 103-132 | 29 | 762 | 3,719 | 465 | 1,066 | 16,639 | 2 | 7.998 | 35.758 | |
| 144-156 | 12 | 883 | 4,794 | 582 | 1,238 | 13,966 | 2 | 8.237 | 24.017 | |
| 168-189 | 21 | 888 | 5,079 | 606 | 1,224 | 12,575 | 2 | 8.381 | 20.744 | |
| PE-17 | 78-84 | 6 | 968 | 3,910 | 537 | 1,623 | 17,021 | 3 | 7.281 | 31.716 |
| 87-91 | 4 | 901 | 3,572 | 481 | 1,442 | 16,137 | 3 | 7.426 | 33.531 | |
| 103-107 | 4 | 669 | 4,229 | 482 | 1,121 | 18,481 | 2 | 8.774 | 38.322 | |
| 110-111 | 1 | 863 | 5,446 | 648 | 1,702 | 23,544 | 3 | 8.404 | 36.333 | |
| 154-156 | 2 | 1,044 | 4,026 | 472 | 935 | 12,167 | 2 | 8.530 | 25.805 | |
| 171-174 | 3 | 968 | 4,269 | 507 | 1,109 | 12,965 | 2 | 8.420 | 25.573 | |
Lithium Argentina AG., 2026 Cauchari-Olaroz S-K 1300 Technical Report Cauchari-Olaroz Salars, Argentina | Page 174 of 418 |
| Table 7.7 Brine Concentrations (mg/L) and Ratios Averaged Across Selected Depth Intervals for RC Program Boreholes | ||||||||||
| Borehole ID |
Depth (m) |
Length (m) |
B | K | Li | Mg | SO4 | Mg/Li | K/Li | SO4/Li |
| PE-18 | 140-260 | 120 | 1,396 | 7,216 | 717 | 1,489 | 27,284 | 2 | 10.064 | 38.064 |
| PE-19 | 26-30 | 4 | 1,154 | 5,152 | 404 | 761 | 17,275 | 2 | 12.752 | 42.733 |
| 42-62 | 20 | 1,182 | 7,601 | 911 | 3,050 | 20,347 | 3 | 8.344 | 22.343 | |
| 64-132 | 68 | 817 | 6,347 | 738 | 2,456 | 18,160 | 3 | 8.600 | 24.604 | |
| 145-267 | 122 | 757 | 5,957 | 655 | 1,906 | 21,467 | 3 | 9.095 | 32.755 | |
| PE-20 | 18-30 | 12 | 717 | 6,712 | 747 | 2,706 | 21,407 | 4 | 8.985 | 28.644 |
| 60-127 | 64 | 821 | 5,759 | 650 | 1,778 | 22,117 | 3 | 8.860 | 34.013 | |
| 129-150 | 19 | 794 | 6,389 | 698 | 2,183 | 21,572 | 3 | 9.153 | 30.887 | |
| 155-204 | 49 | 795 | 6,193 | 691 | 2,193 | 21,464 | 3 | 8.962 | 31.040 | |
| PE-21 | 92-112 | 20 | 1,255 | 5,619 | 661 | 1,298 | 22,085 | 2 | 8.501 | 33.389 |
| 113-134 | 21 | 1,235 | 5,587 | 735 | 1,412 | 22,605 | 2 | 7.601 | 30.761 | |
| 135-222 | 87 | 1,233 | 7,162 | 825 | 1,694 | 22,086 | 2 | 8.681 | 26.769 | |
| PE-22 | 72-89 | 17 | 1,095 | 6,414 | 656 | 1,456 | 26,397 | 2 | 9.777 | 40.248 |
| 90-197 | 107 | 1,136 | 7,216 | 696 | 1,482 | 26,604 | 2 | 10.368 | 38.232 | |
| 198-230 | 32 | 1,051 | 7,036 | 733 | 1,913 | 24,928 | 3 | 9.599 | 34.002 | |
Note: RC = reverse circulation.
Lithium Argentina AG., 2026 Cauchari-Olaroz S-K 1300 Technical Report Cauchari-Olaroz Salars, Argentina | Page 175 of 418 |
| 7.16.2 | Diamond Drilling (DDH) Borehole Program 2009-2010 |
The objectives of this program were to collect: 1) continuous cores for mapping and characterization, 2) geologic samples for geotechnical testing, including Relative Brine Release Capacity (RBRC), grain size and density, 3) brine samples using low-flow pumping methods, and 4) information for the construction of observation wells for future sampling and monitoring. The drilling reported herein was conducted between October 2009 and August 2010. DD Borehole Program drilling is summarized in Table 7.8. Twenty-nine boreholes (DDH-1 through DDH-18, plus twin holes) were completed, for a total of 5,714 m of drilling. Borehole depths range from 79 m (DDH-2) to 449.5 m (DDH-7).
| Table 7.8 Borehole Drilling Summary for the DDH Program Conducted in 2009 and 2010 | |||||||
| DDH Borehole |
Drilling Interval | Drilling Length (m) |
DDH Borehole |
Drilling Interval | Drilling
Length (m) | ||
| From (m) |
To (m) |
From (m) |
To (m) | ||||
| DDH-1 | - | 272.45 | 272.45 | DDH-10B | - | 36.80 | 36.80 |
| DDH-2 | - | 78.90 | 78.90 | DDH-11 | 165.00 | 260.80 | 95.80 |
| DDH-3 | - | 322.00 | 322.00 | DDH-12 | - | 309.00 | 309.00 |
| DDH-4 | - | 264.00 | 264.00 | DDH-12A | - | 294.00 | 294.00 |
| DDH-4A | - | 264.00 | 264.00 | DDH-13 | - | 193.50 | 193.50 |
| DDH-5 | - | 115.50 | 115.50 | DDH-13A | - | 20.50 | 20.50 |
| DDH-6A | - | 338.50 | 338.50 | DDH-13B | - | 20.50 | 20.50 |
| DDH-6 | - | 129.00 | 129.00 | DDH-13C | - | 20.50 | 20.50 |
| DDH-7 | 371.00 | 449.50 | 78.50 | DDH-13D | - | 20.50 | 20.50 |
| DDH-8 | - | 250.50 | 250.50 | DDH-14 | - | 254.50 | 254.50 |
| DDH-8A | - | 252.50 | 252.50 | DDH-15 | - | 206.50 | 206.50 |
| DDH-9 | - | 362.50 | 362.50 | DDH-16 | - | 270.00 | 270.00 |
| DDH9A | - | 352.00 | 352.00 | DDH-17 | - | 79.00 | 79.00 |
| DDH-10 | - | 350.50 | 350.50 | DDH-18 | - | 203.50 | 203.50 |
| DDH-10A | - | 258.00 | 258.00 | ||||
| Total Boreholes: 29 / Total Drilling: 5,714 m | |||||||
Note: DDH = diamond drill hole.
Major Drilling, a Canadian drilling company with operations in Argentina, was contracted to carry out the drilling using a Major-50 drill rig and support equipment. The boreholes were drilled using triple tube PQ and HQ drilling methods. During drilling, core was retrieved and stored in boxes for subsequent geological analysis. Borehole logs are provided by King (2010b). Undisturbed samples were taken from the core in PVC sleeves (two-inch diameter and five-inch length) at selected intervals, for laboratory testing of geotechnical parameters including: RBRC, grain size, and particle density. A total of 832 undisturbed samples were tested.
Lithium Argentina AG., 2026 Cauchari-Olaroz S-K 1300 Technical Report Cauchari-Olaroz Salars, Argentina | Page 176 of 418 |
On completion of exploration drilling, selected DD boreholes were converted to observation wells to enable brine sample collection as a means of supplementing the brine data collected through the RC Borehole Program. The observation wells were prepared by installing Schedule 80, 2-inch diameter, PVC casing and slotted (1 mm) screen in the boreholes. The wells were completed with steel surface casing, a surface sanitary cement seal and lockable cap. Brine sampling was conducted from March to August 2010. Samples were initially collected with a low-flow pump. However, later samples were collected with a bailer, due to technical difficulties with the low-flow setup. Analytical results are summarized in Table 7.9.
| Table 7.9 Brine Concentrations (mg/L) Averaged Across Selected Depth Intervals for DDH Program Boreholes | ||||||||
| Borehole ID |
Depth (m) |
Length (m) |
B | K | Li | Mg | SO4 | Mg/Li |
| DDH-01 | 15-55 | 40 | 610 | 4.847 | 523 | 1.147 | 9.039 | 2.20 |
| 70-105 | 40 | 765 | 5.253 | 596 | 1.399 | 10.901 | 2.35 | |
| 140-170 | 30 | 832 | 5.518 | 634 | 1.528 | 11.694 | 2.41 | |
| 205-260 | 55 | 839 | 5.558 | 636 | 1.463 | 11.572 | 2.30 | |
| DDH-04 | 15-190 | 175 | 668 | 4.968 | 544 | 1.039 | 23.038 | 1.91 |
| DDH-06 | 100-115 | 15 | 674 | 3.961 | 515 | 1.100 | 15.934 | 2.14 |
| 118-136 | 18 | 667 | 5.860 | 627 | 1.353 | 18.552 | 2.16 | |
| 140-190 | 51 | 719 | 6.698 | 732 | 1.579 | 20.853 | 2.16 | |
| DDH-08 | 20-75 | 50 | 611 | 3.735 | 408 | 1.409 | 10.537 | 3.46 |
| 80-205 | 125 | 822 | 5.232 | 588 | 1.223 | 16.971 | 2.08 | |
| DDH-12 | 65-70 | 5 | 696 | 4.120 | 464 | 927 | 16.834 | 2.00 |
| 170-185 | 10 | 800 | 5.050 | 545 | 1.161 | 17.888 | 2.13 | |
| 225-285 | 25 | 827 | 5.249 | 565 | 1.223 | 17.819 | 2.16 | |
| DDH-13 | 50-140 | 90 | 872 | 5.940 | 650 | 1.921 | 20.955 | 2.96 |
| 7.16.3 | Diamond Drilling (DDH) Borehole Program 2017-2019 |
The objectives of this program were to collect: 1) continuous cores for mapping and characterization of the shallow, intermediate and deeper parts of the aquifer; 2) geologic samples for geotechnical testing and grain size analysis; 3) brine samples using a bailer; and 4) information for the construction of observation wells for future sampling and monitoring. The drilling reported in Table 7.10 was conducted between July 2017 and June 2019. It should be noted that the lithium resource is contained in brines and is not affected by the drill core recovery.
The 2017, 2018, and 2019 programs included drilling 50 m, 200 m and 450 to 600 m deep, smaller diameter wells from the same drilling platform. Shallow and intermediate depth boreholes were competed in the same borehole. The shallowest wells use 1” diameter PVC casing. The deeper borehole was drilled 15 m away from the shallow and intermediate well locations. The intermediate and deep wells were cased using Schedule 80, 2-inch or 2.5-inch diameter, PVC casing and slotted (1 mm) screen in the boreholes. The wells were completed with steel surface casing, a surface sanitary cement seal and lockable cap. Brine sampling was conducted prior to pump testing. Sample collection, preparation and analytical methods are described in Section 8.0.
Lithium Argentina AG., 2026 Cauchari-Olaroz S-K 1300 Technical Report Cauchari-Olaroz Salars, Argentina | Page 177 of 418 |
Major Drilling, a Canadian drilling company with operations in Argentina, and Ideal Drilling, a Bolivian company, were contracted to carry out the drilling program.
The deep boreholes were drilled using HQ-diameter size, triple-tube core recovery methods. During drilling, core was retrieved and stored in metal boxes for subsequent geological analysis. The shallow and medium depth boreholes were drilled with tricone 5 ½” diameter rotary methods. Description of continuous core from the deep borehole served as overall characterization of lithologies for the location of the platform. A photo of the black sand targeted in DDH19D-001 is shown in Figure 7.54.
All borehole locations and their associated platforms are presented in Figure 7.55. Brine concentrations averaged across select intervals are presented in Table 7.11 Brine sample collection is summarized in Section 8.4.
Lithium Argentina AG., 2026 Cauchari-Olaroz S-K 1300 Technical Report Cauchari-Olaroz Salars, Argentina | Page 178 of 418 |
| Table 7.10 Borehole Drilling Summary for the DDH Program Conducted in 2017 and 2019 | |||||||||
| DD Borehole ID |
Piezometer Name |
Screen Diameter |
Plataform | Contractor | Total Depth (m) |
Screen Top (mbtw) |
Screen Base (mbtw) |
X Coordinate |
Y Coordinate |
| DD17S-001 | ML-001 | 2" | 1 | IDEAL | 200 | 109.40 | 174.80 | 3424377.00 | 7378282.00 |
| DD17S-001 | SL-001 | 1" | 1 | IDEAL | 50 | 23.80 | 47.73 | 3424377.00 | 7378282.00 |
| DD17D-001 | DL-001 | 2.5" | 1 | IDEAL | 450 | 265.50 | 444.00 | 3424392.00 | 7378275.00 |
| DD17D-002B | DL-002 | 2" | 4 | IDEAL | 450 | 343.36 | 444.24 | 3427266.00 | 7396185.00 |
| DD17S-002 | ML-002 | 2" | 4 | IDEAL | 189.1 | 109.20 | 168.70 | 3427273.00 | 7396180.00 |
| DD17S-002 | SL-002 | 1" | 4 | IDEAL | 50 | 23.80 | 47.73 | 3427273.00 | 7396180.00 |
| DD17S-003 | ML-003 | 2" | 9 | IDEAL | 200 | 151.72 | 193.30 | 3430870.00 | 7404487.00 |
| DD17D-003 | DL-003 | 2.5" | 9 | IDEAL | 650 | 292.60 | 636.10 | 3430861.00 | 7404476.00 |
| RC17D-003 | DL-003 B | 2.5" | 9 | Major | 648 | 221.20 | 642.00 | 3430859.00 | 7404497.00 |
| RC17S-004 | ML-004 | 2" | 2 | Major | 200 | 122.75 | 194.00 | 3422991.00 | 7379367.00 |
| RC17S-004 | SL-004 | 1" | 2 | Major | 50 | 23.80 | 47.73 | 3422991.00 | 7379367.00 |
| DD17D-004 | DL-004 | 2.5" | 2 | IDEAL | 650 | 427.68 | 617.57 | 3423010.00 | 7379367.00 |
| RC17D-004 B | DL-004 B | 2.5" | 2 | Major | 550 | 196.92 | 547.30 | 3423006.00 | 7379355.00 |
| RC17S-004 B | SL-004B | 2.5 " | 2 | IDEAL | 50 | 14.30 | 50.00 | 3423001.00 | 7379362.00 |
| DD17D-005 | DL-005 | 2.5" | 7 | IDEAL | 604.55 | 309.25 | 576.77 | 3429086.00 | 7400627.00 |
| RC17S-005 | ML-005 | 2" | 7 | Major | 192 | 115.00 | 186.40 | 3429092.00 | 7400696.00 |
| RC17S-006 | ML-006 | 2" | 3 13 14 | Major | 200 | 122.70 | 194.00 | 3427230.00 | 7392980.00 |
| RC17S-006 | SL-006 | 1" | 3 13 14 | Major | 50 | 23.80 | 47.73 | 3427230.00 | 7392980.00 |
| DD17D-006B | DL-006 | 2.5 | 3 13 14 | IDEAL | 450 | 255.90 | 443.95 | 3427245.00 | 7393001.00 |
| RC17S-007 | SL-007 | 1" | 8 15 | Major | 50 | 23.80 | 47.73 | 3429894.00 | 7398465.00 |
| RC17S-007 | ML-007 | 2" | 8 15 | Major | 200 | 110.10 | 175.50 | 3429894.00 | 7398465.00 |
| DD17D-007 | DL-007 | 2.5" | 8 15 | IDEAL | 450 | 217.10 | 436.70 | 3429885.00 | 7398456.00 |
| RC17S-008 | ML-008 | 2.5" | 6 | Major | 160 | 86.10 | 151.50 | 3431846.00 | 7398167.00 |
| DD17D-008 | DL-08 | 2" | 6 | Major | 447 | 267.30 | 439.56 | 3431865.00 | 7398168.00 |
| RC17S-009 | SL-009 | 2" | 11 12 | Major | 50 | 23.80 | 47.73 | 3432230.00 | 7407612.00 |
| RC17S-009 | ML-009 | 2.5" | 11 12 | Major | 200 | 122.90 | 194.00 | 3432230.00 | 7407612.00 |
| DD17D-009 | DL-09 | 2.5" | 11 12 | Major | 450 | 218.00 | 444.05 | 3432221.00 | 7407596.00 |
| RC17S-010 B | ML-010 | 2.5" | 5 | Major | 200 | 115.97 | 187.1 | 3429367.00 | 7395232.00 |
| RC17S-010 B | SL-010 | 2" | 5 | Major | 50 | 23.80 | 47.73 | 3429367.00 | 7395232.00 |
Lithium Argentina AG., 2026 Cauchari-Olaroz S-K 1300 Technical Report Cauchari-Olaroz Salars, Argentina | Page 179 of 418 |
| Table 7.10 Borehole Drilling Summary for the DDH Program Conducted in 2017 and 2019 | |||||||||
| DD Borehole ID |
Piezometer Name |
Screen Diameter |
Plataform | Contractor | Total Depth (m) |
Screen Top (mbtw) |
Screen Base (mbtw) |
X Coordinate |
Y Coordinate |
| DD17D-010 | DL-10 | 2.5" | 5 | Major | 450 | 230.10 | 444.40 | 3429348.00 | 7395235.00 |
| RC17S-011 | ML-011 | 2.5" | 16 | Major | 200 | 101.00 | 166.00 | 3433260.00 | 7411045.00 |
| DD17D-011 | DL-011 | 2.5" | 16 | IDEAL | 450 | 235.80 | 444.00 | 3433255.00 | 7411065.00 |
| RC17S-012 | ML-012 | 2.5" | 10 | Major | 200 | 128.94 | 194.39 | 3433213.00 | 7405310.00 |
| DD17D-012 | DL-012 | 3" | 10 | Major | 451.65 | 204.34 | 436 | 3433225.00 | 7405308.00 |
| RC17S-13 | SL-13 | 1" | 18 | IDEAL | 50 | 23.8 | 47.6 | 3426671.00 | 7379792.00 |
| RC17S-13 | ML-013 | 2" | 18 | IDEAL | 200 | 122.7 | 194 | 3426671.00 | 7379792.00 |
| DD17D-013 | DL-013 | 2.5" | 18 | IDEAL | 450 | 279.18 | 443 | 3426658.00 | 7379792.00 |
| DD17D-014 | DL-014 | 2.5" | 17 20 | IDEAL | 431.35 | 238 | 425.03 | 3426361.00 | 7387640.00 |
| RC17S-014 | ML-014 | 2.5" | 17 20 | IDEAL | 200 | 104.75 | 194.9 | 3426381.00 | 7387647.00 |
| RC17S-014 | SL-014 | 1" | 17 20 | IDEAL | 26.7 | 2.9 | 26.7 | 3426361.00 | 7387640.00 |
| DD18D-001 | Cemented | 2.5" | CN-10 | IDEAL | 300 | Cemented | Cemented | 3430069.00 | 7403904.00 |
| DD18D-002 | Cemented | 2.5" | CN-14 | IDEAL | 300 | Cemented | Cemented | 3431478.00 | 7406690.00 |
| DD18D-003 | Abandoned | 2.5" | CN-19 | IDEAL | 13 | Abandoned | Abandoned | 3428499.00 | 7398500.00 |
| DD18D-004 | Cemented | 2.5" | CN-02 | IDEAL | 300 | Cemented | Cemented | 3427303.00 | 7397557.00 |
| DD18D-005 | Cemented | 2.5" | CS-28 | IDEAL | 300 | Cemented | Cemented | 3424500.00 | 7382499.00 |
| DD18D-006 | Cemented | 2.5" | CS-31 | IDEAL | 300 | Cemented | Cemented | 3426650.00 | 7385299.00 |
| DD18D-007 | Cemented | 2.5" | P-17 | IDEAL | 300 | Cemented | Cemented | 3424250.00 | 7385700.00 |
| DD19D-001 | DD19D-001 | - | 1 | Hidrotec | 632 | - | - | 3424376.00 | 7378282.00 |
| DD19D-PE09 | DD19D-PE09 | 2” | PE-09 | Hidrotec | 358 | 42 | 352 | 3419473.00 | 7374367.00 |
Note: DD = diamond drilling, DDH = diamond drill hole, mbtw = meters below top of well.
Lithium Argentina AG., 2026 Cauchari-Olaroz S-K 1300 Technical Report Cauchari-Olaroz Salars, Argentina | Page 180 of 418 |
Figure 7.54 Black Sand in DD19D-001
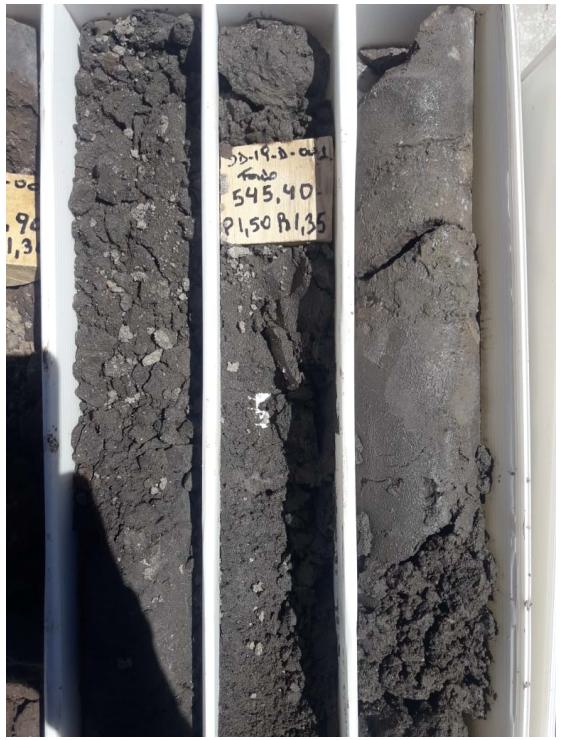
Lithium Argentina AG., 2026 Cauchari-Olaroz S-K 1300 Technical Report Cauchari-Olaroz Salars, Argentina | Page 181 of 418 |
Figure 7.55 Borehole Locations and Associated Drilling Platforms
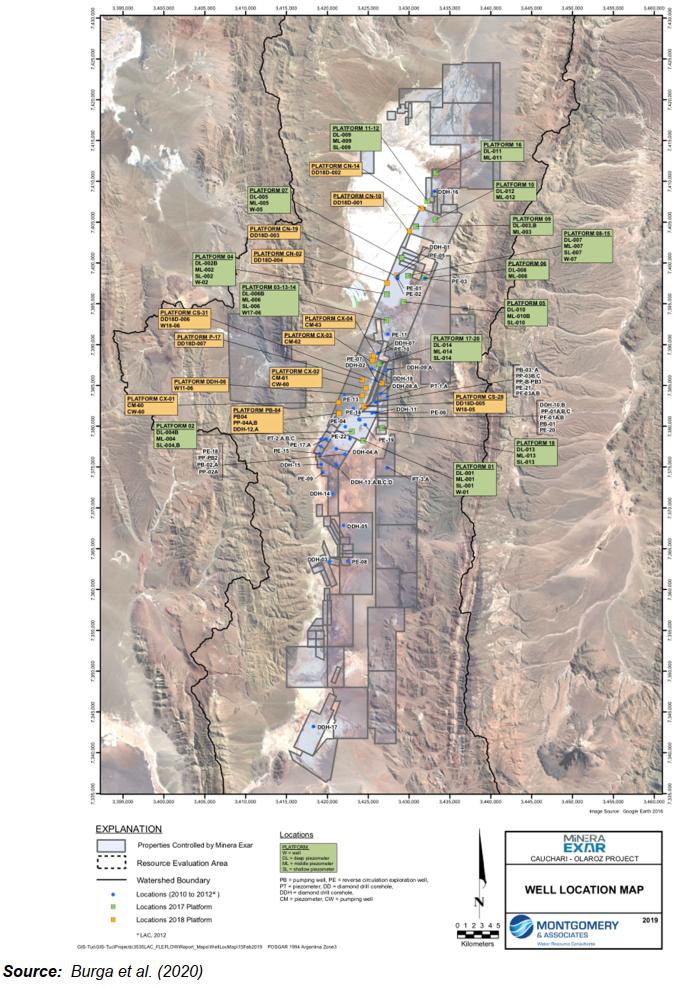
Lithium Argentina AG., 2026 Cauchari-Olaroz S-K 1300 Technical Report Cauchari-Olaroz Salars, Argentina | Page 182 of 418 |
| Table 7.11 Brine Concentrations (mg/L) Averaged Across Selected Depth Intervals for DDH Program Boreholes 2017-2019 | ||||||||
| DD Borehole ID |
From – To (m) |
Lenth (m) |
Li (mg/L) |
K (mg/L) |
Mg (mg/L) |
H3BO3 (mg/L) |
SO4 (mg/L) |
Mg/Li |
| DL-001 | 0-100 | 100 | 574.0 | 5465.0 | 1584.0 | 5953.0 | 18996.0 | 2.8 |
| DL-001 | 100-200 | 100 | 549.0 | 5368.0 | 1645.8 | 5782.8 | 20878.7 | 3.0 |
| DL-001 | 200-300 | 100 | 502.3 | 4661.1 | 1674.6 | 6076.0 | 24260.6 | 3.3 |
| DL-001 | 300-400 | 100 | 585.2 | 5186.1 | 1230.1 | 4477.4 | 22927.4 | 2.1 |
| DL-001 | 400-450 | 50 | 579.4 | 4897.2 | 1230.1 | 5273.0 | 24900.6 | 2.1 |
| DD19D-001 | 450-632 | 182 | 559.7 | 4768.0 | 1309.4 | 4604.7 | 18795.7 | 2.3 |
| DL-002 | 0-100 | 100 | 528.0 | 3867.0 | 1182.0 | 6404.0 | 15717.0 | 2.2 |
| DL-002 | 100-200 | 100 | 519.0 | 4129.0 | 1168.0 | 6355.0 | 15695.0 | 2.3 |
| DL-002 | 200-300 | 100 | 588.0 | 4113.0 | 1172.0 | 6397.0 | 15578.0 | 2.0 |
| DL-002 | 300-400 | 100 | 515.0 | 4208.0 | 1208.0 | 6781.0 | 15785.0 | 2.3 |
| DL-002 | 400-450 | 50 | 511.6 | 4214.3 | 1315.4 | 6820.8 | 15955.8 | 2.6 |
| DL-003B | 0-250 | 250 | 805.9 | 6349.2 | 1271.1 | 9181.9 | 20757.0 | 1.6 |
| DL-003B | 250-300 | 50 | 770.5 | 5760.3 | 1289.0 | 9417.1 | 22503.2 | 1.7 |
| DL-003B | 300-400 | 100 | 807.2 | 5907.1 | 1235.2 | 9502.7 | 23114.7 | 1.5 |
| DL-003B | 400-500 | 100 | 767.3 | 4774.6 | 1609.0 | 7210.6 | 16808.4 | 2.1 |
| DL-003B | 500-600 | 100 | 730.8 | 4409.2 | 1814.8 | 6747.7 | 16686.6 | 2.5 |
| DL-004B | 0-200 | 200 | 652.9 | 4400.8 | 1594.7 | 4775.6 | 21278.4 | 2.4 |
| DL-004B | 200-300 | 100 | 679.0 | 5426.6 | 1831.9 | 4771.0 | 22094.8 | 2.7 |
| DL-004B | 300-400 | 100 | 733.2 | 5499.0 | 1936.9 | 4900.2 | 24440.0 | 2.6 |
| DL-004B | 400-500 | 100 | 757.0 | 5653.2 | 1871.8 | 4859.6 | 24786.3 | 2.5 |
| DL-005 | 0-100 | 100 | 686.0 | 6100.5 | 1127.0 | 9205.9 | 31482.5 | 1.6 |
| DL-005 | 100-200 | 100 | 685.4 | 5887.4 | 1101.6 | 8821.4 | 30967.2 | 1.6 |
| DL-005 | 200-300 | 100 | 696.5 | 5938.9 | 1124.2 | 8645.7 | 31649.8 | 1.6 |
| DL-005 | 300-375 | 75 | 766.1 | 6688.0 | 1349.8 | 8519.3 | 24563.2 | 1.8 |
Lithium Argentina AG., 2026 Cauchari-Olaroz S-K 1300 Technical Report Cauchari-Olaroz Salars, Argentina | Page 183 of 418 |
| Table 7.11 Brine Concentrations (mg/L) Averaged Across Selected Depth Intervals for DDH Program Boreholes 2017-2019 | ||||||||
| DD Borehole ID |
From – To (m) |
Lenth (m) |
Li (mg/L) |
K (mg/L) |
Mg (mg/L) |
H3BO3 (mg/L) |
SO4 (mg/L) |
Mg/Li |
| DL-006 | 0-100 | 100 | 534.6 | 4775.0 | 1275.8 | 6196.5 | 17131.5 | 2.4 |
| DL-006 | 100-200 | 100 | 552.0 | 4601.0 | 1299.0 | 6990.0 | 15762.0 | 2.4 |
| DL-006 | 200-300 | 100 | 561.0 | 4627.0 | 1352.0 | 6782.0 | 14510.0 | 2.4 |
| DL-006 | 300-400 | 100 | 534.0 | 4627.0 | 1357.0 | 7034.0 | 15607.0 | 2.5 |
| DL-007 | 0-100 | 100 | 446.0 | 3741.8 | 434.9 | 11671.4 | 46958.1 | 1.0 |
| DL-007 | 100-200 | 100 | 481.7 | 4223.7 | 705.2 | 9843.0 | 43842.5 | 1.5 |
| DL-007 | 200-300 | 100 | 459.9 | 3766.3 | 422.6 | 11646.9 | 51584.5 | 0.9 |
| DL-007 | 300-400 | 100 | 448.9 | 3865.7 | 425.2 | 11771.7 | 54743.3 | 0.9 |
| DL-008 | 0-100 | 100 | 315.1 | 2240.6 | 1260.4 | 3517.3 | 11319.9 | 4.0 |
| DL-008 | 100-200 | 100 | 315.9 | 2281.5 | 1275.3 | 3201.1 | 11115.0 | 4.0 |
| DL-008 | 200-300 | 100 | 237.0 | 1968.0 | 1172.0 | 2468.0 | 9528.0 | 4.9 |
| DL-008 | 300-400 | 100 | 267.0 | 2064.0 | 1236.0 | 3837.0 | 10212.0 | 4.6 |
| DL-009 | 0-100 | 100 | 782.0 | 5295.0 | 1170.0 | 10505.0 | 19910.0 | 1.5 |
| DL-009 | 100-200 | 100 | 769.9 | 5205.7 | 1054.6 | 10680.3 | 20040.8 | 1.4 |
| DL-009 | 200-300 | 100 | 689.0 | 4034.0 | 685.0 | 11400.0 | 43208.0 | 1.0 |
| DL-009 | 300-400 | 100 | 765.0 | 5299.0 | 1325.0 | 10586.0 | 21966.0 | 1.7 |
| DL-010 | 0-19 | 19 | 411.1 | 3566.6 | 943.0 | 6913.1 | 23817.3 | 2.3 |
| DL-010 | 19-250 | 231 | 462.1 | 3733.1 | 766.1 | 8028.0 | 25049.6 | 1.7 |
| DL-010 | 250-300 | 50 | 463.2 | 3803.3 | 792.4 | 8014.9 | 25964.7 | 1.7 |
| DL-010 | 300-400 | 100 | 433.3 | 3379.7 | 520.0 | 10683.9 | 44196.6 | 1.2 |
| DL-011 | 0-100 | 100 | 549.9 | 3165.0 | 1061.9 | 9470.5 | 17963.4 | 1.9 |
| DL-011 | 100-200 | 100 | 523.7 | 3191.2 | 1082.8 | 8854.9 | 17539.2 | 2.1 |
| DL-012 | 0-100 | 100 | 653.9 | 5788.6 | 1421.7 | 4861.0 | 15258.6 | 2.2 |
| DL-012 | 100-200 | 100 | 690.8 | 6035.8 | 1452.0 | 5708.5 | 15150.0 | 2.1 |
Lithium Argentina AG., 2026 Cauchari-Olaroz S-K 1300 Technical Report Cauchari-Olaroz Salars, Argentina | Page 184 of 418 |
| Table 7.11 Brine Concentrations (mg/L) Averaged Across Selected Depth Intervals for DDH Program Boreholes 2017-2019 | ||||||||
| DD Borehole ID |
From – To (m) |
Lenth (m) |
Li (mg/L) |
K (mg/L) |
Mg (mg/L) |
H3BO3 (mg/L) |
SO4 (mg/L) |
Mg/Li |
| DL-012 | 200-275 | 75 | 663.7 | 5825.5 | 1428.1 | 4621.0 | 15485.4 | 2.2 |
| DL-013 | 0-100 | 100 | 631.0 | 5351.0 | 1547.0 | 8882.0 | 25501.0 | 2.5 |
| DL-013 | 100-200 | 100 | 585.6 | 4977.6 | 1450.6 | 8479.0 | 21838.0 | 2.5 |
| DL-013 | 200-260 | 60 | 476.6 | 4545.8 | 1242.8 | 8541.8 | 25662.0 | 2.6 |
| DL-014 | 0-225 | 225 | 476.0 | 5224.0 | 1094.0 | 4008.0 | 23495.0 | 2.3 |
| DL-014 | 225-300 | 75 | 458.0 | 4705.0 | 1092.0 | 7155.0 | 24746.0 | 2.4 |
| DL-014 | 300-400 | 100 | 453.0 | 4790.0 | 1073.0 | 6424.0 | 25694.0 | 2.4 |
| ML-001 | 0-50 | 50 | 715.0 | 6104.0 | 2067.0 | 5291.0 | 37239.0 | 2.9 |
| ML-001 | 50-100 | 50 | 679.0 | 7422.0 | 1701.0 | 5972.0 | 40111.0 | 2.5 |
| ML-001 | 100-150 | 50 | 580.0 | 6357.0 | 1232.0 | 5904.0 | 29900.0 | 2.1 |
| ML-002 | 0-50 | 50 | 641.0 | 4850.0 | 1264.0 | 6255.0 | 17492.0 | 2.0 |
| ML-002 | 50-100 | 50 | 623.0 | 5164.0 | 1328.0 | 6240.0 | 18615.0 | 2.1 |
| ML-002 | 100-150 | 50 | 557.1 | 5074.1 | 1093.5 | 4747.1 | 19376.0 | 2.0 |
| DD19D-PE09 | 286-301 | 15 | 545.05 | 4552.8 | 1385.4 | 5168.7 | 19077.0 | 2.5 |
| DD19D-PE09 | 325-340 | 15 | 532.4 | 4573.8 | 1458.05 | 4917.4 | 20328.0 | 2.7 |
Lithium Argentina AG., 2026 Cauchari-Olaroz S-K 1300 Technical Report Cauchari-Olaroz Salars, Argentina | Page 185 of 418 |
| 7.16.4 | Production Well Drilling |
Information from the exploration drilling and pump tests was used to select the locations of the production wells that are used to pump lithium brine to the evaporation ponds. Since 2011, a total of 43 production wells have been drilled on the Property.
The production wellfield uses three wells drilled in 2011, these wells had a smaller diameter (8 inches). The wells drilled in 2018/2019 were drilled deeper and used a larger diameter according to the expected flow. The production wells were drilled with conventional rotary rigs and a surface casing at the top of the wells to ensure the stability of the well head over time. The design of the deeper wells used larger diameter casing in the upper 200/250 m, continuing with smaller diameter casing below. This telescopic design saves costs and drilling time. An example of brine being pumped from a well is shown in Figure 7.56.
The production wells use stainless steel screen, which guarantees a long life and avoids corrosion. The Stanley steel screen casing is inserted in each well at different intervals and is inserted facing the productive horizons of the aquifer. As a rule, the minimum length used is two meters. The solid screen casing is generally used in front of massive halite and clay layers (aquicludes and aquitards). The solid and screen casing alternate through the aquifer.
Details of the production wells and length of screened casing and solid casing used in each well are provided in Table 7.12. Well locations are shown in Figure 7.57.
Figure 7.56 Pumping Well W18-05
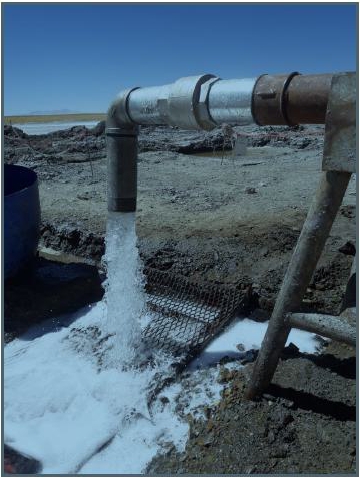
Source: Exar
Lithium Argentina AG., 2026 Cauchari-Olaroz S-K 1300 Technical Report Cauchari-Olaroz Salars, Argentina | Page 186 of 418 |
| Table 7.12 Production Well Drilling and Construction Details | ||||||||||
| Pumping Well |
Year |
Total |
Coordinates | Drilling Method |
Drilling |
Well Construction | Construction Material | |||
| X | Y |
Total Length |
Total Length of |
Solid |
Screen | |||||
| PB-03A | 2011 | 204 | 7383015 | 3425965 | Rotary | 22" (0-39 m) | 8" (122.9 m) | 8" (77.89 m) | Carbon Steel | Galvanized Steel |
| 13 1/4" (39-205 m) | ||||||||||
| PB-04 | 2011 | 201 | 7381604 | 3421378 | Rotary | 22" (0-57 m) | 8" (220.7 m) | 8" (80.88 m) | Carbon Steel | Galvanized Steel |
| 12 1/4" (57-305 m) | ||||||||||
| PB-06A | 2011 | 305 | 7377554 | 3419220 | Rotary | 18" (0-47 m) | 8" (114.5 m) | 8" (79.0 m) | Carbon Steel | Galvanized Steel |
| 12 1/4" (47-194 m) | ||||||||||
| W18-05 | 2018 | 270 | 7382499 | 3424500 | Rotary | 17" (0-273.7 m) | 10" (138.0 m) | 10" (132.4 m) | Carbon Steel | Stainless Steel |
| 13" (273.7-278 m) | ||||||||||
| W17-06 | 2018 | 455 | 7392988 | 3427261 | Rotary | 27"(0-12 m) | 20" (12 m) | Carbon Steel | Stainless Steel | |
| 17"(12-229.5 m) | 10" (123.5 m) | 10" (99.0 m) | ||||||||
| 13"(229.5-455 m) | 6" (35.5 m) | 6" (187.0 m) | ||||||||
| W18-06 | 2019 | 460 | 7385299 | 3426650 | Rotary | 27" (0-44.5 m) | 20" (44 m) | Carbon Steel | Stainless Steel | |
| 17" (44.5-253 m) | 10" (104.0 m) | 10" (146.0 m) | ||||||||
| 12 1/4" (253-450 m) | 6" (51 m) | 6" (149.0 m) | ||||||||
| W11-06 | 2019 | 434 | 7383792 | 3424279 | Rotary | 27" (0-41.3 m) | 20" | Carbon Steel | Stainless Steel | |
| 17" (41.3-212.7 m) | 10" (127.5 m) | 10" (74.0 m) | ||||||||
| 12 1/4" (212.7-434 m) | 6" (59.5 m) | 6" (167.0 m) | ||||||||
| W18-23 | 2019 | 484 | 7381500 | 3423500 | Rotary | 27" (0-36 m) | 20" | Carbon Steel | Stainless Steel | |
| 18 1/2" (36-230 m) | 10" (91.5 m) | 10" (134.0 m) | ||||||||
| 12 1/4" (230-486 m) | 6" (73.5 m) | 6" (185.0 m) | ||||||||
| W-04A | 2019 | 478 | 7379360 | 3423300 | Rotary | 27" (0-51 m) | 10" (292.0 m) | 10" (181.0 m) |
Carbon Steel |
Stainless Steel |
| 17" (51-478 m) | ||||||||||
| WR-10 | 2019 | 445 | 7380009 | 3420981 | Rotary | 27" (0-23 m) |
10" (114.5 m) 6" (33.5 m) |
10" (70 m) 6" (132 m) |
Carbon Steel | Stainless Steel |
| 18" (23-190 m) | ||||||||||
| 13 1/2" (190-355 m) | ||||||||||
Lithium Argentina AG., 2026 Cauchari-Olaroz S-K 1300 Technical Report Cauchari-Olaroz Salars, Argentina | Page 187 of 418 |
| Table 7.12 Production Well Drilling and Construction Details | ||||||||||
| Pumping Well |
Year |
Total |
Coordinates | Drilling Method |
Drilling |
Well Construction | Construction Material | |||
| X | Y |
Total Length |
Total Length of |
Solid |
Screen | |||||
| WR-28 | 2019 | 464 | 7391301 | 3427390 | Rotary | 27" (0-65.44 m) | 20" | Carbon Steel | Stainless Steel | |
| 17 1/2" (65.44-225 m) | 10" (123.5 m) | 10" (97 m) | ||||||||
| 12 1/4" (225-464 m) | 6" (63.5 m) | 6" (174 m) | ||||||||
| WR-23 | 2019 | 469 | 7387343 | 3426988 | Rotary | 27" (0-43.5 m) | 20" | Carbon Steel | Stainless Steel | |
| 17 1/2" (43.5-214 m) | 10" (100.5 m) | 10" (116 m) | ||||||||
| 12 1/4" (214-469 m) | 6" (79.5 m) | 6" (170 m) | ||||||||
| W-02B | 2019 | 505 | 7396259 | 3427137 | Rotary | 27" (0-41 m) | 20" | Carbon Steel | Stainless Steel | |
| 18 1/2" (41-223.8 m) | 12" (103.5 m) | 12" (115 m) | ||||||||
| 15" (223.8-505 m) | 8" (70.5 m) | 8" (212 m) | ||||||||
| WR-21 | 2019 | 493 | 7385987 | 3425367 | Rotary | 27" (0-52.8 m) | 20" | Carbon Steel | Stainless Steel | |
| 17 1/2" (52.8-230 m) | 10" (129.5 m) | 10" (96 m) | ||||||||
| 14" (230-480 m) | 6" (67.5 m) | 6" (202 m) | ||||||||
| W09-06 | 2019 | 355 | 7381651 | 3425959 | Rotary | 24" (0-47.38 m) | 20" | Carbon Steel | Stainless Steel | |
| 18" (47.38-200 m) | 10" (170.5 m) | 10" (125 m) | ||||||||
| 12 1/4" (20-355 m) | 6" (15.5 m) | 6" (141 m) | ||||||||
| W-2 | 2019 | 475 | 7382500 | 3423500 | Rotary | 27" (0-19 m) | 20" | Carbon Steel | Stainless Steel | |
| 17" (19-220 m) | 10" (122.5 m) | 10" (94 m) | ||||||||
| 12 1/4" (220-470 m) | 6" (56.5 m) | 6" (199 m) | ||||||||
| W-14 | 2019 | 494 | 7395200 | 3427355 | Rotary | 27" (0-24 m) | 20" | Carbon Steel | Stainless Steel | |
| 17" (24-212.1 m) | 10" (85.5 m) | 10" (124 m) | ||||||||
| 13 1/2" (212.1-607.7 m) | 6" (107.5 m) | 6" (288 m) | ||||||||
Lithium Argentina AG., 2026 Cauchari-Olaroz S-K 1300 Technical Report Cauchari-Olaroz Salars, Argentina | Page 188 of 418 |
| Table 7.12 Production Well Drilling and Construction Details | ||||||||||
| Pumping Well |
Year |
Total |
Coordinates | Drilling Method |
Drilling |
Well Construction | Construction Material | |||
| X | Y |
Total Length |
Total Length of |
Solid |
Screen | |||||
| W-6 | 2019 | 514 | 7380503 | 3423495 | Rotary | 27" (0-26 m) | 20" | 27" (0-24 m) | Carbon Steel | Stainless Steel |
| 17 1/2" (26-210 m) | 10" (128.5 m) | 10" (80 m) | ||||||||
| 13 1/2" (210-514 m) | 6" (97.5 m) | 6" (201 m) | ||||||||
| W-11 | 2020 | 435 | 7381499 | 3422495 | Rotary | 27" (0-29 m) | 20" | Carbon Steel | Stainless Steel | |
| 17 1/2" (29-218 m) | 10" (113.5 m) | 10" (101 m) | ||||||||
| 12 1/4" (218-435 m) | 6" (22.5 m) | 6" (193 m) | ||||||||
| W-17 | 2020 | 680 | 7395459 | 3426522 | Rotary | 27" (0-26.9 m) | 20" | Carbon Steel | Stainless Steel | |
| 17 1/2" (26.9-212 m) | 10" (122 m) | 10" (89 m) | ||||||||
| 12 1/4" (212-680 m) | 6" (74 m) | 6" (392 m) | ||||||||
| W-15 | 2020 | 607 | 7393711 | 3426282 | Rotary | 27" (0-25 m) | 20" | Carbon Steel | Stainless Steel | |
| 17 1/2" (25-242 m) | 10" (208 m) | |||||||||
| 12 1/4" (242-607 m) | 6" (96 m) | 6" (299 m) | ||||||||
| W-1 | 2019 | 386.6 | 7380788 | 3421631 | Rotary | 27" (0-30.22 m) | 20" | Carbon Steel | Stainless Steel | |
| 18" (30.22-204.95 m) | 10" (99 m) | 10" (98 m) | ||||||||
| 12 1/4" (204.95-386.6 m) | 6" (41 m) | 6" (144 m) | ||||||||
| WR-07 | 2019 | 338.6 | 7378442 | 3420554 | Rotary | 27" (0-29 m) | 20" | Carbon Steel | Stainless Steel | |
| 17" (29-220 m) | 10" (154 m) | 10" (84 m) | ||||||||
| 13 1/2" (220-338.6 m) | 6" (17 m) | 6" (145 m) | ||||||||
| W-9 | 2020 | 511 | 7378500 | 3422500 | Rotary | 27" (0-34 m) | 20" | Carbon Steel | Stainless Steel | |
| 18 1/2" (34-233 m) | 10" (78 m) | 10" (147 m) | ||||||||
| 13 1/2" (233-511 m) | 6" (44 m) | 6" (229 m) | ||||||||
Lithium Argentina AG., 2026 Cauchari-Olaroz S-K 1300 Technical Report Cauchari-Olaroz Salars, Argentina | Page 189 of 418 |
| Table 7.12 Production Well Drilling and Construction Details | ||||||||||
| Pumping Well |
Year |
Total |
Coordinates | Drilling Method |
Drilling |
Well Construction | Construction Material | |||
| X | Y |
Total Length |
Total Length of |
Solid |
Screen | |||||
| W-18 | 2021 | 530 | 7396871 | 3427605 | Rotary | 27" (0-36 m) | 20" | Carbon Steel | Stainless Steel | |
| 17" (36-205 m) | 10" (108.5 m) | 10" (89 m) | ||||||||
| 13 1/2" (205-530 m) | 6" (33.5 m) | 6" (294 m) | ||||||||
| W10-04 | 2020 | 434.1 | 7377243 | 3421092 | Rotary | 27" (0-30 m) | 20" | Carbon Steel | Stainless Steel | |
| 18 1/2" (30-224.68 m) | 10" (71.5 m) | 10" (126 m) | ||||||||
| 13 1/2" (224.68-434.1 m) | 6" (45.5 m) | 6" (168 m) | ||||||||
| W-8 | 2020 | 308 | 7376655 | 3419086 | Rotary | 27" (0-34 m) | 20" | Carbon Steel | Stainless Steel | |
| 17" (34-136 m) | 10" (89.5 m) | 10" (45 m) | ||||||||
| 13 1/2" (136-308 m) | 6" (10.5 m) | 6" (149 m) | ||||||||
| W-16 | 2020 | 715 | 7394024 | 3227420 | Rotary | 27" (0-31.2 m) | 20" | Carbon Steel | Stainless Steel | |
| 17" (31.2-240 m) | 10" (158.5 m) | 10" (78 m) | ||||||||
| 13 1/2" (240-715 m) | 6" (69.5 m) | 6" (392 m) | ||||||||
| WR-03 | 2021 | 366 | 7376056 | 3420007 | Rotary | 27" (0-40.5 m) | 20" | Carbon Steel | Stainless Steel | |
| 17" (40.5-211 m) | 10" (55.5 m) | 10" (134 m) | ||||||||
| 13 1/2" (211-366 m) | 6" (16.5 m) | 6" (140 m) | ||||||||
| W-7 | 2020 | 565 | 7375500 | 3421500 | Rotary | 27" (0-28 m) | 20" | Carbon Steel | Stainless Steel | |
| 17 1/2" (28-220.7 m) | 10" (68.5 m) | 10" (147 m) | ||||||||
| 13 1/2" (220.7-561.81 m) | 6" (48.5 m) | 6" (295 m) | ||||||||
| W-12 | 2020 | 530 | 7383998 | 3426498 | Rotary | 27" (0-30 m) | 20" | Carbon Steel | Stainless Steel | |
| 17" (30-214.8 m) | 10" (108.5 m) | 10" (102 m) | ||||||||
| 13" (214.8-499 m) | 6" (39.5 m) | 6" (272 m) | ||||||||
| 10 5/8” (499-530 m) | ||||||||||
Lithium Argentina AG., 2026 Cauchari-Olaroz S-K 1300 Technical Report Cauchari-Olaroz Salars, Argentina | Page 190 of 418 |
| Table 7.12 Production Well Drilling and Construction Details | ||||||||||
| Pumping Well |
Year |
Total |
Coordinates | Drilling Method |
Drilling |
Well Construction | Construction Material | |||
| X | Y |
Total Length |
Total Length of |
Solid |
Screen | |||||
| W-5 | 2021 | 675 | 7394545 | 3426260 |
Rotary |
27" (0-30 m) | 20" | Carbon Steel | Stainless Steel | |
| 17" (30-211 m) | 10" (143.5 m) | 10" (54 m) | ||||||||
| 13 1/2" (211-675 m) | 6" (65.5 m) | 6" (398 m) | ||||||||
| W-19 | 2021 | 571.2 | 7397593 | 3428178 | Rotary | 27" (0-41 m) | 20" | Carbon Steel | Stainless Steel | |
| 18" (41-223.4 m) | 10" (88.5 m) | 10" (127 m) | ||||||||
| 13 1/2" (223.4-571.2 m) | 6" (33.5 m) | 6" (314 m) | ||||||||
| W-13 | 2021 | 578 | 7397557 | 3427303 | Rotary | 27" (0-33 m) | 20" | Carbon Steel | Stainless Steel | |
| 17 1/2" (33-218 m) | 10" (132 m) | 10" (78 m) | ||||||||
| 12 1/4" (218-578 m) | 6" (72 m) | 6" (286 m) | ||||||||
| W-10 | 2021 | 493 | 7375500 | 3421500 | Rotary | 27" (0-23 m) | 20" | Carbon Steel | Stainless Steel | |
| 17 1/2" (23-218 m) | 10" (159.5 m) | 10" (59 m) | ||||||||
| 12 1/4" (218-490 m) | 6" (111.5 m) | 6" (158 m) | ||||||||
| W-4 | 2021 | 696 | 7399263 | 3428517 | Rotary | 27" (0-12 m) | 20" | Carbon Steel | Stainless Steel | |
| 17 1/2" (12-210 m) | 10" (43.5 m) | 10" (160 m) | ||||||||
| 12 1/4" (210-696 m) | 6" (302.5 m) | 6" (166 m) | ||||||||
| W-42 | 2021 | 416 | 7382929 | 3422340 | Rotary | 27" (0-32 m) | 20" | Carbon Steel | Stainless Steel | |
| 17" (12-245 m) | 10" (154 m) | 10" (84 m) | ||||||||
| 13 1/2" (245-416 m) | 6" (17 m) | 6" (145 m) | ||||||||
| W-31 | 2023 | 650 | 7382440 | 3425495 | Rotary | 26" (0-26.1 m) | 20" | Carbon Steel | Stainless Steel | |
| 19" (26.1-237.5 m) | 12" (128 m) | 12" (102 m) | ||||||||
| 15" (237.5-645.4 m) | 8" (63 m) | 8" (342 m) | ||||||||
| 12 1/4" (645.4-650 m) | ||||||||||
Lithium Argentina AG., 2026 Cauchari-Olaroz S-K 1300 Technical Report Cauchari-Olaroz Salars, Argentina | Page 191 of 418 |
Figure 7.57 Pumping Wells Location
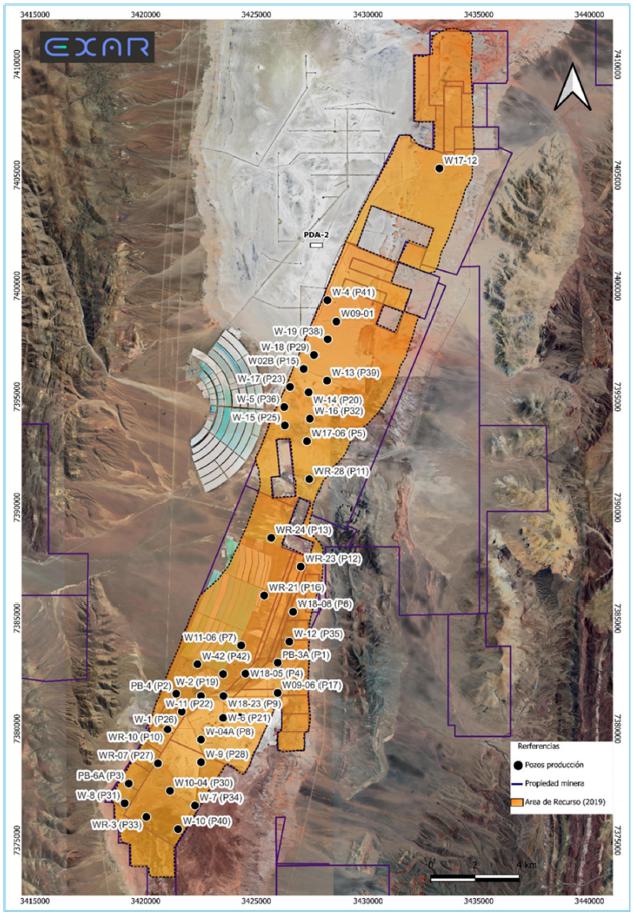
Note: orange area = 2019 Mineral Resource area, black dot = production well, black line = mineral property.
Source: Exar (2024)
Lithium Argentina AG., 2026 Cauchari-Olaroz S-K 1300 Technical Report Cauchari-Olaroz Salars, Argentina | Page 192 of 418 |
| 7.16.5 | Exploration Diamond Drilling (DDH) Borehole and Production Well Drilling Program 2022-2024 |
The objective of this drilling program was to increase knowledge of the southern sector of Cauchari, outside of the previously certified resource area in the basin. In this new sector, three HQ diameter diamond drill holes were advanced, to a maximum depth of 600 m. Relevant information was obtained in terms of lithology, drilling cores, brine sampling and the continuity of deep production levels. The drilling program is summarized in Table 7.13.
To complement this exploration program in order to determine the hydraulic parameters of the area, 6 wells were drilled with the construction characteristics of production wells. These wells reached a depth of 700 m, are cased in 12" for the first 250 m and then in 8" at the bottom. In these wells, pumping tests are currently being carried out to determine the flow rates and chemical composition.
Based on these exploration campaigns, progress was made in understanding the southern sector of the Cauchari basin. Further work will be required to define a new Mineral Resource in the 15,000-ha area known as "Cauchari Sur.” Well details are presented on Table 7.13 and lithological profiles are presented in Figure 7.58 through Figure 7.65. Borehole locations are presented in Figure 7.66.
| 7.16.6 | Conclusion |
The QP, David Burga, determined that the drilling work was done to industry standards and that there were no factors that could materially impact the accuracy and reliability of the results. The drilling work was appropriate to be used in the Mineral Resource Estimate and Mineral Reserve Estimate. The recommendation is made to update the Mineral Resource Estimate and Mineral Reserve Estimate.
Lithium Argentina AG., 2026 Cauchari-Olaroz S-K 1300 Technical Report Cauchari-Olaroz Salars, Argentina | Page 193 of 418 |
| Table 7.13 Borehole Drilling Summary for the DDH and Production Well Drilling Program Conducted in 2022 and 2024 | ||||||||||
| Borehole ID |
Piezometer Name |
Screen Diameter |
Type | Plataform | Contractor | Total Depth (m) |
Screen Top (mbtw) |
Screen Base (mbtw) |
Coordinates | |
| X | Y | |||||||||
| DD19D-05 | 2'' | DDH | DD19D-05 | Conosur | 415 | 41,07 | 410,97 | 3420723 | 7371919 | |
| DD19D-06 | DD19D-06 BIS | 2'' | DDH | DD19D-06 | Conosur | 88 | 12 | 84 | 3422112 | 7368852 |
| DD19D-07 | 8'', 12'' | Rotary | DD19D-07 | Wichi Toledo | 493,7 | 90 | 421 | 3420882 | 7367309 | |
| DD19D-08 | 8'', 12'' | Rotary | DD19D-08 | Wichi Toledo | 624 | 96 | 608 | 3421788 | 7365110 | |
| DD19D-11 | 8'', 12'' | Rotary | DD19D-11 | Wichi Toledo | 706,8 | 72,11 | 700,23 | 3422049 | 7360087 | |
| DD19D-13 | 8'', 12'' | Rotary | DD19D-13 | Wichi Toledo | 465 | 70 | 537 | 3420167 | 7358999 | |
| DD19D-15 | 8'', 12'' | Rotary | DD19D-15 | Wichi Toledo | 652,83 | 66 | 607 | 3419956 | 7356406 | |
| DD19D-26 BIS | DD19D-26 | 8'', 12'' | Rotary | DD19D-26 | Wichi Toledo | 533 | 80 | 524 | 3419508 | 7363138 |
Lithium Argentina AG., 2026 Cauchari-Olaroz S-K 1300 Technical Report Cauchari-Olaroz Salars, Argentina | Page 194 of 418 |
| Figure 7.58 DD19D-05 Lithological Profile | Figure 7.59 DD19D-06 Lithological Profile | |
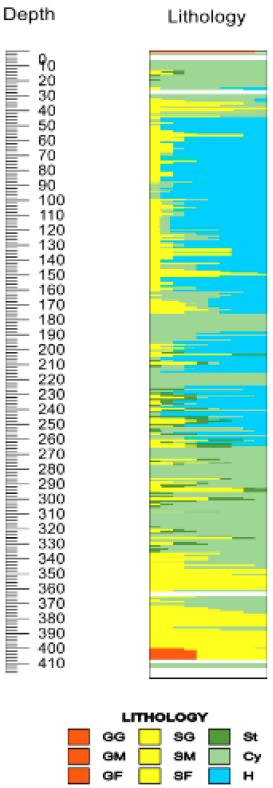 |
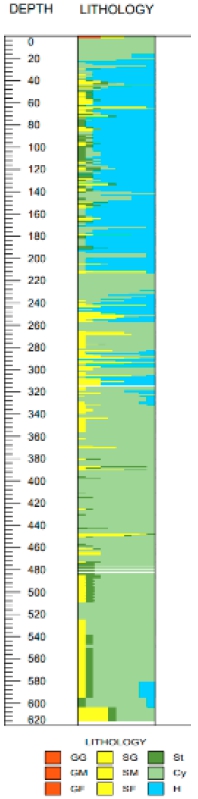 | |
| Source: Exar | Source: Exar |
Lithium Argentina AG., 2026 Cauchari-Olaroz S-K 1300 Technical Report Cauchari-Olaroz Salars, Argentina | Page 195 of 418 |
| Figure 7.60 DD19D-07 Lithological Profile | Figure 7.61 DD19D-08 Lithological Profile | |
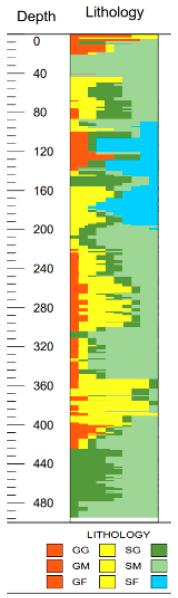 |
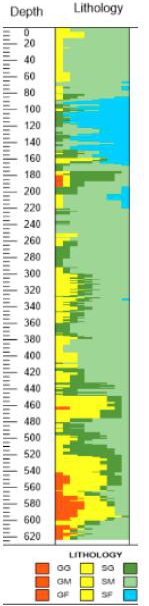 | |
| Source: Exar | Source: Exar |
Lithium Argentina AG., 2026 Cauchari-Olaroz S-K 1300 Technical Report Cauchari-Olaroz Salars, Argentina | Page 196 of 418 |
| Figure 7.62 DD19D-11 Lithological Profile | Figure 7.63 DD19D-13 Lithological Profile | |
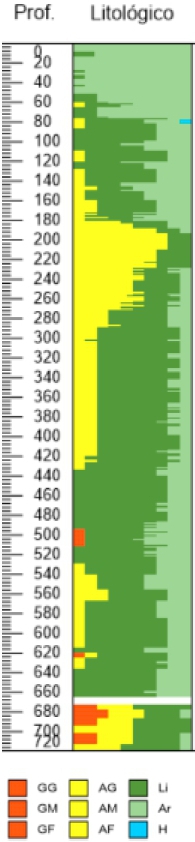 |
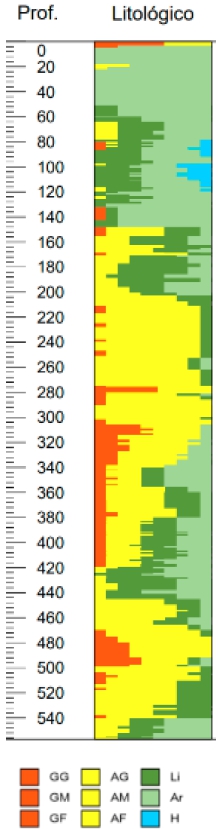 | |
| Source: Exar | Source: Exar |
Lithium Argentina AG., 2026 Cauchari-Olaroz S-K 1300 Technical Report Cauchari-Olaroz Salars, Argentina | Page 197 of 418 |
| Figure 7.64 DD19D-15 Lithological Profile | Figure 7.65 DD19D-26 BIS Lithological Profile | |
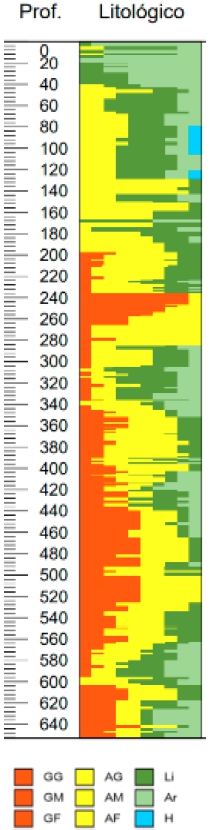 |
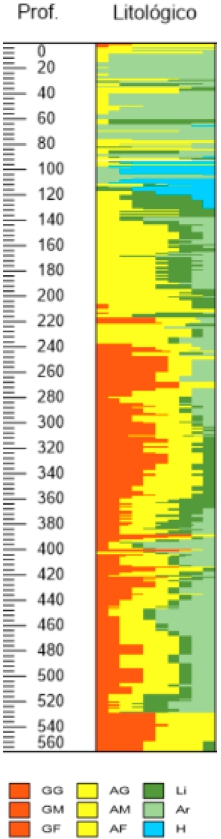 | |
| Source: Exar | Source: Exar |
Lithium Argentina AG., 2026 Cauchari-Olaroz S-K 1300 Technical Report Cauchari-Olaroz Salars, Argentina | Page 198 of 418 |
Figure 7.66 2022-2024 Drill Hole Locations
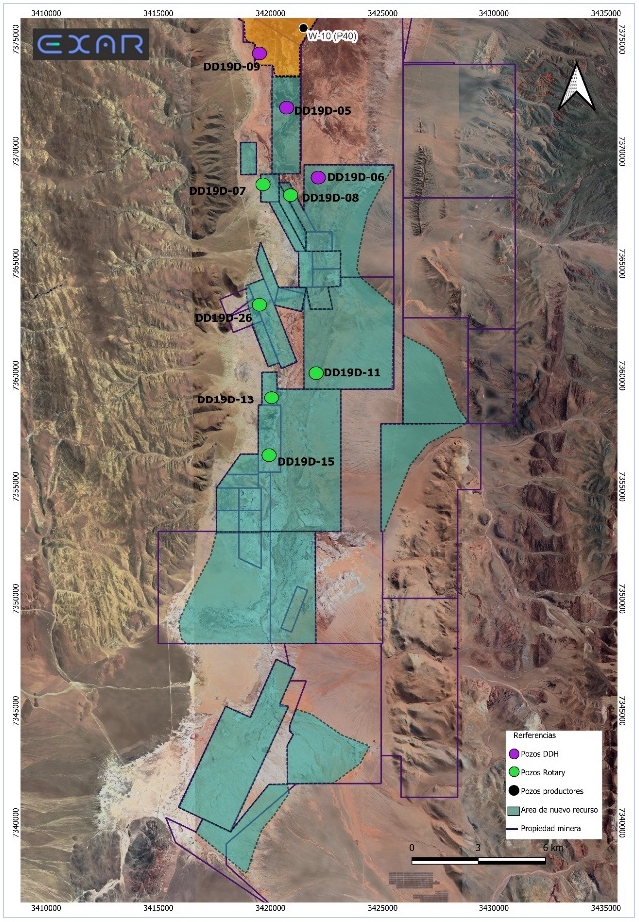
Source: Exar (2024)
Lithium Argentina AG., 2026 Cauchari-Olaroz S-K 1300 Technical Report Cauchari-Olaroz Salars, Argentina | Page 199 of 418 |
| 8.0 | Sample Preparation, Analyses and Security |
| 8.1 | Sampling Method and Approach |
Exar established the following procedures for sample preparation, analyses and security at the Project from 2010 to 2012. These procedures are discussed in the 2017 Feasibility Study, authored by Burga et al. Drilling, brine sampling and pumping tests for the 2017-2019 campaigns were supervised by Exar personnel.
Drilling was subject to daily scrutiny and coordination by Exar geologists. On the drill site, the full drill core boxes are collected daily and brought to the core storage warehouse where the core is laid out, measured, logged for geotechnical and geological data, and photographed.
Core boxes are placed on core racks and covered with a black PVC sheet to protect the integrity of the core and stored outside. RBRC values were not measured during the 2017 to 2018 drilling program, however, 33 drill samples were tested for RBRC during the 2019 drilling campaign and results were in line with other RBRC sampling. The core was well logged to include the lithological data required for the Mineral Resource Estimate.
| 8.2 | Rotary Drilling Sampling Methods |
Rotary drilling was conducted by Hidrotec and Wichi Toledo for the purpose of installing pumping wells for testing purposes. Exar personnel recorded the time it took to advance 1 m and sampled the cuttings by placing them in a rock chip tray (Figure 8.1) and brought back to the field office for logging. Samples were not taken during rotary drilling for chemical analysis.
Lithium Argentina AG., 2026 Cauchari-Olaroz S-K 1300 Technical Report Cauchari-Olaroz Salars, Argentina | Page 200 of 418 |
Figure 8.1 Rock Chip Tray with Dry and Wet Samples
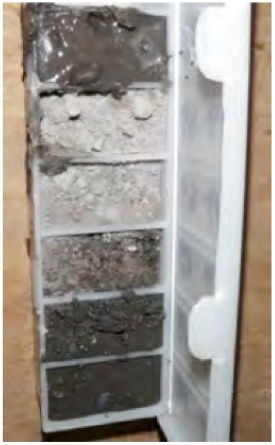
Source: King, Kelley, Abbey, (2012).
| 8.3 | Diamond Drilling Borehole Solids Sampling Methods |
Diamond drilling was performed by Major Drilling and Ideal Drilling. During diamond drilling, PQ or HQ diameter cores were collected through a triple tube sampler. The cores were taken directly from the triple tube and placed in wooden or metal core boxes for geologic logging, sample collection, and storage. During the 2009-2011 drilling, undisturbed geologic samples were collected by driving a two-inch diameter, five inch long PVC sleeve sampler into the core at three meter intervals (Figure 8.2 and Figure 8.3). The DD boreholes were used to help select the pumping well locations.
During the 2009-2011 drilling campaigns, a total of 1,244 undisturbed samples were collected from the cores of DDH-1 through DDH18. Undisturbed samples were shipped to D.B. Stephens & Associates Laboratory in the USA for analysis of geotechnical parameters, including: RBRC (total of 865 samples), particle size (total of 58 samples), and dry bulk density (total of 36 samples). Geotechnical analytical methods are described in Section 8.8.
Lithium Argentina AG., 2026 Cauchari-Olaroz S-K 1300 Technical Report Cauchari-Olaroz Salars, Argentina | Page 201 of 418 |
Figure 8.2 Collecting an Undisturbed Sample
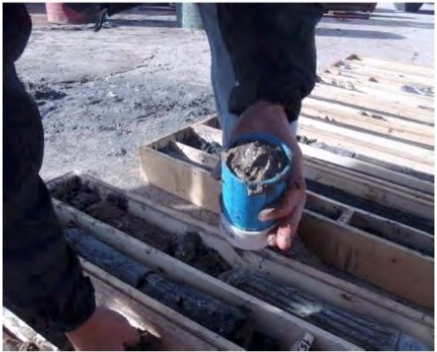
Source: King, Kelley, Abbey, (2012).
Figure 8.3 Collecting an Undisturbed Sample from Core
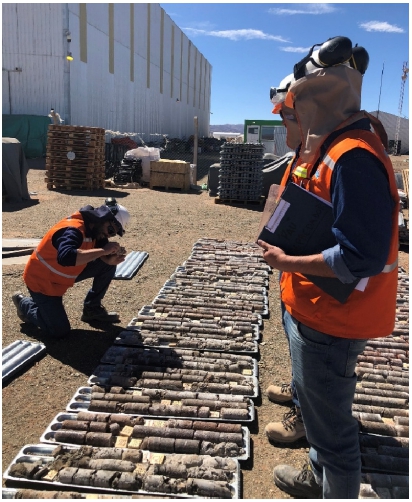
Source: Exar
Lithium Argentina AG., 2026 Cauchari-Olaroz S-K 1300 Technical Report Cauchari-Olaroz Salars, Argentina | Page 202 of 418 |
| 8.4 | Diamond Drilling Borehole Brine Sampling Methods |
Samples were further analyzed in the field laboratory for confirmation of field parameters. After analysis of field laboratory parameters, brine samples were split into three clean 250 ml, clean, plastic sample bottles. The three bottles were tagged with pre-printed tag numbers. Two bottles were used per sample, one for density and one for geochemistry, which was shipped to ASL in Jujuy or sent to the onsite Exar laboratory. One sample was maintained in the Exar field office, as a backup.
| 8.5 | Sampling Preparation, Analysis and Security |
There is an established and firm chain of custody procedure for Project sampling, storage, and shipping. Samples were taken daily from the drill sites and stored at the on-site facility. All brine samples were stored inside a locked office, and all drill cores were stored inside the core storage area on site. Brine samples were taken by Exar staff to the on-site laboratory or transported to Jujuy in a company truck. Solid samples were periodically driven in Project vehicles to Jujuy, approximately three hours from the site. In Jujuy, solid samples were delivered to a courier (DHL) for immediate shipment to the appropriate analytical laboratory.
Brine samples were analyzed by Alex Stewart Argentina S.A. (ASA) and the internal Exar laboratory. ASA is an ISO 9001 and ISO 14001 certified laboratory with facilities in Jujuy and Mendoza, Argentina and headquarters in England. The internal Exar laboratory handles samples from the pilot processing plant and hydrogeology and is not a certified laboratory.
Analytical methods for all brine samples are described in Section 8.6.1. Quality Assurance/Quality Control (QA/QC) for brine samples collected is discussed in Section 9.0.
D.B. Stephens and Associates Laboratory in Albuquerque, New Mexico, USA was used for the geotechnical property analyses of the undisturbed core samples from the DD Borehole Program in the 2009-2011 drilling campaigns. D.B. Stephens and Associates is certified by the U.S. Army Corps of Engineers and is a contract laboratory for the U.S. Geological Survey.
| 8.5.1 | Brine Samples from the Piezometers |
Piezometers were installed for sampling prior to pump testing. These samples were collected at 20 m intervals using bailers. Bailers would be manually lowered to the desired depth, pulled up one meter quickly to fill the bailer then lowered slowly to obtain a sample at the desired depth. Brine from the bailer would be used to rinse out a plastic bucket and then the remainder of the brine would be emptied into the bucket. Brine from the bucket would be used to rinse out three 250 ml bottles before being filled with a sample and marked with the borehole and depth. Back at the field office, samples would be logged into a field book and assigned a unique sample code and any identifying information about the borehole would be removed from the bottle using rubbing alcohol. Data from the logbook is then entered into the sampling database.
Samples were not filtered after collection because the pumping wells produced brine with negligible suspended solids.
Lithium Argentina AG., 2026 Cauchari-Olaroz S-K 1300 Technical Report Cauchari-Olaroz Salars, Argentina | Page 203 of 418 |
| 8.5.2 | Brine Samples from the Pumping Test Program |
In 2017-2019 each well had a pump test to help define the pumping rate and lithium concentration. 2018 pumping production wells helped define the lithium concentration and flow rate in each location where the production wells are being drilled. The first test is well development which lasts for 7 days to clean the well, generally starting with 20 hz, then ramping up to clear the silt and sediment. Prior to taking samples the well is developed to clean all the fine sediments in the area immediately adjacent to the screen. The development lasts from 3 to 7 days. The well is considered developed when the percentage of solids during pumping is less than 0.1 ml measured in an Imhoff cone (Figure 8.4). Measurements are taken with the frequency shown in Table 8.1. The parameters measured include dynamic water level, flow (m3/h), and turbidity. After the test is done, recovery is measured using a water level tape with readings being taken with the same frequency shown in Table 8.1 until 95% recovery is achieved. During and after the pumping tests, technicians measure the drawdown and recovery of nearby wells.
| Table 8.1 Summary Pumping Test Measurement Frequency | |
| Time | Frequency of Sampling |
| 0-5 minutes | Every 30 seconds |
| 5-10 minutes | Every minute |
| 10-30 minutes | Every 2 minutes |
| 30-60 minutes | Every 5 minutes |
| 1 – 2 hours | Every 10 minutes |
| 2 – 3 hours | Every 20 minutes |
| 3 – 4 hours | Every 30 minutes |
| 4 hours – end | Hourly |
Figure 8.4 Measuring Sediment in an Imhoff Cone
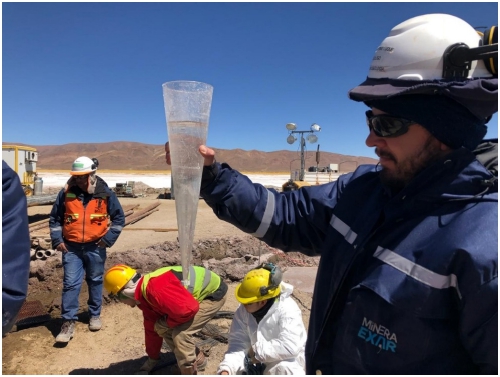
Source: Exar.
Lithium Argentina AG., 2026 Cauchari-Olaroz S-K 1300 Technical Report Cauchari-Olaroz Salars, Argentina | Page 204 of 418 |
Once the water level has recovered to 95%, a short sampling pump test (2-4 hours) is conducted. This test is to find the maximum pumping rate without draining the well. The well is allowed to recover afterwards.
An 8-12 hour, pumping rate test follows, which is broken up into 4 parts at 25% of the maximum pumping rate, 50% of the maximum pumping rate, 75% of the maximum pumping rate and 100% of the maximum pumping rate. This test is to see which rate the well stabilizes at. The well is allowed to recover afterwards.
The final pump test is a constant rate pump test that is conducted for a minimum of 7 days. Water measurements are taken with the same frequency listed on Table 8.1. Brine sampling is done at 10 min, 30 min, 60 min, 2 h, and then every 4 hours to the end of the test. Brine from a valve on the side of the hose coming out of the well would be used to rinse out a plastic bucket and then refilled. Brine from the bucket is used to rinse out three 250 ml bottles before being filled with a sample and marked with the borehole and date. Back at the field office, samples would be logged into a field book and assigned a unique sample code and any identifying information about the borehole is removed from the bottle using rubbing alcohol. Data from the logbook is then entered into the sampling database.
| 8.6 | Brine Analysis |
| 8.6.1 | Analytical Methods |
ASA in Jujuy and the on-site Exar laboratory were the primary laboratories for analysis of brine samples. In order to provide a quick response, ASA used Inductively Coupled Plasma (“ICP”) as the analytical technique for the primary constituents of interest, including sodium, potassium, lithium, calcium, magnesium, and boron. Samples were diluted by 100:1 before analysis. Density was measured via pycnometer and sulphates were measured using the gravimetric method. The argentometric method was used for assaying chloride and volumetric analysis (acid/base titration) was used for carbonates (alkalinity as CaCO3).
In the internal Exar laboratory, a 20 g sample is taken from the 250 ml bottle. The sample is entered into the laboratory database. Sulphates were measured using the gravimetric method and volumetric analysis (acid/base titration) was used for calcium, magnesium and chloride. Brine samples were diluted before being passed through the AA spectrometer which analyzes Li, Na, and K.
A larger laboratory was built on site to handle the increased number of samples to be tested along the production circuit. Once exploration was complete and production commenced, The Company used the internal laboratory exclusively. This resulted in quicker analysis times which allowed for better monitoring of project activities. Samples are taken at the following points:
| · | Production Wells – 1 sample per week; |
| · | Evaporation Ponds – 1 sample per pond per week; |
| · | Liming Plant – 2 samples per day; |
| · | Post Concentration Ponds – 1 composite per week for the first pond with the remaining ponds sampled daily; |
Lithium Argentina AG., 2026 Cauchari-Olaroz S-K 1300 Technical Report Cauchari-Olaroz Salars, Argentina | Page 205 of 418 |
| · | Solvent Extraction – 2 samples per day taken at various points; |
| · | Purification Plant – 2 samples per day; |
| · | KCl Circuit – 2 samples per day; and |
| · | Carbonation – 1 sample taken every 2 tonnes. |
The control room in geology also constantly monitors various points along the process circuit (i.e. – vapor distribution and freshwater pressure) and can inform the appropriate group if specifications are not being met.
The laboratory can process 100-150 samples per day. A Laboratory Information Management System was installed in 2020.
| 8.6.2 | Sample Security |
There is an established and firm chain of custody procedure for Project sampling, storage and shipping. Samples were taken daily from the drill sites and stored at the core storage facility on site. Brine samples are taken by Exar personnel to the on-site analytical laboratory or by truck to the Alex Stewart facility in Jujuy.
| 8.7 | Sample Preparation Analysis and Security Conclusions and Recommendations |
The field sampling, preparation, security, and analysis of drill core and brines from the piezometers and pumping tests and production wells are adequate and are being executed to industry standards. Security procedures are adequate for the sampling program. The recommendation is made that sample books with dedicated tickets be used for future sampling. It is also recommended that a separate building be dedicated to the storage of the duplicate sample bottles and that a selection of samples of low, medium, and high-grade lithium be submitted to Alex Stewart for analysis.
The Company was ISO 9001 certified in 2023, but this certification expired in 2024. The recommendation is made for the Exar internal lab to seek ISO 17025 certification for analytical laboratories.
| 8.8 | Geotechnical Analysis |
| 8.8.1 | Overview |
D.B. Stephens and Associates Laboratory carried out selected geotechnical analyses on undisturbed samples from the geologic cores (DDH-1 through DDH-18), from the 2009-2011 drilling campaigns as summarized in Table 8.2. RBRC results were used in the Resource Estimate (King, 2010b) to estimate the volume of recoverable brine present in various geological materials. 33 RBRC samples were taken from DD19D_PE09 from the 2019 drilling campaigns.
Lithium Argentina AG., 2026 Cauchari-Olaroz S-K 1300 Technical Report Cauchari-Olaroz Salars, Argentina | Page 206 of 418 |
| Table 8.2 Summary of Geotechnical Property Analyses | |
| Analysis | Procedure |
| Dry bulk density | ASTM D6836 |
| Moisture content | ASTM D2216, ASTM D6836 |
| Total porosity | ASTM D6836 |
| Specific gravity (fine grained) | ASTM D854 |
| Specific gravity (coarse grained) | ASTM C127 |
| Particle size analyses | ASTM D422 |
| Relative brine release capacity | Developed by D.B. Stephens (see Section 8.9.2) |
| 8.9 | Analytical Methods |
Results of dry bulk density, moisture content, and total porosity are geotechnical parameters and are not used in the Mineral Resource and Reserve Estimates. The results of those tests are not discussed here.
| 8.9.1 | Specific Gravity |
Specific gravity testing was conducted for four formation samples (012714, 012715, 012716, and 012743). Density results for these samples ranged from 2.47 g/cm3 to 2.75 g/cm3. It was subsequently determined that these values could be skewed due to the high salt content. Consequently, no attempt was made to apply these measured values to the remaining samples, and an assumed particle density of 2.65 g/cm3 was used for all other samples.
| 8.9.2 | Relative Brine Release Capacity (RBRC) |
The RBRC method was developed by D.B. Stephens and Associates Laboratory, in response to some of the unique technical challenges in determining porosity for brine-saturated samples (Stormont, et al., 2010). The method predicts the volume of solution that can be readily extracted from an unstressed geologic sample.
According to the RBRC method, undisturbed samples are saturated in the laboratory using a site- specific brine solution. The bottom of the sample is then attached to a vacuum pump using tubing and permeable end caps and are subjected to a suction of 0.2 to 0.3 bars for 18 to 24 hours. The top of the sample is fitted with a perforated latex membrane that limits atmospheric air contact with the sample, to avoid evaporation and precipitation of salts. Depending on the pore structure of the material, there may be sufficient drainage so that a continuous air phase is established through the sample. The vacuum system permits testing multiple samples simultaneously in parallel. After extraction, the samples are oven dried at 110°C.
The volumetric moisture (brine) content of the sample is calculated based on the density of the brine, the sample mas`s at saturation, and the sample mass at “vacuum dry”. The difference between the volumetric moisture (brine) content of the saturated sample and the volumetric moisture (brine) content of the ‘vacuum dry’ sample is the specific yield or “relative brine release capacity”.
Lithium Argentina AG., 2026 Cauchari-Olaroz S-K 1300 Technical Report Cauchari-Olaroz Salars, Argentina | Page 207 of 418 |
RBRC test samples are taken in the field during drilling. Mr. Burga was not present on site at the time that RBRC sampling was being conducted and could not obtain a sample for verification purposes. Once the samples dry and the salts in the brine precipitate, the characteristics of the sample change and cannot be relied upon. D.B. Stephens and Associates Laboratory is an independent laboratory, and results were obtained directly from the laboratory for verification purposes. No errors were noted.
| 8.9.3 | Particle Size Analysis |
Particle size analyses were carried out on 58 undisturbed samples after the drainable porosity testing was completed. Uniformity and curvature coefficients (Cu and Cc) were calculated for each sample and samples were classified according to the USDA soil classification system.
| 8.9.4 | Exar Porosity Test Lab |
In addition to the on-site analytical laboratory, the Project site also has a porosity test lab. This lab tests total porosity (as opposed to drainable porosity) which helps to distinguish between types of halites and clays and silts. Samples dried in an oven at 70 degrees Celsius, weighed, measured, and then put through a gas pycnometer. Volume, porosity, and density are obtained. Samples are photographed and given a bar code, and the equipment is calibrated at the end of each day.
The lab also conducts grain size analysis on the gravel pack used by the drillers for well construction.
It should be noted that results from the Exar Porosity Test Lab have not been used for Mineral Reserve Estimate Purposes (porosity values are not considered in the Mineral Resource Estimate).
The Exar Porosity Test Lab was no longer operational in 2024.
Lithium Argentina AG., 2026 Cauchari-Olaroz S-K 1300 Technical Report Cauchari-Olaroz Salars, Argentina | Page 208 of 418 |
| 9.0 | DATA Verification |
| 9.1 | Overview |
The Data Verification for data obtained prior to the 2017-2019 drilling campaigns is elaborated in the 2017 Feasibility study (Burga et al., 2017).
| 9.2 | Site Visits |
Mr. D. Burga visited the site and the Exar office on January 24 and 25, 2017, February 18-21, 2019, and June 10-12, 2019. Project features inspected and reviewed during these visits, which are relevant to data verification, included the following:
| · | Several drill hole locations were visited, and several active pumps were observed; |
| · | 27 brine samples were obtained from 13 wells |
| · | 5 duplicate samples were taken from the sample storage tent; |
| · | 4 standard samples were collected for analysis; |
| · | Review of Exar sampling procedures; |
| · | Inspection of the 2017-2019 Project database; |
| · | Inspection of digital laboratory certificates for the Exar brine dataset, and the Project database; |
| · | The sample storage facility and security systems were observed and are considered appropriate; and |
| · | Tours of the Exar Analytical Lab and the Exar Grain Size Analysis were conducted. |
Mr. D. Burga conducted interviews with Exar employees who were present during the drilling and pump testing of the new wells.
Digital copies of the lab certificates were obtained directly from Alex Stewart and compared to the Exar database.
Mr. D. Burga visited the site and the Exar office between November 19 and 25, 2024. Project features inspected and reviewed during these visits, which are relevant to data verification, included the following:
| · | One production well (P26) was observed; |
| · | Tour of Production Well Control Room; |
| · | Review of Exar sampling procedures; |
| · | Inspection of the 2019-2024 Project database; |
Lithium Argentina AG., 2026 Cauchari-Olaroz S-K 1300 Technical Report Cauchari-Olaroz Salars, Argentina | Page 209 of 418 |
| · | Inspection of digital laboratory certificates for the Exar brine dataset, and the Project database; |
| · | The sample storage facility and security systems were observed and are considered appropriate; and |
| · | Tour of the Exar Analytical Lab was conducted. |
Digital copies of the lab certificates were obtained directly from Exar laboratory and compared to the database.
| 9.3 | February 2019 Site Visit and Due Diligence Sampling |
Mr. D. Burga collected 23 brine samples during his site visit from 10 wells during the site visit. Each sample consisted of three 250 ml plastic bottles. 4 samples were taken from pumping well sites (PB-06, W18-05, W11-06, and PB-03). For the pumping well samples, a valve was opened on the main pipe coming out of the well, a plastic pail was rinsed with brine, filled again and then the brine was used to rinse out each sample bottle before being filled with the sample. 19 samples were taken from various depths in six different observation piezometers (DL-014, ML-014, DL-005, W-05, DL-09, and ML-09). A bailer was lowered to the desired depth, pulled up a meter and lowered again to obtain a sample at that depth then pulled back to the surface. A small amount of brine was used to rinse out a plastic pail and then dumped out and the remainder of the brine from the bailer was emptied into the pail. Each bottle was marked with the well and depth and brought back to field office where each sample was given a sample code, entered into a logbook and identifying well information was removed from the sample bottles with rubbing alcohol.
The samples were taken by Mr. Burga directly to Alex Stewart Laboratories in Jujuy for chemical analysis. The samples were analyzed for lithium using and ICP with an OES finish.
Results of the site visit due diligence samples are listed in Table 9.1 and presented graphically in Figure 9.1.
| Table 9.1 Results of Due Diligence Sampling – February 2019 | ||||
|
ACSI |
Well |
Depth |
Li (mg/L) |
Li (mg/L) |
| SBH-440 | PB-06A | - | 537 | 580 |
| SBH-441 | W18-05 | - | 760 | 750 |
| SBH-442 | W11-06 | - | 753 | 750 |
| SBH-443 | PB-03A | - | 784 | 772 |
| SBH-444 | DL-014 | 100 | 565 | 548 |
| SBH-445 | DL-014 | 200 | 689 | 430 |
| SBH-446 | DL-014 | 300 | 631 | 464 |
| SBH-447 | DL-014 | 370 | 564 | 440 |
| SBH-448 | ML-014 | 100 | 387 | 548 |
| SBH-449 | ML-014 | 115 | 721 | 449 |
| SBH-450 | DL-005 | 100 | 763 | 686 |
| SBH-451 | DL-005 | 200 | 717 | 685 |
Lithium Argentina AG., 2026 Cauchari-Olaroz S-K 1300 Technical Report Cauchari-Olaroz Salars, Argentina | Page 210 of 418 |
| Table 9.1 Results of Due Diligence Sampling – February 2019 | ||||
|
ACSI |
Well |
Depth |
Li (mg/L) |
Li (mg/L) |
| SBH-452 | DL-005 | 300 | 833 | 696 |
| SBH-453 | DL-005 | 320 | 979 | 699 |
| SBH-454 | W-05 | 100 | 973 | 686 |
| SBH-455 | W-05 | 200 | 639 | 685 |
| SBH-456 | W-05 | 300 | 375 | 696 |
| SBH-457 | ML-09 | 100 | 859 | 801 |
| SBH-458 | ML-09 | 200 | 817 | 559 |
| SBH-459 | DL-09 | 100 | 676 | 757 |
| SBH-460 | DL-09 | 200 | 685 | 769 |
| SBH-461 | DL-09 | 300 | 669 | 681 |
| SBH-462 | DL-09 | 400 | 626 | 780 |
Figure 9.1 Due Diligence Sample Results for Lithium: February 2019
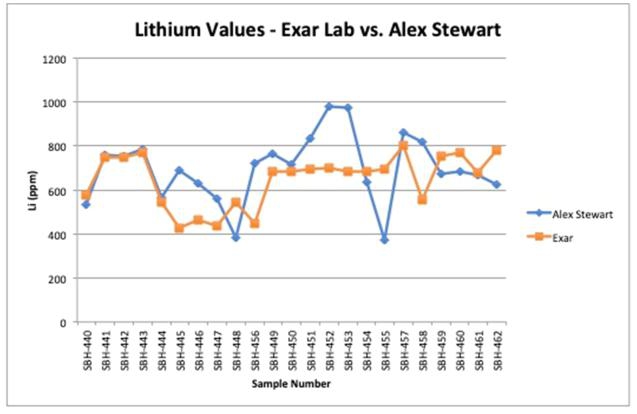
The results for the due diligence sampling were similar in tenor between ASA and the internal Exar laboratories, with the samples from ASA being higher than the Exar labs in 16 of 23 samples. During the on-site interviews one of the hydrogeologists indicated that sample SBH456 was taken at the bottom of an observation well that had drillers mud in it that would have settled at the bottom, because of its density, thus diluting the sample. This is a possible explanation for the difference, the Exar sample had 696 mg/L Li and the ASA sample taken by ACSI had 375 mg/L.
Lithium Argentina AG., 2026 Cauchari-Olaroz S-K 1300 Technical Report Cauchari-Olaroz Salars, Argentina | Page 211 of 418 |
| 9.4 | June 2019 Site Visit and Due Diligence Sampling |
Mr. D. Burga collected four (4) brine samples from four (4) wells during his site visit. Five (5) samples were duplicate samples taken from the sample storage tent and 4 samples were taken of the standards used by the Exar laboratory. Each sample consisted of two 250 ml plastic bottles. 4 samples were taken from pumping well sites (W11-06, WR-10, W18-23, and W-04A). For the pumping well samples, a valve was opened on the main pipe coming out of the well, a plastic pail was rinsed with brine, filled again and then the brine was used to rinse out each sample bottle before being filled with brine.
The duplicate samples and standard samples were selected from the sample storage tent. It should be noted that the samples are stored on shelves and the area is not temperature controlled in any way. Older duplicate bottles, which have been exposed to colder temperatures for more time, showed evidence of sulphate precipitation. These samples would not be suitable for duplicate analysis.
The standard samples were created at the internal Exar laboratory as elaborated in Section 9.7.
All bottles were brought back to field office where each sample was given a sample code, entered into a logbook and identifying well information was removed from the sample bottles with rubbing alcohol. In the case of the duplicates, the old stickers were removed from the bottles and replaced with a new sample number.
The samples were taken by Mr. Burga directly to Alex Stewart Laboratories in Jujuy for chemical analysis. The samples were analyzed for lithium using and ICP with an OES finish.
Results of the site visit due diligence samples are listed in Table 9.2 and presented graphically in Figure 9.2.
| Table 9.2 Results of Due Diligence Sampling – June 2019 | ||||
|
ACSI |
Well |
Depth |
Li (mg/L) |
Li (mg/L) |
| SBH-922 | - | - | 119 | 126.84 |
| SBH-923 | - | - | 118 | 126.84 |
| SBH-924 | - | - | 116 | 116.38 |
| SBH-926 | - | - | 1151 | 1238.00 |
| SBH-927 | - | - | 948 | 1027.00 |
| SBH-928 | - | - | 752 | 815.00 |
| SBH-929 | - | - | 553 | 671.00 |
| SBH-930 | W11-06 | - | 770 | 716.61 |
| SBH-931 | WR-10 | - | 680 | 604.18 |
| SBH-932 | W18-23 | - | 727 | 682.85 |
| SBH-933 | W-04A | - | 647 | 615.06 |
Lithium Argentina AG., 2026 Cauchari-Olaroz S-K 1300 Technical Report Cauchari-Olaroz Salars, Argentina | Page 212 of 418 |
Figure 9.2 Due Diligence Sample Results for Lithium: June 2019
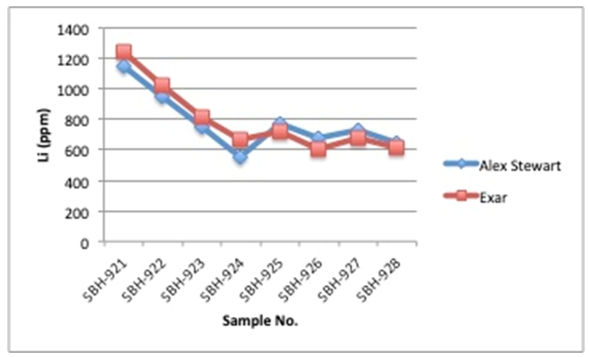
| 9.5 | Quality Assurance/Quality Control Program |
Exar implemented and monitored a thorough quality assurance and quality control program (QA/QC or QC) for the brine sampling undertaken at the Project over the 2017-2018 period. QA/QC protocol included the insertion of QC samples into every batch of samples. QC samples included one standard, one blank and one field duplicate. Check assaying is also conducted on the samples at a frequency of approximately 5%.
A total of 4,356 samples, including QC samples, were submitted during Exar’s brine sampling program at the Project (2017 through the end of 2018), as shown in Table 9.3. A total of 164 check samples were also submitted to an external laboratory for check assaying.
| Table 9.3 QA/QC Sampling | ||
| Samples |
No. of |
Percentage |
| Blanks | 63 | 1.5% |
| Standards | 618 | 14.2% |
| Duplicates | 285 | 6.5% |
| Normal | 3,390 | 77.8% |
| Total | 4,356 | 100% |
| Check Samples | 164 | 2.51% |
Lithium Argentina AG., 2026 Cauchari-Olaroz S-K 1300 Technical Report Cauchari-Olaroz Salars, Argentina | Page 213 of 418 |
| 9.6 | Performance of Blank Samples |
Blank samples were inserted to monitor possible contamination during both preparation and analysis of the samples in the laboratory. The blank material used was initially distilled water and then switched to tap water which is sourced from a freshwater well that contains trace amounts of lithium.
Blank samples should be inserted at an average rate of approximately 1 in 120 samples, with a total of 63 blank samples submitted accounting for 1.5% of the samples submitted. Three of the samples were submitted to ASA with the remainder of the samples submitted to the internal Exar laboratory.
At the time of the site visit there was not a set of Standard Operating Procedures that set tolerance limits for QA/QC samples. It is recommended that the tolerance limit used for the blank samples be 2 times the minimum detection limit (mdl) for the internal Exar AA samples and 10 times the lower detection limit for ASA AA samples (the Exar lab uses AA with a mdl 10 mg/L and ASA uses AA with a mdl 1 mg/L). It should be noted that at times the Exar laboratory used 10, 1, 0 and -10 mg/l as the lower limit depending on dilution used. ASA used -1 mg/L denoting dilution at the sample preparation stage.
The results of the blank sampling are shown graphically in Figure 9.3. There were no failures for the blank samples.
Figure 9.3 Performance of Lithium Blank Samples
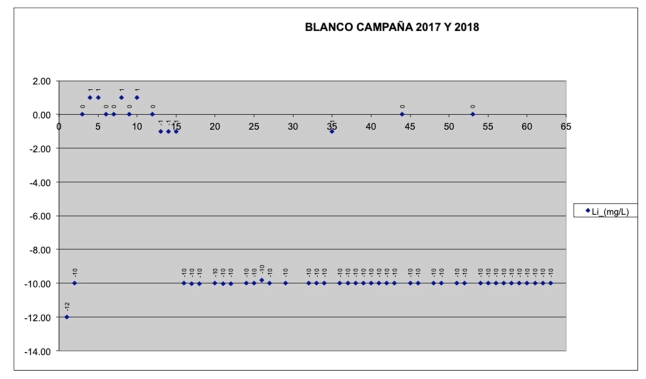
Lithium Argentina AG., 2026 Cauchari-Olaroz S-K 1300 Technical Report Cauchari-Olaroz Salars, Argentina | Page 214 of 418 |
| 9.7 | Certified Reference Materials |
Certified Reference Materials ("CRM”) are used to monitor the accuracy of a laboratory. Exar did not use CRM for their QA/QC sampling program. Standards (“Patrons”) were prepared at the uncertified on-site laboratory by Exar staff and were submitted at an average frequency of 1 in 7 samples. These Patrons were prepared by taking high-grade lithium brines and diluting them to prepare high, medium, and low-grade samples. These Patrons were prepared in 50 L batches and when they were used up a subsequent batch was prepared. The first round of Patron samples were analyzed solely at the Exar laboratory. The second and third rounds of Patron samples were analyzed at both the Exar and ASA laboratories. At the time of this report, the third round of Patron samples was being used. A total of 545 standards were used during the 2017-2019 drilling campaigns. The standards/Patrons’ results are summarized in Table 9.4.
| Table 9.4 Results of Due Diligence Sampling |
| Round 1 – Created March 2017 |
| Name | Target Value (mg/L) |
Lab Exar Value (mg/L) |
Avg of All Samples |
| Patron A | 1,500 | 1,345 | 1,382 |
| Patron B | 1,100 | 1,144 | 1,163 |
| Patron C | 850 | 876 | 894 |
| Standard A | 550 | 579 | 615 |
| Round 2 – Created April 2018 | |||
| Name | Target Value (mg/L) |
Lab Exar Value (mg/L) |
ASA Value |
| Patron AA | 1,200 | 1,151 | 1,121 |
| Patron BB | 1,000 | 923 | 933 |
| Patron CC | 750 | 751 | 740 |
| Patron DD | 540 | 523 | 542 |
| Round 3 – Created October 2018 | |||
| Name | Target Value (mg/L) |
Lab Exar Value (mg/L) |
ASA Value |
| Patron 1 | 540 | 528 | - |
| Patron 2 | 770 | 804 | - |
| Patron 3 | 1,000 | 1,152 | - |
| Patron 4 | 1,200 | 1,296 | - |
For the purposes of the QA/QC review, all of the Exar samples for each Patron were averaged to find a mean value and standard deviation. Patrons were submitted randomly in the sample stream and were plotted as a different series to check bias with regards to the Exar results. The results for each Patron are shown graphically in Figure 9.4 through to Figure 9.11.
Lithium Argentina AG., 2026 Cauchari-Olaroz S-K 1300 Technical Report Cauchari-Olaroz Salars, Argentina | Page 215 of 418 |
Figure 9.4 Performance of Patron A
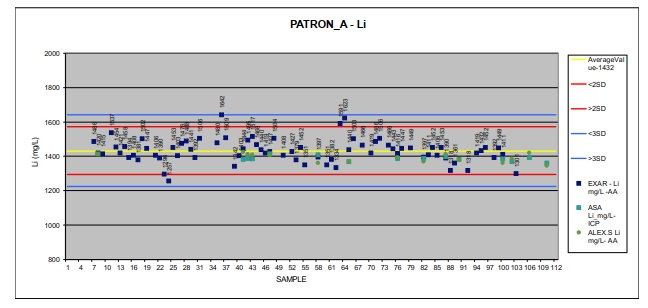
Figure 9.5 Performance of Patron B
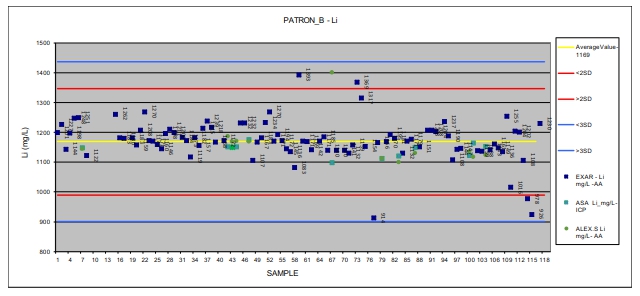
Lithium Argentina AG., 2026 Cauchari-Olaroz S-K 1300 Technical Report Cauchari-Olaroz Salars, Argentina | Page 216 of 418 |
Figure 9.6 Performance of Patron C
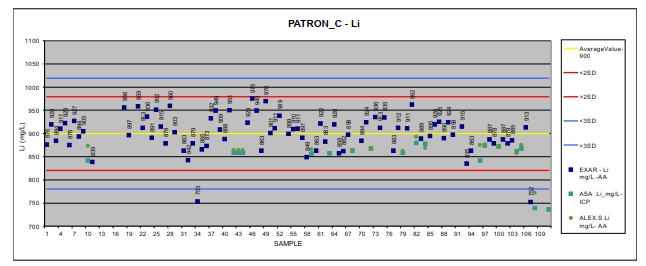
Figure 9.7 Performance of Standard A
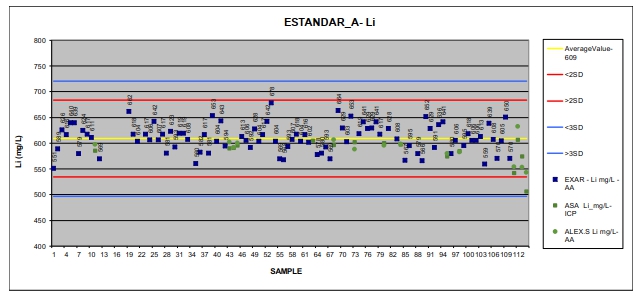
Lithium Argentina AG., 2026 Cauchari-Olaroz S-K 1300 Technical Report Cauchari-Olaroz Salars, Argentina | Page 217 of 418 |
Figure 9.8 Performance of Patron AA
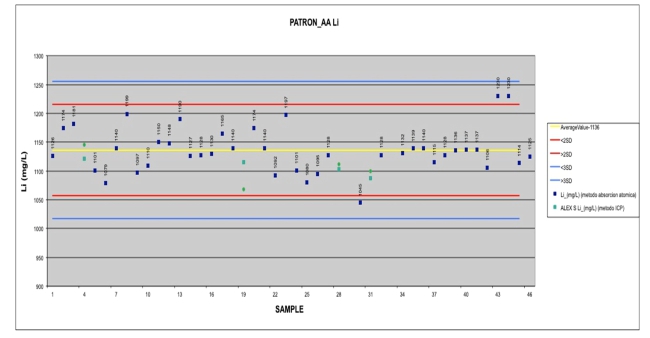
Figure 9.9 Performance of Patron BB
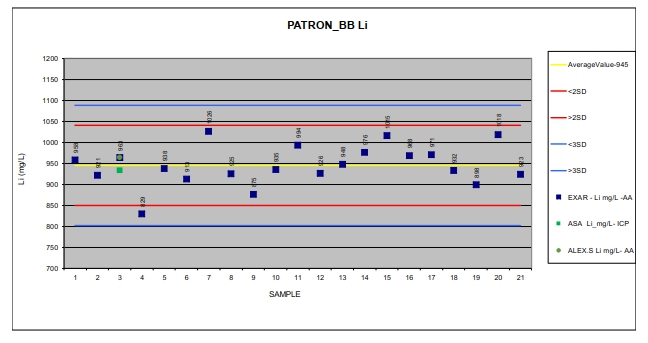
Lithium Argentina AG., 2026 Cauchari-Olaroz S-K 1300 Technical Report Cauchari-Olaroz Salars, Argentina | Page 218 of 418 |
Figure 9.10 Performance of Patron CC
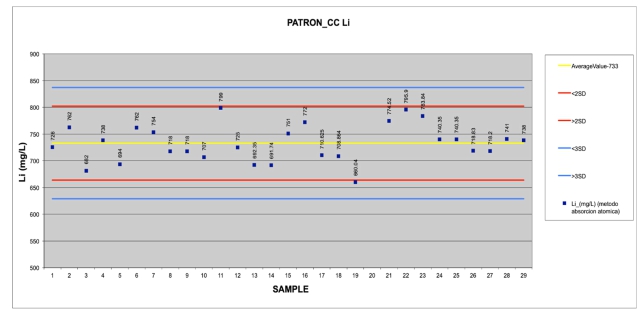
Figure 9.11 Performance of Standard AA
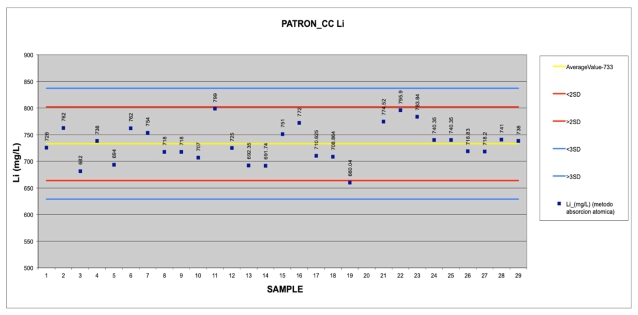
Although there were no Standard Operating Procedures in place, a failure should be considered a result that is greater than +/- 3 standard deviations. None of the results for the standards were outside of this range indicating consistent results from the Exar laboratory. As seen in Figure 9.4, Figure 9.5, Figure 9.6, and Figure 9.8, the analytical results for lithium from Alex Stewart, for both AA and ICP, were slightly below the average.
Lithium Argentina AG., 2026 Cauchari-Olaroz S-K 1300 Technical Report Cauchari-Olaroz Salars, Argentina | Page 219 of 418 |
| 9.8 | Duplicates |
As part of their regular QA/QC program, Exar routinely used duplicate samples to monitor potential mixing up of samples and data precision. Duplicate samples were collected in the field by Exar personnel and preparation involved filling an additional three bottles of brine at the same depth. The original and duplicate samples were tagged with consecutive sample numbers and sent to the laboratory as separate samples. Duplicate samples were collected at a rate of approximately 1 in 20 samples.
A total of 285 duplicate samples were taken representing 6.5% of total samples.
The results of duplicate sampling are shown graphically in Figure 9.12. Data precision was strong with a correlation coefficient value of 0.99143.
Figure 9.12 Duplicate Samples – Exar Laboratory
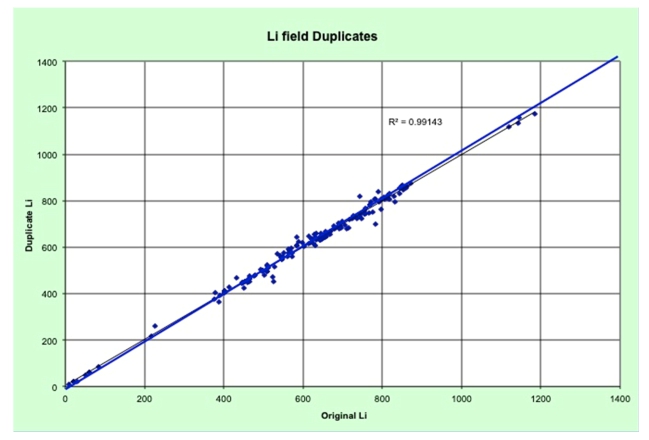
| 9.9 | Check Assays Exar Versus Alex Stewart |
Exar routinely conducted check analyses at ASA to evaluate the accuracy of the Exar laboratory.
Duplicate samples were collected and sent to a second laboratory to verify the original assays and monitor any possible deviation due to sample handling and laboratory procedures. Exar uses the ASA laboratory in Jujuy, Argentina, for check analyses.
Lithium Argentina AG., 2026 Cauchari-Olaroz S-K 1300 Technical Report Cauchari-Olaroz Salars, Argentina | Page 220 of 418 |
A total of 105 check samples were sent to a third-party laboratory for check analysis, equating to approximately 2.5% of the total samples taken during the sampling program.
Correlation coefficient is high (0.95471) for Lithium, showing strong overall agreement between the original Exar analysis and the ASA check analysis.
The results of the check sampling program are shown by way of scatter diagrams in Figure 9.13.
Figure 9.13 Check Assays – Exar Laboratory Versus ASA Laboratories
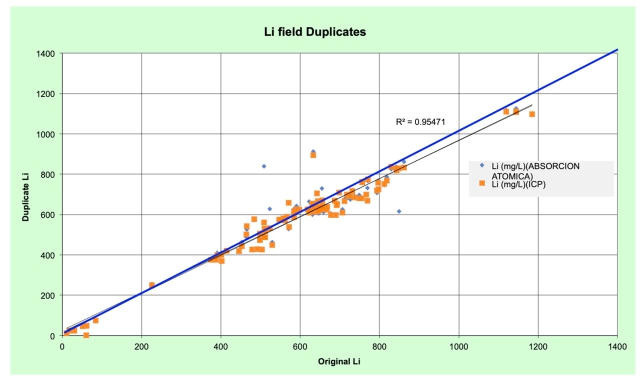
The Company sent duplicates of production well samples to Alex Stewart to check the accuracy of analysis conducted at the Exar Laboratory located on site. This work was done until the end of 2023 and then production well samples were analyzed exclusively at the Exar Laboratory.
An example of check assays from November 2023 are presented in Table 9.5 and presented on Figure 9.14.
Lithium Argentina AG., 2026 Cauchari-Olaroz S-K 1300 Technical Report Cauchari-Olaroz Salars, Argentina | Page 221 of 418 |
| Table 9.5 Check Assay Sampling | ||
| Well |
Li - Exar Lab (ppm) |
Li – Alex Stewart (ppm) |
| PB-4 | 585 | 595 |
| WR-28 | 454 | 453 |
| W09-06 | 911 | 887 |
| W-14 | 632 | 646 |
| CW-60 | 22 | 18 |
Figure 9.14 Check Assays – Exar Laboratory Versus ASA Laboratories – November 2023
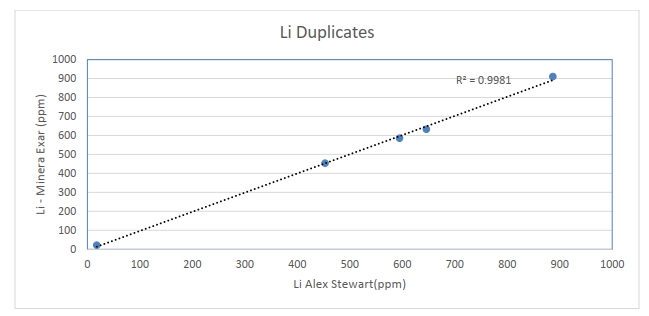
| 9.10 | 2024 QA/QC Procedures |
In January of 2024, due to the number of samples collected and the laboratory workload, Exar made the decision to stop using standards, blanks and duplicates. The team generated new QA/QC procedures that used well sample averages as a reference. The process identifies three standard deviations for each well and samples that fall outside of two standard deviations requires a sample reanalysis. It was observed that well lithium values remained stable over time and that the laboratory’s error rate was low. An example of the lithium values is presented on Figure 12-15.
Lithium Argentina AG., 2026 Cauchari-Olaroz S-K 1300 Technical Report Cauchari-Olaroz Salars, Argentina | Page 222 of 418 |
Figure 9.15 Lithium Values in Well PB-4 2020-2025
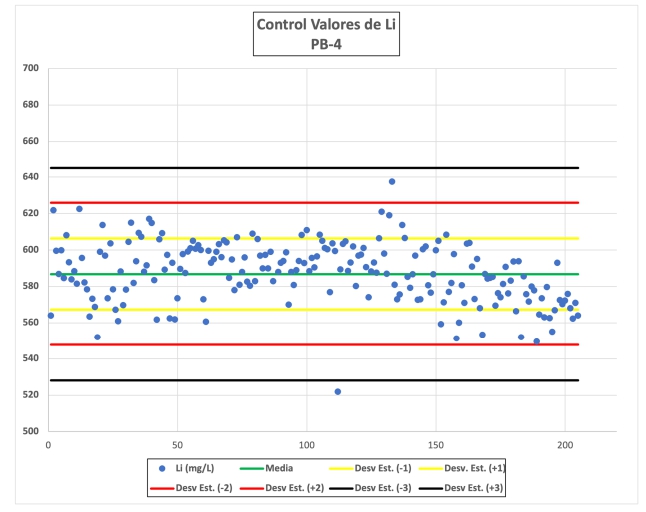
| 9.11 | Conclusions and Recommendations |
Mr. David Burga has personally met, and had technical discussions with, most of the technical experts working on the Project on behalf of LAR. These individuals are competent professionals, with experience within their respective disciplines. Their interpretations demonstrate a conservative approach in assigning constraints on the estimate, which increases the technical strength of the results.
The field sampling of brines from the pumping tests is being done to industry standards. The quality control data based upon the insertion of standards, field blanks and field duplicates indicate that the analytical data is accurate, and the samples being analyzed are representative of the brine within the aquifer.
It is the QP’s opinion that the data is adequate for the purpose used in this report.
Lithium Argentina AG., 2026 Cauchari-Olaroz S-K 1300 Technical Report Cauchari-Olaroz Salars, Argentina | Page 223 of 418 |
The following recommendations are made with regards to QA/QC procedures:
| · | Proper certified lithium standards, with values comparable to the grades found on site, should continue to be used for the exploration brine sampling. |
| · | Exploration samples should continue to be sent Alex Stewart. |
| · | Verification sampling should be conducted prior to creating a Mineral Resource Estimate on the expansion area in 2026. |
| · | The Exar internal laboratory should seek ISO 17025 certification for analytical laboratories. |
Lithium Argentina AG., 2026 Cauchari-Olaroz S-K 1300 Technical Report Cauchari-Olaroz Salars, Argentina | Page 224 of 418 |
| 10.0 | Mineral Processing and Metallurgical Testing |
In the 2012 Feasibility Study, LAR developed a process model for converting brine to lithium carbonate based on evaporation and metallurgical testing. The proposed process followed industry standards:
| · | Pumping brine from the aquifers; | |
| · | Concentrating the brine through evaporation ponds; and | |
| · | Taking the brine concentrate through a hydrometallurgical facility to produce high-grade lithium carbonate. |
The 2012 process model employed proprietary, state-of-the-art physiochemical estimation methods, and process simulation techniques for electrolyte phase equilibrium. From the execution of the Shareholders Agreement between LAR and SQM in 2016 until October 2018, SQM advanced the process engineering work, employing their proprietary technology and operational experience. In 2018, SQM left the joint venture and the Project, and LAR and Ganfeng reviewed the process and design of the plant for 40,000 tpa output with an engineering consulting firm. The revised process work was implemented in the plant design, and it is reflected in this study. The basis of the process methods had been tested and supported by laboratory evaporation and metallurgical test work.
Multiple additional tests were conducted in different qualified laboratories and in pilot facilities located at the Project site to develop a brine processing methodology. Testing objectives included:
| · | Determine the evaporation path as the brine gets more concentrated and determine the type of salts which are formed during the process. |
| · | Determine the amount of CaO required to accomplish Mg, SO4 and B reduction in the evaporation process. |
| · | A trade off between yield and the maximum allowable and attainable lithium concentration throughout the evaporation train. |
| · | Complete the testing and design of the Boron solvent extraction facility with a performance guarantee supplied by the equipment vendor. |
| · | Determine the reactant consumption and conditions for brine purification. |
| · | Investigate ion exchange equipment, resins and operating conditions for impurity removal. |
| · | Specify the KCl removal system in terms of design and operating conditions. |
| · | Determine the carbonation conditions for lithium carbonate to produce high purity product. |
The following outlines the testing work completed during the previous 2012 Feasibility Study and current updated progress that is the basis for this revised Technical Report.
Lithium Argentina AG., 2026 Cauchari-Olaroz S-K 1300 Technical Report Cauchari-Olaroz Salars, Argentina | Page 225 of 418 |
| 10.1 | Pond Tests – Universidad De Antofagasta, Chile |
In late 2010 and early 2011, Universidad de Antofagasta (Chile) conducted evaporation testing on raw, CaO-treated and CaCl2-treated brines. CaCl2 was used in addition to CaO to determine the most cost-effective removal of sulphate ions. A temperature-regulated and air flow-regulated evaporation chamber was used (Figure 10.1). The brine is contained in the tubs in the base of the chamber, while heat lamps (shown top left) are used to simulate solar radiation. Dry, cool air is circulated through the chamber using an electric fan to simulate the environment expected at the site. Digital thermometers are shown in the pan. Samples of the brine and salt were taken to determine the change in salt precipitated from the brine during natural evaporation. These samples were analyzed for composition.
The site is located at more than 4,000 m above sea level. To simulate the effect of lower air pressure, a series of dry air, negative pressure evaporation tests were carried out in parallel with the evaporation pans. The negative pressure test apparatus is shown in Figure 10.2. These tests were done to simulate the effect of brine evaporation at elevation under natural conditions.
Figure 10.1 Evaporation Pans and Lamps
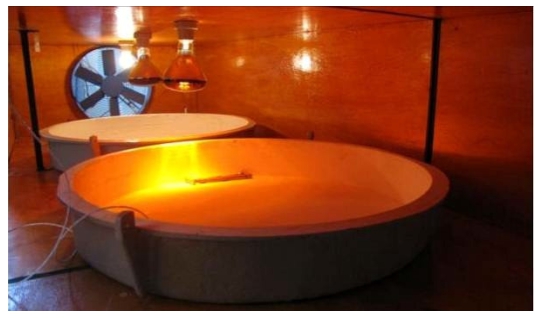
Test results demonstrated that it is possible and cost effective to obtain a concentrated brine through an evaporation process by treating the brine with CaO liming process alone to control Mg levels while reducing SO4 and boron levels. The cost of CaCl2 per tonne of sulphate removed was significantly higher, and the reduction of other ions by precipitating double salts was not more cost effective than removal later in the process.
Lithium Argentina AG., 2026 Cauchari-Olaroz S-K 1300 Technical Report Cauchari-Olaroz Salars, Argentina | Page 226 of 418 |
Figure 10.2 Dry Air Evaporation Tests
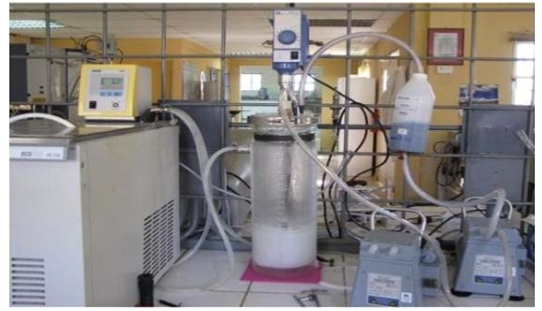
Figure 10.3 shows the change of Li ion concentration in the brine as water is evaporated in an example test. The y-axis is the weight percent lithium, while the x-axis represents the percentage of the initial brine mass evaporated. In brines treated with either CaO or CaCl2, concentrations close to 4% Li were achieved with minimal lithium loss.
Figure 10.3 Li Concentration Changes in the Brine During the Evaporation Process
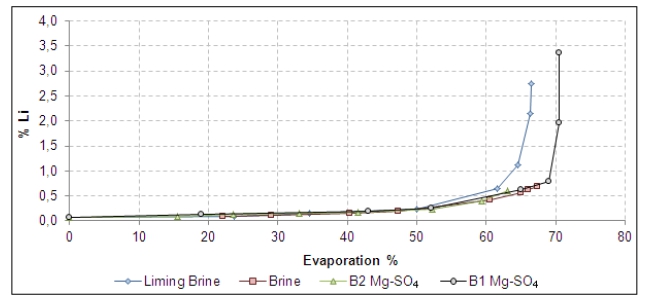
Results suggested treatment with CaO alone (i.e. liming) is ideal. CaO has a lower cost than CaCl2, and the increase in brine pH removes a portion of the Mg at the same time. Limed brine precipitated Sylvinite with KCl (potash) concentrations up to 20%. This suggests that fertilizer-grade potash could be produced by floatation at Cauchari (although potash production is not contemplated at this time). The precipitation of KCl and NaCl from solution purifies the brine naturally during evaporation and reduces the cost of operation and equipment in the processing plant after evaporation in the ponds.
Lithium Argentina AG., 2026 Cauchari-Olaroz S-K 1300 Technical Report Cauchari-Olaroz Salars, Argentina | Page 227 of 418 |
Testing of the CaO-treated brine resulted in a 60% reduction in sulphate ions. This reduction in sulphate ion is sufficient to produce concentrated lithium brines by natural solar evaporation and CaCl2 treatment is not necessary.
| 10.2 | Tests – Exar, Cauchari Salar |
| 10.2.1 | Salar de Cauchari Evaporation Pan and Pilot Pond Testing |
To validate the bench scale tests obtained at Universidad de Antofagasta, Chile, and obtain brine evaporation rate data at the site, pilot ponds and Class A evaporation pans were installed at the site. These ponds and pans are still under operation to allow correlation of the Class A pan, brine pan and pilot pond test data and determine the scale-up factor of the full-scale ponds.
The first seven months of evaporation pan testing at the Salar de Cauchari pilot facility:
| · | Validated the composition of Cauchari brine exposed to the Project site seasonal environmental conditions; |
| · | Obtained concentrated brine for additional pilot and bench scale testing; and |
| · | Obtained precipitated salts to determine the entrainment of brine in the salt during the different salt regimes precipitated during concentration. |
A total of 6 pilot ponds, pre-concentration, liming, settling, and concentration ponds, totalling 11,180 m2 were constructed as well as the liming equipment for treating the brine. Pre-concentration, liming, settling, and concentration ponds were represented. Over 20,000 liters of 1% Li brine was generated over a 7-month period. These ponds continue to operate and provide material for pilot testing at the site and with equipment vendors. The pilot ponds can be seen in Figure 10.4.
These ponds were installed with liners that consist of a geotextile underlay overlain by a polyethylene waterproofing liner to minimize the leakage from the ponds. Samples of the brine and salt are taken regularly and analyzed for composition and brine entrainment in the salt. This validates the process model used for the ponding operation and allows for the estimation of the shape factor for the full-scale ponds.
| 10.2.1.1 | Pond Pilot Testing |
| · | Validated the continuous operation of evaporation ponds; |
| · | Provided data for all seasonal environmental effects (wind, temperature, rain, etc.); |
| · | Provided concentrated brine for the purification pilot plant; |
| · | Developed the operating philosophy of the ponds and lime system; and |
Lithium Argentina AG., 2026 Cauchari-Olaroz S-K 1300 Technical Report Cauchari-Olaroz Salars, Argentina | Page 228 of 418 |
| · | Trained the staff (engineers and operators) who work in the commercial operation. |
Salar testing results were consistent with prior laboratory and mathematical model results. The test data has been used to update the mathematical process model and ensure accurate design information. Exar’s Project site evaporation and analytical results were independently validated by testing at ASA (Mendoza, Argentina).
The pond process performance improved when liming was performed after pre-evaporation and 10% or more excess lime was used. It was verified that the use of CaCl2 was not necessary because the Ca from the CaO reduced sulphate ions sufficiently to avoid downstream LiKSO4 precipitation at a lower operating cost than CaCl2 addition.
Figure 10.4 Pilot Ponds
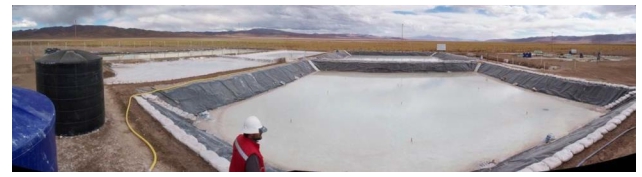
| 10.2.2 | 2017 Evaporation Tests |
In 2017, Exar completed a 35-month evaporation test program with the intention to define the relation of brine evaporation to water evaporation. This data was obtained from the brine pan and Class A water pan data observed between June 2013 and April 2016.
Figure 10.5 presents the monthly evaporation rate of the brine during the year and Figure 10.6 presents the monthly evaporation rate of the water. Table 10.1 displays the monthly evaporation ratio of brine to water. The minimum brine evaporation rate occurs in June at 3.77 mm/day for the bottom quartile of observed test data. The minimum median evaporation rate for brine observed is 5.00 mm/day in June while November has the highest median evaporation rate of 9.8 mm/day. Comparing this to the original evaporation used to engineer the ponds of 2.54 mm/day annual average evaporation for brine in the full-scale ponds results in an increase in pond productivity per evaporative area. When applying a conservative pond shape factor of about 0.65 to the 8.2 mm/day median brine evaporation observed, the effective pond productivity for 1,200 Ha of ponds roughly doubles versus the originally estimated evaporation used in the 2017 Feasibility Study (Burga, et al 2017). Mass balances on the full-scale operating pond segments confirm this shape factor.
Lithium Argentina AG., 2026 Cauchari-Olaroz S-K 1300 Technical Report Cauchari-Olaroz Salars, Argentina | Page 229 of 418 |
Figure 10.5 Brine Evaporation
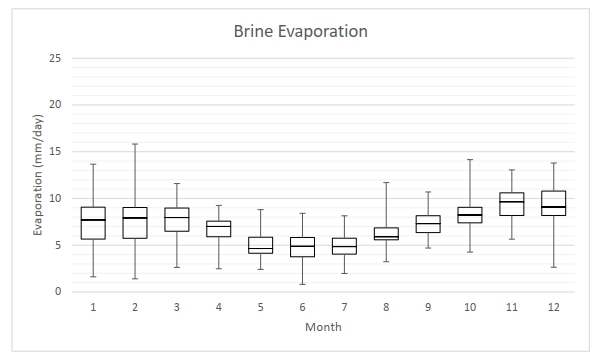
Figure 10.6 Water Evaporation
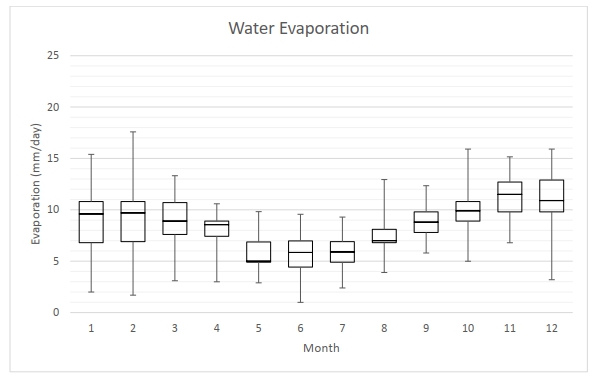
Lithium Argentina AG., 2026 Cauchari-Olaroz S-K 1300 Technical Report Cauchari-Olaroz Salars, Argentina | Page 230 of 418 |
Table
10.1
Monthly Evaporation Ratio
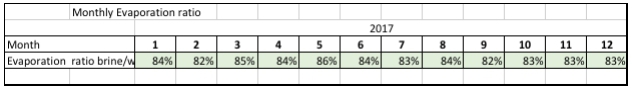
As a result of this test evaluation, the factor for water to brine design was changed from the assumed value of 0.7 to an average of 0.84.
Detailed simulations were then carried out using brine chemistry observed in the test ponds and pans, and with the observed rainfall and evaporation data to determine the annual productivity of the ponds. Currently, the operations team at Exar is working on detailed operating strategy to ensure a robust and safe operation based on ongoing mass balance calculations on the ponds and responses to actual weather / brine conditions.
| 10.2.3 | Liming Tests – Exar, Cauchari Salar |
Lime ratio, sedimentation, and flocculent performance testing with locally sourced CaO were performed at Exar’s Laboratory. Testing was completed in order to determine the required excess CaO (the liming operation) and residence time at an intermediate location in the ponds to reduce Mg, Ca, SO4 and boron in the brine entering the Purification and Carbonation Plant.
Figure 10.7 shows the sedimentation rate data from example tests. The time is shown on the x-axis, while the y-axis shows the depth of solids during natural settling. Three tests are shown here with a 10% (green triangle), 20% (green circle) and 30% (blue diamond) excess of CaO added to the brine. The excess is estimated based on the mass of magnesium in the initial brine. The solid lines plotted on the diagram is the initial settling rate which is used to design settling equipment.
Lithium Argentina AG., 2026 Cauchari-Olaroz S-K 1300 Technical Report Cauchari-Olaroz Salars, Argentina | Page 231 of 418 |
Figure 10.7 Sedimentation Rate of Limed Pulps with Different Amounts of Excess Lime
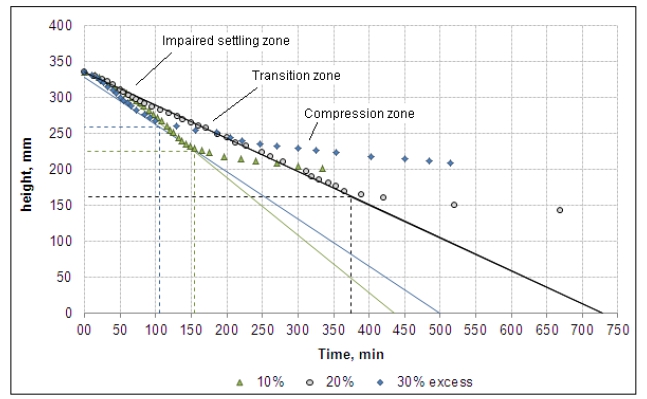
The lime ratio required to precipitate of 99.6% of Mg ions and 60% of SO4 ions was utilized for cost estimation. Testing is presently underway at vendors to design the thickener and filters for downstream processing.
| 10.3 | Solvent Extraction Tests – SGS Minerals and IIT, Universidad de Concepción |
Solvent extraction (SX) bench tests were performed at SGS Minerals in Lakefield, Canada, and Instituto de Investigaciones Tecnológicas (Technology Investigations Institute) of the Universidad de Concepción (ITT).
This testing determined:
| · | The most effective organic reagents for the extraction of boron from the brine; | |
| · | The pH effect on the extraction of boron; | |
| · | Extraction isotherms for extraction and re- extraction required in the project; | |
| · | The extraction and re-extraction kinetics in the system; | |
| · | The phase separation rate at two temperatures previously defined; and | |
| · | The required number of extraction and re-extraction stages. |
Typical brine feed to SX is shown in Table 10.2.
Lithium Argentina AG., 2026 Cauchari-Olaroz S-K 1300 Technical Report Cauchari-Olaroz Salars, Argentina | Page 232 of 418 |
| Table
10.2 Composition of the Brine Used for Testing SX |
| Li (g/L) | B (mg/L) | Ca (mg/L) | K (g/L) | Na (g/L) | Mg (mg/L) | SO4 (g/L) | pH |
| 10.5 | 5,565 | 266 | 32.3 | 65.4 | < 0.02 | 26.0 | 11 |
Several organic extract formulations were tested targeting boron removal over 97%.
Tests at both institutions showed that the extraction process should be performed at pH ≤ 4, and re-extraction of the extractant should occur at basic pH. The process uses HCl to adjust the brine pH for extraction, and a solution of NaOH for re-extraction of the boron from the organic mixture.
Figure 10.8 and Figure 10.9 show the isotherms in a McCabe-Thiele diagram. These diagrams have been used to determine the number of extraction and re-extraction steps. In Figure 10.8, the x-axis is the boron concentration in the aqueous phase, while the y-axis is the concentration of boron in the organic phase during extraction. In Figure 10.9, the x-axis is the boron concentration in the organic phase, while the y-axis is the boron concentration in the aqueous phase during re-extraction. The bold, straight line is the operating line for the proposed equipment, while the thin, stair-steps are the individual operating stages. Perfect extraction efficiency was not assumed to design the equipment to develop a realistic sizing.
Figure 10.8 Extraction Isotherm at 20ºC Using Mixed Extractants
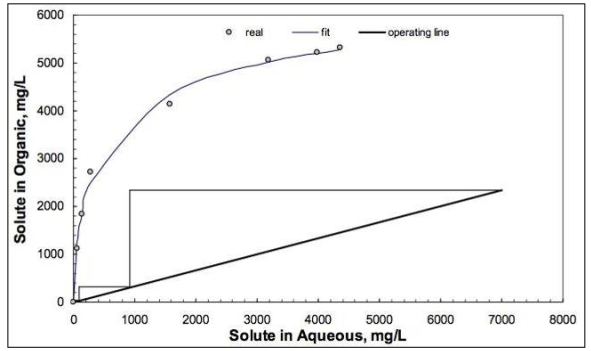
Lithium Argentina AG., 2026 Cauchari-Olaroz S-K 1300 Technical Report Cauchari-Olaroz Salars, Argentina | Page 233 of 418 |
Figure 10.9 Re-extraction Isotherm at 20ºC Using Mixed Extractants
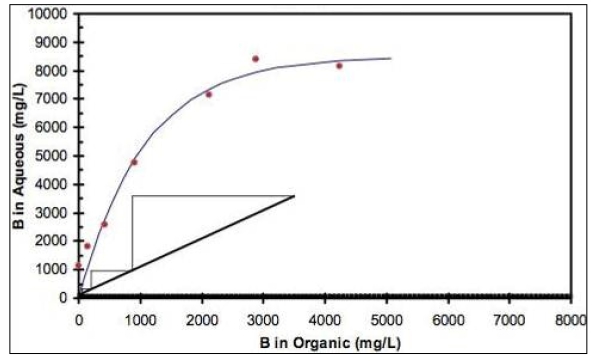
| 10.4 | Carbonation Tests – SGS Minerals (Canada) |
Carbonation tests were conducted by SGS Minerals on boron-contaminated brine.
The following tests were conducted:
| · | Removal of remaining Mg using NaOH solution; | |
| · | Removal of remaining Ca using a solution of Na2CO3; and | |
| · | Carbonation reaction of Li using Na2CO3 solution to precipitate Li2CO3. |
Differing reagent dosage, residence time, and temperatures were investigated. NaOH was found to be effective to remove the remaining Mg, and careful control of the Na2CO3 solution was required to remove the Ca without loss of Li. The test results of these carbonation tests were used to set the temperature, residence time and dosage of reagent ranges for the pilot plant tests.
| 10.5 | Pilot Purification Testing – SGS Minerals |
SGS Minerals piloted removal of contaminants and lithium carbonate production. The pilot program used 10,000 liters of concentrated brine obtained from the Salar de Cauchari pilot pond system. The results were used for plant design in this study. The pilot plant flowsheet includes solvent extraction for B removal, regeneration of solvent, removal of the Ca and Mg impurities, and lithium carbonate precipitation and washing.
The main objectives of the pilot plant were to:
| · | Test the continuous process developed from bench testing; and |
Lithium Argentina AG., 2026 Cauchari-Olaroz S-K 1300 Technical Report Cauchari-Olaroz Salars, Argentina | Page 234 of 418 |
| · | Validate and obtain parameters and design criteria for the development of the industrial plant engineering. |
Figure 10.10 shows the equipment for the pilot plant where the first tests were performed. The solvent extraction banks are on the left of the photograph, and the other reactors and filters are shown in the center and right of the image.
Figure 10.10 Pilot Plant (SX-Purification-Carbonation-Filtration-Washing Pulp)
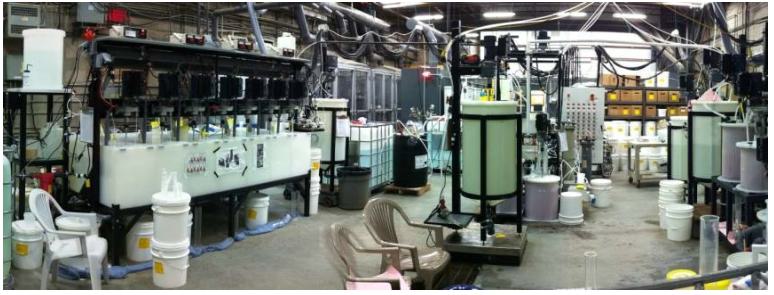
This plant was subsequently installed in the Salar de Cauchari for further testing and training of the operators at site. The pilot plant provides data for brines of varying compositions from seasonal effects and final lithium concentration. The results of the pilot plant test work have been incorporated to the engineering for the final facility to ensure a robust, reliable operation capable of producing the demanded product quality at the committed rate.
The SX pilot plant achieved an extraction efficiency of over 99.5% as shown in Figure 10.11. The x-axis in Figure 10.11 shows the date and time of the run, while the y-axis shows the percent of the boron mass in the feed that was removed during the test. The solvent extraction process was operated for 5 days during this test with no loss of boron removal efficiency.
Lithium Argentina AG., 2026 Cauchari-Olaroz S-K 1300 Technical Report Cauchari-Olaroz Salars, Argentina | Page 235 of 418 |
Figure 10.11 SX Process Boron Extraction Efficiency
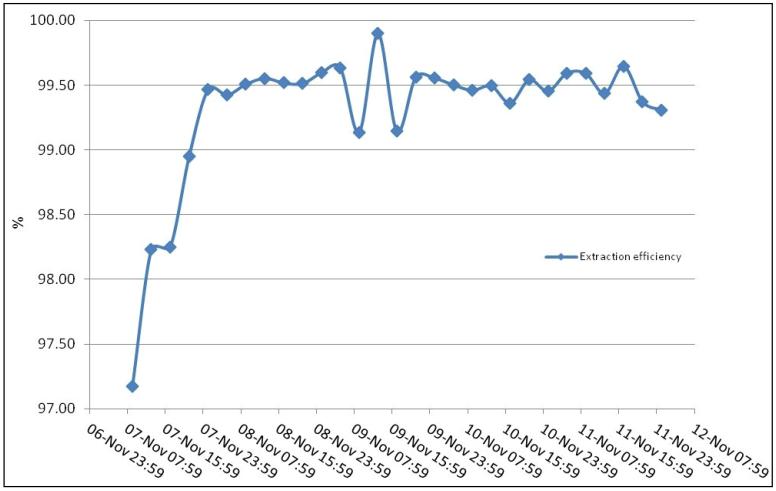
Mg and Ca polishing testing succeeded in obtaining over 95% removal efficiency, as shown in Figure 10.12. The x-axis is the date and time, while the y-axis shows the removal efficiency as a percentage of the mass of Ca or Mg in the feed brine. The Ca and Mg precipitation maintains the 95% removal efficiency over 4 days of operation in this test.
Lithium Argentina AG., 2026 Cauchari-Olaroz S-K 1300 Technical Report Cauchari-Olaroz Salars, Argentina | Page 236 of 418 |
Figure 10.12 Ca and Mg Precipitation Efficiency
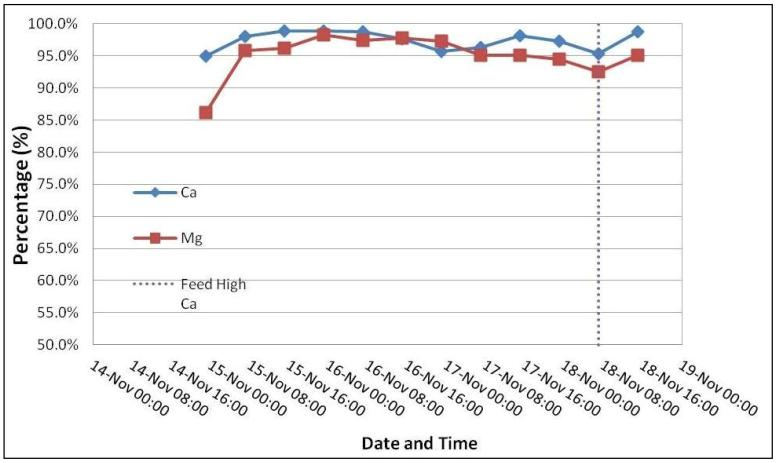
| 10.5.1 | Lithium Carbonate Precipitation |
Figure 10.13 demonstrates that over 86% recovery of lithium carbonate at acceptable excess-soda ash ratios was obtained. In Figure 10.13, the x-axis is the date and time of the test, while the left y-axis shows the percent of lithium mass precipitated during the tests, and the right y-axis shows the excess sodium carbonate being fed to the reactor. During this testing, excess soda ash varied from -40% to 70%. The optimum excess of soda ash is between 5 and 20% based on the lithium in the feed.
Lithium Argentina AG., 2026 Cauchari-Olaroz S-K 1300 Technical Report Cauchari-Olaroz Salars, Argentina | Page 237 of 418 |
Figure 10.13 Li Precipitation Efficiency
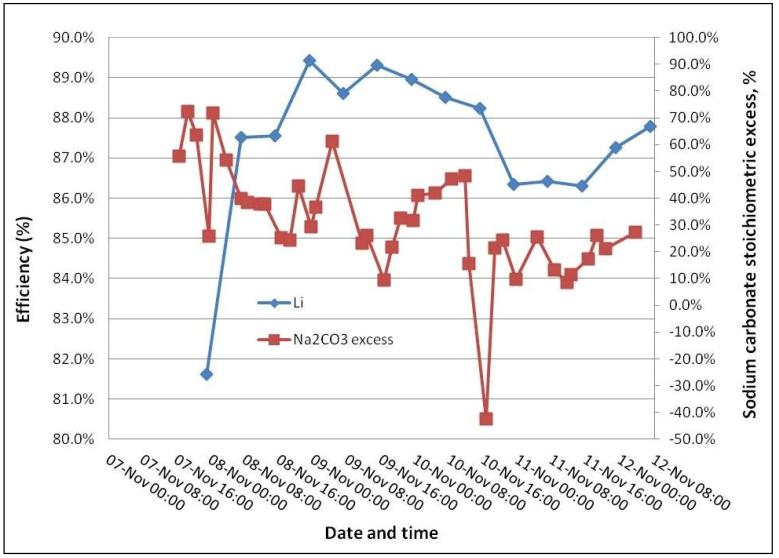
Washing of lithium carbonate filter cake with soft water resulted in sufficient product purity for the intended markets and use.
Control of lithium carbonate crystal habit and particle size via precipitation reaction parameters was effective in minimizing impurities. The lithium carbonate was then dried and packaged. A sample of dried lithium carbonate was shipped to the United States for micronization testing.
| 10.6 | Recent Testing Work Performed in the Pilot Plant |
The pilot plant works constantly to provide process support and monitor efficiency improvement and resource optimization in the lithium carbonate production process.
| 10.6.1 | Monitoring the Consumption of Lime Reagent in the Liming Plant |
During 2024, important work has been carried out monitoring the consumption of lime reagent for optimizing reagent consumption in the liming plant.
The reactions that take place precipitate magnesium hydroxide, gypsum, and calcium borates. The unbalanced reactions produce the following products:
(Mg)+2 + Ca(OH)2,(s) → Mg(OH)2,(s) + Ca+2
Ca+2 + SO4-2 → CaSO4,(s)
2Ca+2 + 3B2O4 → Ca2B6O11·5H2O(s)
Lithium Argentina AG., 2026 Cauchari-Olaroz S-K 1300 Technical Report Cauchari-Olaroz Salars, Argentina | Page 238 of 418 |
Through tests carried out in the pilot plant by the process team to determine the equilibrium curve of magnesium hydroxide, calcium sulphate, and calcium borates, the optimal lime consumption was identified. This study enabled a 50% reduction in the consumption required by design. This improvement not only reduced OPEX but also enhanced downstream performance in the purification process.
| · | Optimization of reagent consumption in the purification stages. |
Additionally, other studies conducted in the pilot plant also allowed for the optimization of reagent consumption in the purification stages.
In purification, through preliminary tests carried out in the pilot plant, the lime consumption was reduced from a molar ratio of 300% relative to the incoming magnesium to 250%, representing a 16.7% decrease in consumption.
An empirical equilibrium curve was also established (Figure 10.14), which serves as the basis for calculating the addition of calcium chloride to achieve the desired sulphate removal in primary purification.
Figure 10.14 Sulphate-Calcium Equilibrium Curve
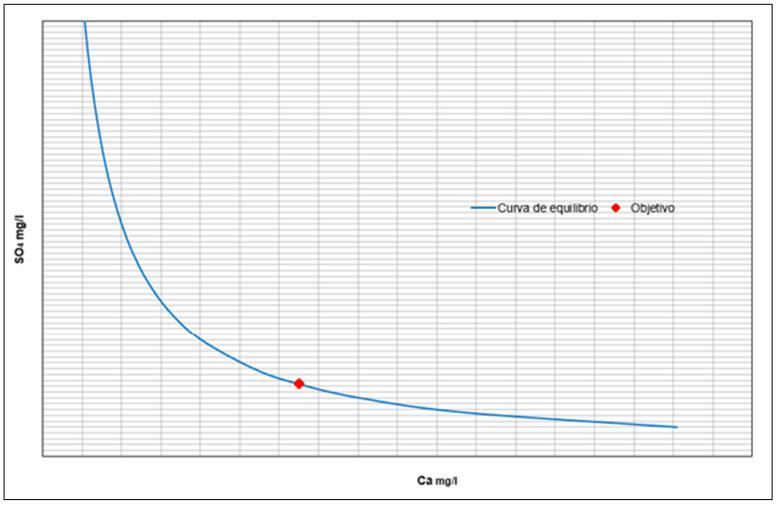
Lithium Argentina AG., 2026 Cauchari-Olaroz S-K 1300 Technical Report Cauchari-Olaroz Salars, Argentina | Page 239 of 418 |
Additionally, a simulation was developed that, by considering the prices of various reagents, determines the optimal economic route for sulphate removal during the purification process (Table 10.3 and Figure 10.15). This tool establishes a target concentration at the output of primary purification, thereby identifying the most efficient scenario in terms of the consumption of calcium chloride, barium chloride, and sodium carbonate.
Table
10.3
Reagent Optimization in Primary Purification
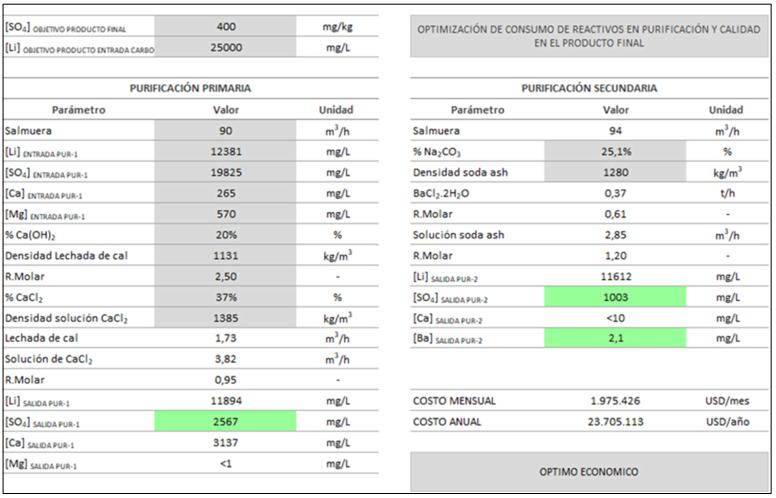
Lithium Argentina AG., 2026 Cauchari-Olaroz S-K 1300 Technical Report Cauchari-Olaroz Salars, Argentina | Page 240 of 418 |
Figure 10.15 Example of Economic Optimization Curve
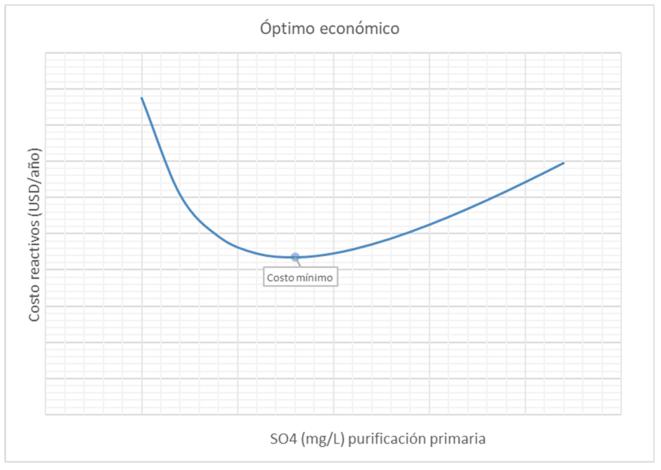
With the support of the pilot plant, a new operating temperature was established in purification. Lowering it from 70°C to 55°C reduced lithium loss in the precipitated solids during secondary purification.
| 10.6.2 | Lithium Losses in the Secondary Purification Filter Cake |
During 2025, it was determined that lithium losses in PUR-2 are exclusively due to the precipitation of Li₂CO₃ and are strongly influenced by the chemical matrix, particularly by the SO₄²⁻ concentration and the Ca²⁺/SO₄²⁻ ratio. In matrices with higher sulfate content, losses are lower, whereas lower SO₄²⁻ concentrations significantly increase lithium precipitation. Sodium carbonate overdosing is a critical factor that amplifies this effect, potentially leading to substantial lithium losses regardless of temperature. Operating with matrices richer in SO₄²⁻ and poorer in Ca²⁺ minimizes precipitation losses and improves the economic performance of the process.
The results showed that, as total lithium losses decrease, the combined total process cost is significantly reduced. Optimization of the chemical matrix allows lithium recovery to be increased from 95% to 97.3%, summarized in Figure 10.16.
At the time of the study, from an economic standpoint, optimizing lithium recovery had an impact approximately three times greater than reducing reagent consumption; therefore, lithium recovery should be considered the critical variable in process optimization.
Lithium Argentina AG., 2026 Cauchari-Olaroz S-K 1300 Technical Report Cauchari-Olaroz Salars, Argentina | Page 241 of 418 |
Figure 10.16 Equilibrium Curve of Li2CO3 Versus Ca and CO3
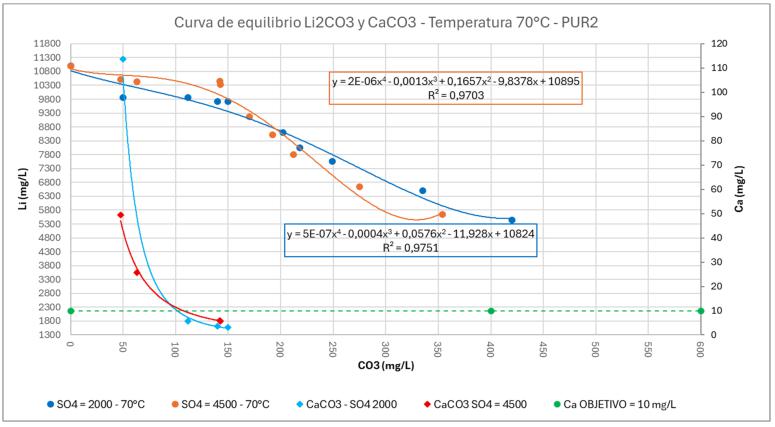
| 10.6.3 | SO₄²⁻ Adsorption During Li₂CO₃ Precipitation |
The study made it possible to characterize the phenomenon as a sulfate adsorption process onto the Li₂CO₃ solid, ruling out the possibility that it is merely due to impregnation by the mother liquor.
Laboratory-scale studies during all 2025 indicated variability in the percentage of SO₄²⁻ adsorbed, and correlation analysis identified the variables directly linked to the phenomenon, such as the initial Li⁺ concentration.
The analysis was subsequently scaled up to industrial conditions in order to evaluate the effective elution percentage during the centrifugation stage. Based on the industrial-scale results, it was concluded that:
| · | The percentage of SO₄²⁻ adsorbed in the final product, under the operating conditions at the time, was on the order of 1% on average, confirming the existence of a true adsorption mechanism. |
| · | The percentage of SO₄²⁻ removed during the washing (elution) stage showed an average value close to 15–16%, in agreement with the simulation results and with the concentrations experimentally determined in the washed solids. |
| 10.6.4 | Effect of Salinity on Organic Adsorption |
The identification, differentiation, and quantification of chemical- and physical-nature organic entrainment mechanisms present in the Solvent Extraction (SX) plant were carried out during 2025.
Lithium Argentina AG., 2026 Cauchari-Olaroz S-K 1300 Technical Report Cauchari-Olaroz Salars, Argentina | Page 242 of 418 |
The analysis made it possible to discriminate the relative contribution of each entrainment mechanism, establishing a technical basis for evaluating the behavior of the organic–aqueous system and for defining control strategies aimed at operational optimization of the SX circuit.
The results confirm an inverse relationship between salinity and total organic carbon (“TOC”), with lower levels of organic entrainment observed at higher salinity, and an increase in TOC as salinity decreases, as shown in Figure 10.17.
Figure 10.17 Graph of Total Organic Carbon Versus Salinity
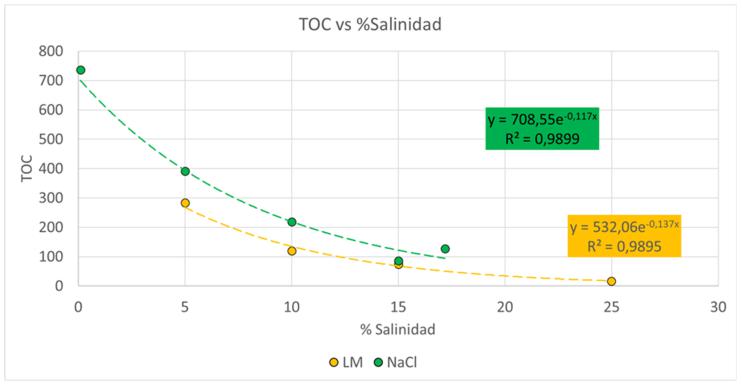
| 10.7 | Recent Work Performed in External Laboratories |
Chromatographic analysis in external laboratories to monitor the concentration of organic solvents in the SX process streams has been carried out in:
| · | Refined brine. | |
| · | Stripping streams. |
| 10.8 | Continuing Work Plan for Supporting the Plant Operations |
The following work and activities are being carried out at the pilot plant to support the operation.
Homologation Tests for Inputs Used in Lithium Carbonate Production
| · | Testing and evaluation of new inputs in different areas. |
Evaluation of Suppliers for Various Production Inputs
| · | Procedure for evaluating new suppliers. | |
| · | Tests required for evaluation. |
Lithium Argentina AG., 2026 Cauchari-Olaroz S-K 1300 Technical Report Cauchari-Olaroz Salars, Argentina | Page 243 of 418 |
Work Required According to Plant Needs for Process Optimization, Operational Problem Resolution, or Development of Alternatives
| · | Solvent extraction tests to reduce organic traces in the ouput streams. |
| · | Support for the analysis of new scenarios arising from new specifications across different areas. |
| · | Studying of the use of process water and mother liquors in the liming process. |
| · | Pilot Plant IX tests to evaluate IX resins. |
| · | Implement a process support program for ensuring that product quality is achieved more consistently. |
| · | Implementation of mathematical tools/models to predict plant operating conditions. |
Lithium Argentina AG., 2026 Cauchari-Olaroz S-K 1300 Technical Report Cauchari-Olaroz Salars, Argentina | Page 244 of 418 |
| 11.0 | Mineral Resource Estimates |
| 11.1 | Overview |
The footprint of the current lithium Mineral Resource Estimate is shown in Figure 11.1. LAR has previously filed the following NI 43-101 technical reports documenting lithium Mineral Resource Estimates:
| · | King, M., 2010a. Amended Inferred Resource Estimation of Lithium and Potassium at the Cauchari and Olaroz Salars, Jujuy Province, Argentina. Report prepared for LAR. Effective Date: February 15, 2010. |
| · | King, M., 2010b. Measured, Indicated and Inferred Resource Estimation of Lithium and Potassium at the Cauchari and Olaroz Salars, Jujuy Province, Argentina. Report prepared for LAR. Effective Date: December 6, 2010. |
| · | King, M., Kelley, R., and Abbey, D., 2012. Feasibility Study Reserve Estimation and Lithium Carbonate and Potash Production at the Cauchari-Olaroz Salars, Jujuy Province, Argentina. Report prepared for LAR. Effective Date: July 11, 2012. |
| · | Burga, E., Burga, D., Rosko, M., King, M., Abbey, D., Sanford, T., Smee, B., and Leblanc, R., 2017. Updated Feasibility Study Reserve Estimation and Lithium Carbonate Production at the Cauchari-Olaroz Salars, Jujuy Province, Argentina. Report prepared for LAR. Effective Date: March 29, 2017. Filing Date: January 15, 2018. |
| · | Burga, D., Burga, E., Genck, W., and Weber, D., 2019. Updated Mineral Resource Estimate for Cauchari-Olaroz, Jujuy Province, Argentina. Report prepared for LAR. Effective Date: March 1, 2019. Filing Date: March 31, 2019. |
| · | Burga, E., Burga, D., Genck, W., Weber, D., Sandford, A., Dworzanowski, M. 2020. Updated Feasibility Study and Mineral Reserve Estimation to Support 40,000 tpa at the Cauchari-Olaroz Salars, Jujuy Province, Argentina, NI 43-101 Report, Prepared for LAR. Effective Date: September 30th, 2020. Filing Date: October 19, 2020. |
| · | Burga, E., Burga, D., Genck, W., Weber, D., Sandford, A., Dworzanowski, M. 2025. Operational Technical Report at the Cauchari-Olaroz Salars, Jujuy Province, Argentina. Prepared for LAR. Effective Date: December 31, 2024. Filing Date: January 8, 2025. |
| · | Burga, D., Weber, D., Sandford, A., Dworzanowski, M., Cushing, A. 2025. S-K 1300 Operational Technical Report at the Cauchari-Olaroz Salars, Jujuy Province, Argentina. Prepared for LAR. Effective Date: December 31, 2024. Filing Date: March 17, 2025. |
Lithium Argentina AG., 2026 Cauchari-Olaroz S-K 1300 Technical Report Cauchari-Olaroz Salars, Argentina | Page 245 of 418 |
Figure 11.1 Location Map for Mineral Resource Estimate
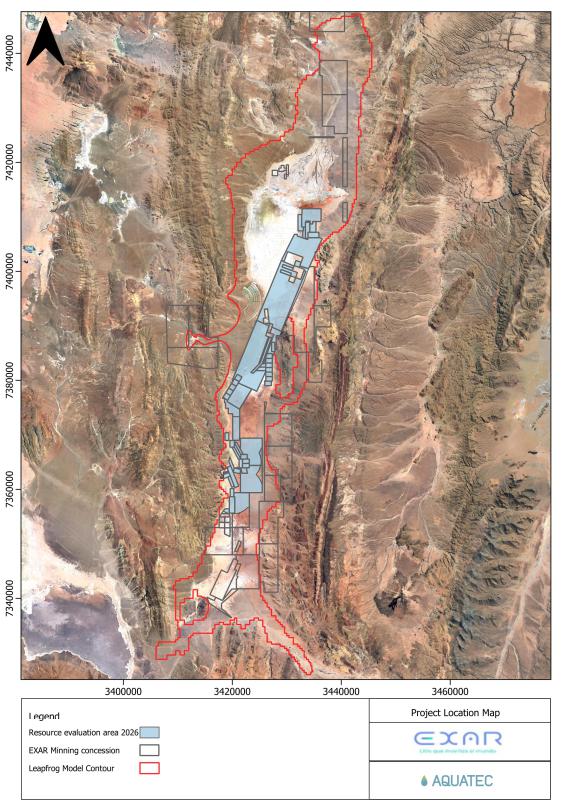
Source: Aquatec, (2025)
Lithium Argentina AG., 2026 Cauchari-Olaroz S-K 1300 Technical Report Cauchari-Olaroz Salars, Argentina | Page 246 of 418 |
The Mineral Resource Estimate reported in this section was completed using a new Leapfrog Geo model that incorporates the hydrostratigraphic (HSU) units described in Section 6.5 that are described in Section11.3.3. This new model is based on the full basin model developed by Aquatec. The Mineral Reserve Estimate, documented in Section 12.0, uses the same HSU framework.
The results of drilling, exploration, and production carried out in recent years have enabled an updated resource evaluation. Based on this new information, a significant portion of the Mineral Resources previously classified as Inferred in the Burga et al (2019) Mineral Resource Estimate has been reclassified to Indicated and Measured Mineral Resources. This reclassification is due to an increase in the spatial and temporal continuity of the supporting data.
| 11.1.1 | Statement for Brine Mineral Prospects and Related Terms |
Lithium occurs as a dissolved mineral species in subsurface brine of the Project area. The brine is contained within an aquifer comprised of alluvial, lacustrine, and evaporite deposits that have accumulated in the SdC and SdO structural basin. Mineral Resource estimation for brine mineral deposits is based on knowledge of the geometry of the brine aquifer, the variation in specific yield (also known as drainable porosity), and concentration or grade of dissolved lithium in the brine aquifer.
Following CIM standards and guidelines for technical reporting, classification standards for a Mineral Resource are applied as indicators of confidence level classifications: Measured, Indicated, and Inferred. According to these standards, “Measured” is the most confident classification and Inferred is the least confident (CIM, 2012 and 2014). Estimation of Mineral Reserves considers additional technical parameters such as permeability (hydraulic conductivity), storativity, diffusivity and the overall groundwater flow regime, in addition to so called “modifying factors” such as cost considerations and processing. These are jointly applied to predict how the Mineral Resource will change over the life of mine plan (CIM, 2012 and 2014). The evaluation framework used for brine Mineral Resource and Mineral Reserve estimation, based on CIM standards and best practice guidelines, is shown in Figure 11.2.
Lithium Argentina AG., 2026 Cauchari-Olaroz S-K 1300 Technical Report Cauchari-Olaroz Salars, Argentina | Page 247 of 418 |
Figure 11.2 Methodology for Evaluating Brine Mineral Resources and Mineral Reserves
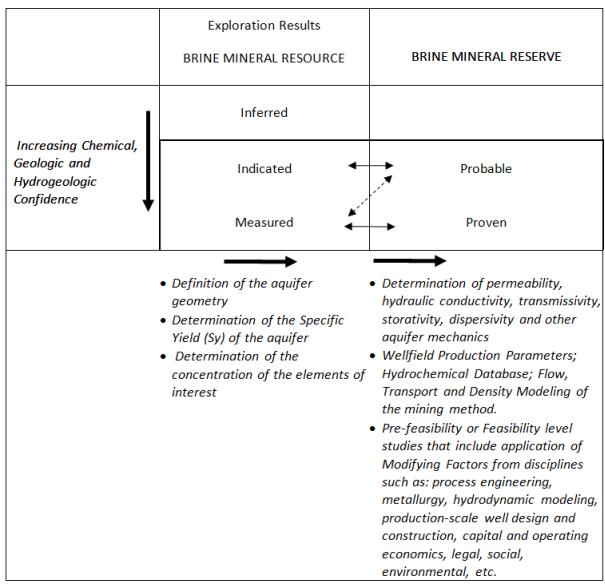
Source: Modified from CIM 2014
Mineral Resource classifications used in this study conform to the 2018 S-K 1300 Definition Standards:
Mineral Resource: a Mineral Resource is a concentration or occurrence of material of economic interest in or on the Earth's crust in such form, grade or quality, and quantity that there are reasonable prospects for economic extraction. A Mineral Resource is a reasonable estimate of mineralization, taking into account relevant factors such as cut-off grade, likely mining dimensions, location or continuity, that, with the assumed and justifiable technical and economic conditions, is likely to, in whole or in part, become economically extractable. It is not merely an inventory of all mineralization drilled or sampled.
Lithium Argentina AG., 2026 Cauchari-Olaroz S-K 1300 Technical Report Cauchari-Olaroz Salars, Argentina | Page 248 of 418 |
Measured Mineral Resource: a Measured Mineral Resource is that part of a Mineral Resource for which quantity and grade or quality are estimated on the basis of conclusive geological evidence and sampling. The level of geological certainty associated with a measured mineral resource is sufficient to allow a qualified person to apply modifying factors, as defined in this section, in sufficient detail to support detailed mine planning and final evaluation of the economic viability of the deposit. Because a Measured Mineral Resource has a higher level of confidence than the level of confidence of either an Indicated Mineral Resource or an Inferred Mineral Resource, a Measured Mineral Resource may be converted to a Proven Mineral Reserve or to a Probable Mineral Reserve.
Indicated Mineral Resource: an Indicated Mineral Resource is that part of a Mineral Resource for which quantity and grade or quality are estimated on the basis of adequate geological evidence and sampling. The level of geological certainty associated with an Indicated Mineral Resource is sufficient to allow a qualified person to apply modifying factors in sufficient detail to support mine planning and evaluation of the economic viability of the deposit. Because an Indicated Mineral Resource has a lower level of confidence than the level of confidence of a Measured Mineral Resource, an Indicated Mineral Resource may only be converted to a Probable Mineral Reserve.
Inferred Mineral Resource: an Inferred Mineral Resource is that part of a Mineral Resource for which quantity and grade or quality are estimated on the basis of limited geological evidence and sampling. The level of geological uncertainty associated with an Inferred Mineral Resource is too high to apply relevant technical and economic factors likely to influence the prospects of economic extraction in a manner useful for evaluation of economic viability. Because an Inferred Mineral Resource has the lowest level of geological confidence of all Mineral Resources, which prevents the application of the modifying factors in a manner useful for evaluation of economic viability, an Inferred Mineral Resource may not be considered when assessing the economic viability of a mining project, and may not be converted to a Mineral Reserve.
| 11.2 | Mineral Resource Estimate Methodology |
| 11.2.1 | Most Recent Previous Mineral Resource Estimate (Burga et al., 2025) |
The most recent Mineral Resource Estimate was originally prepared in 2019 (Burga et al., 2019) and subsequently carried forward into Burga et al (2025). Plan and section views of the previous Resource Evaluation Area are shown in Figure 11.3.
Lithium Argentina AG., 2026 Cauchari-Olaroz S-K 1300 Technical Report Cauchari-Olaroz Salars, Argentina | Page 249 of 418 |
Figure 11.3 Representative Plan and Section Views of the 2019 Measured, Indicated, and Inferred Mineral Resource Estimate
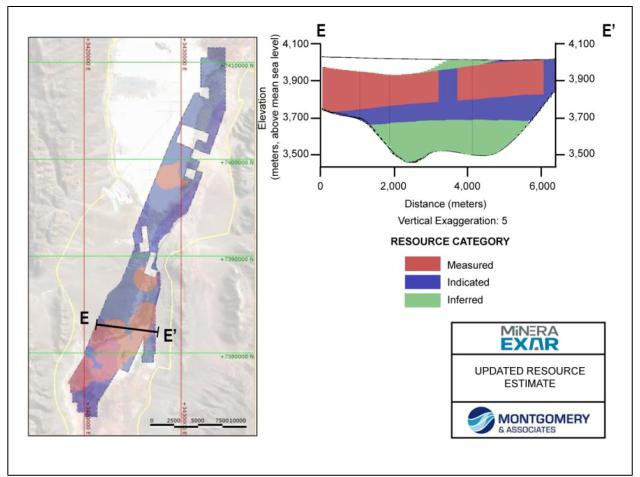
Source: Burga et al. (2025)
| 11.2.2 | Background of the Current M Hydrostratigraphic Model |
A three-dimensional hydrostratigraphic model was initially prepared by Montgomery and Associates, (Montgomery, 2025) and Aquatec built upon this work. The model is based on a comprehensive compilation, evaluation, and integration of historical datasets from both operators, and publicly available sources. This work resulted in a unified and internally consistent database of data records through December 31, 2023. The delineation of Hydrostratigraphic Units (HSUs) was based on detailed lithological descriptions, analysis of groundwater (piezometric) levels, and hydraulic parameters derived from pumping tests. The model was constructed in Leapfrog software (Seequent, 2018).
Data consolidation activities resulted in the compilation of 19 inter-related data types, including the following:
| · | Station Inventory: Detailed records of production wells, exploration and test wells, gauging stations, meteorological stations, evaporation domes, and environmental monitoring locations. |
Lithium Argentina AG., 2026 Cauchari-Olaroz S-K 1300 Technical Report Cauchari-Olaroz Salars, Argentina | Page 250 of 418 |
| · | Geological and Lithological Data: Lithological descriptions from 339 wells with depths ranging from 3 to 1,410 meters below natural ground level (m b.g.l.); 133 of these wells include grain-size distribution analyses and were drilled using diamond core methods. |
| · | Well Construction and Geophysical Logging: Records of casing configuration, annular backfill, and raw geophysical logging data. |
| · | Hydraulic Parameters: Results from 206 pumping tests, including 31 constant-rate pumping tests involving 31 pumping wells and 61 observation wells. These tests provided estimates of hydraulic conductivity, storage coefficients, and drainable porosity using brine release capacity (RBRC) analytical methods. |
| · | Piezometric Levels: Measurements of static and dynamic groundwater levels. |
| · | Production Data: Flow rates and dynamic water levels from brine and industrial water production wells. |
| · | Hydrochemical and Isotopic Data: Analytical results from surface water and groundwater sampling programs; 30 isotopic samples were collected in October 2024. |
| · | Surface Water Flow Data: Streamflow measurements collected at designated control points. |
| · | Meteorological Records: Raw data obtained from climate monitoring stations. |
| · | Environmental Monitoring: Inventory and records of environmental monitoring stations. |
Some of these were used to construct the Leapfrog geological model and were subsequently updated through the current work, to support Resource estimation. Others supported development of the dynamic flow model used for the Reserve Estimate, described in Section 12.0.
To ensure consistency and accuracy in elevation control, a high-precision topographic survey was completed by the independent firm Arq&Top between September and October 2024. This survey harmonized piezometric and topographic elevation datasets. Evaluation of the saline interface was further supported by targeted exploration datasets, including:
| · | deep laboratory chemical analyses, | |
| · | near-surface physicochemical testing (0–5 m), | |
| · | electrical conductivity (EC) geophysical logs, and | |
| · | geophysical resistivity surveys conducted using Vertical Electrical Soundings (VES), Transient Electromagnetics (TEM), and Audiomagnetotelluric (AMT) methods. |
The Leapfrog model developed by Montgomery (2025) was further updated through the current work, to support Resource Estimation. The updates included the following:
| · | Two additional, recent wells (W28 and W30) were incorporated in the HSU work-up. These wells provided a significant amount of geological information, as both penetrated the entire thickness of salar deposits in the Olaroz area. |
Lithium Argentina AG., 2026 Cauchari-Olaroz S-K 1300 Technical Report Cauchari-Olaroz Salars, Argentina | Page 251 of 418 |
| · | A three-dimensional interpolation of lithium grades was conducted throughout the model domain (Section 11.2.5). |
| · | Resource classifications were delineated according to accepted practices (Section 11.3.7). |
A profile and sections through the updated (current) hydrostratigraphic model are shown in Figure 11.4.
| 11.2.3 | Hydrostratigraphic Units |
The hydrostratigraphic model constructed by Montgomery (2025) was simplified from previous versions, and includes five primary hydrostratigraphic units (HSUs) and the base of the model, interpreted as hydrogeological basement (HSU 6). The HSUs are described in Section 6.5 and include:
| · | HSU1 – Upper Proximal Alluvial | |
| · | HSU2 – Intermediate Alluvial | |
| · | HSU3 – Upper Distal Alluvial | |
| · | HSU4 – Evaporite–Alluvial Interbedded Unit | |
| · | HSU5 – Lower Alluvial fan | |
| · | HSU6 – Base of the Current Aquifer for Resource Estimation. |
A comparison of these HSUs with the previous iteration of the of hydrostratigraphic model (Burga et al., 2025) is provided in Table 11.1.
| Table 11.1 Hydrostratigraphic Units Assigned in Previous and Current Studies | |
| Burga et al. (2025) |
Current Resource Model (same HSUs as Montgomery (2025)) |
| Alluvial Fan Sand and Gravel | HSU 1 - Upper proximal Alluvial |
|
Clay and Silt; Sand; Sand and Clay/Silt; Halite |
HSU 2 - Intermediate Alluvial |
| HSU 3 - Upper distal alluvial | |
| HSU 4 - Evaporite–Alluvial Interbedded Unit | |
| Basal Sand | HSU 5 - Lower alluvial |
| Basement Rock | HSU 6 - Base of Resource Zone |
Figure 11.4 displays the hydrogeostratigraphic units in vertical cross sections and as an aerial plan view.
Lithium Argentina AG., 2026 Cauchari-Olaroz S-K 1300 Technical Report Cauchari-Olaroz Salars, Argentina | Page 252 of 418 |
Figure 11.4 Vertical Cross Sections and Aerial View Showing the Distribution of the Hydrogeostratigraphic Units
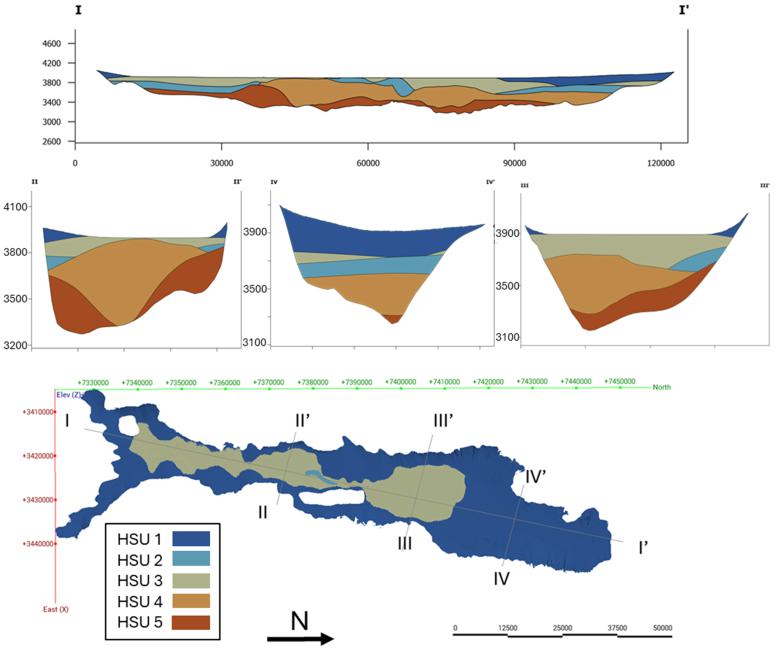
Source: Aquatec, (2025)
Lithium Argentina AG., 2026 Cauchari-Olaroz S-K 1300 Technical Report Cauchari-Olaroz Salars, Argentina | Page 253 of 418 |
| 11.2.4 | Specific Yield |
Specific yield (“Sy”) or drainable porosity is the total volume of pore space in saturated media that drains, under the influence of gravity, expressed as a percentage of bulk porous media volume. Samples collected for the determination of specific yield during the various exploration campaigns were analyzed using Relative Brine Release Capacity (RBRC) testing. Table 11.2 summarizes Sy testing results for each HSU, and sampling locations are shown in Figure 11.5. A total of 714 EXAR samples were selected for inclusion in the Mineral Resource Evaluation model, for units HSU 1, HSU 2, HSU 3, and HSU 4.
The specific yield for HSU 5 is based on previously published values (Basal Sand = 13.7%, Burga et al., 2019). Sampling from six boreholes between 2017-2019 showed a slightly higher value of 14%. Therefore, the previous value (13.7%) was considered reasonable and maintained for the current resource.
| Table 11.2 Specific Yield values assigned to the Hydrogeological Units (Mean) | ||
| Hydrogeological Unit | n |
Sy (%) |
| Total (Sy_pc) | 714 | 8.58 |
| HSU 1 | 8 | 19.96 |
| HSU 2 | 95 | 15.35 |
| HSU 3 | 232 | 8.89 |
| HSU 4 | 379 | 6.44 |
| HSU 5 | - | 13.7 |
Lithium Argentina AG., 2026 Cauchari-Olaroz S-K 1300 Technical Report Cauchari-Olaroz Salars, Argentina | Page 254 of 418 |
Figure 11.5 Drill Hole Locations Where Porosity Analyses Were Conducted
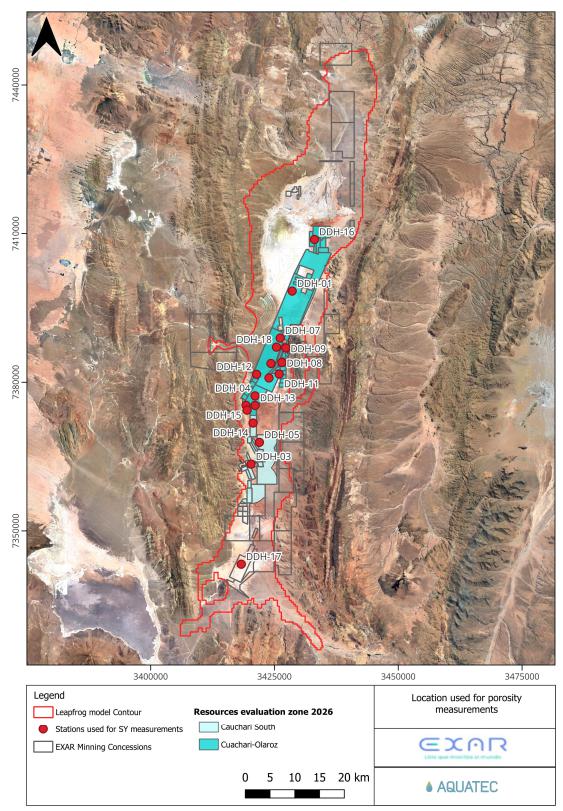
Source: Aquatec, (2025)
Lithium Argentina AG., 2026 Cauchari-Olaroz S-K 1300 Technical Report Cauchari-Olaroz Salars, Argentina | Page 255 of 418 |
| 11.2.5 | Lithium Grade |
A systematic filtering process was applied to EXAR’s brine chemistry database, to select appropriate samples for Resource Estimation. The objective of this process was to ensure that only reliable and representative data were used. The filtering process included the following steps:
| · | Exclusion of samples collected at locations for which complete well construction information was not available, including coordinates, screened intervals, and related construction details. |
| · | Removal of duplicate samples and samples with incomplete chemical analyses. |
| · | In consideration of the different sampling methodologies employed, a hierarchy of sampling methods was applied to determine the most representative sample, as follows (from highest to lowest priority): |
| o | Samples collected from production wells: For each sampling location an average of the most recent available chemical analyses was calculated, up to a maximum of ten samples. The screened intervals were subdivided into 100-meter intervals. The midpoint of each interval was used to spatially assign the representative chemical sample. | |
| o | Samples collected during pumping tests: the same procedure than for the production wells was used for these types of samples. | |
| o | Samples collected during packer tests: The most recent packer samples were selected. Each representative sample was applied at the corresponding depth at which it was collected. | |
| o | Samples collected using electronic bailers. | |
| o | Samples collected using plastic bailers. |
For samples collected using both electronic and plastic bailers, preference was given to those used in the 2019 Mineral Resource Estimate (Burga et al., 2025), provided that the well had been previously purged using the airlift method. Where this condition was not met, the average of the ten most recent available sample results were used. As in previous types of samples, the screened intervals were subdivided into 100-meter intervals, and the same value was applied to each interval. These samples are generally from ongoing monitoring conducted by EXAR.
In addition to the samples from wells included in EXAR’s database, a number of samples previously used in Burga et al. (2020) were also incorporated into the interpolation dataset. The sampling points included are: ELCRMN, PZCSCLRD, PZLCRMN, PZPRVNRBRX, PZSLFTR, QD. ESTN2, QD. ESTN3, W01, W02, W04, W05, W06, W06 Bis, W07, W08, W10, W11, W12, W14 Bis, W16 Bis, W19, W22, CAU01D, CAU03D, CAU04D, CAU05D, CAU06R, CAU07R, and CAU17D. These sample results were checked and considered valid and useful for strengthening the dataset.
In addition, 13 samples collected in 2010 and reported in King, M., 2010b were included. These locations are wells: DDH-01, DDH-04, DDH-06, DDH-12, PE-06, PE-09, PE-10, PE-13, PE-17, PE-18, PE-19, PE-20, and PE-21. Again, these sample results were checked and considered valid and useful.
Prior to most of the bailer sampling campaigns, the wells were purged using airlift, and some samples were collected from the pumped water. However, the current Resource Estimate does not use any samples collected by airlift methods, as these samples were considered less reliable than those obtained using other methods.
This filtering process resulted lithium grade dataset that was used as input for the interpolation process. In total, 506 lithium grade results are represented in the 3-D interpolation that supports the current Mineral Resource Estimate. Interpolation results are shown in Figure 11.6.
Lithium Argentina AG., 2026 Cauchari-Olaroz S-K 1300 Technical Report Cauchari-Olaroz Salars, Argentina | Page 256 of 418 |
Figure 11.6 Lithium Grade Interpolation for the Current Mineral Resource Estimate
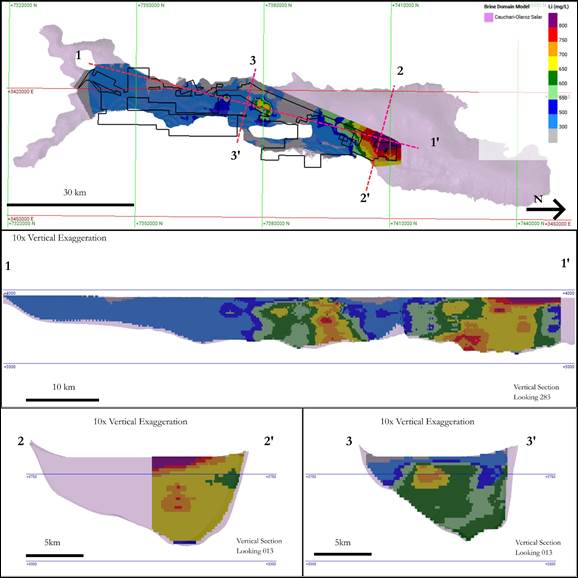
Source: Aquatec, (2025)
Lithium Argentina AG., 2026 Cauchari-Olaroz S-K 1300 Technical Report Cauchari-Olaroz Salars, Argentina | Page 257 of 418 |
| 11.2.6 | Mineral Resource Block Model Variography, Methods, and Validation |
The block Mineral Resource model was developed and validated through the following methodology:
| 1. | Spatial analysis of the lithium grades - An updated exploratory variographic analysis was performed to evaluate spatial continuity within the Li-Domain. Both dip and dip azimuth were set to 0°, and the analysis included a modelled omnidirectional variogram as well as a 2-D polar variogram with directional structures. The updated variograms indicate the following: |
| a. | Strong lateral continuity within the horizontal (X–Y) plane, with the major, semi-major, and minor directions displaying similar structures and ranges, indicating moderate isotropy at the basin scale. |
| b. | Limited continuity along the vertical (Z) axis, consistent with typical fluid density variations in salars and the stratified nature of the hydrostratigraphic units and typical of lithium brine systems. |
| c. | These results indicate that the Li Domain behaves laterally as a continuous hydrogeochemical volume, with no dominant directional anisotropy. This supports the use of a horizontally isotropic model and provides additional justification for the application of a deterministic inverse distance (ID) approach for grade estimation, rather than a geostatistical kriging method (Figure 11.7). |
Figure 11.7 Modelled Variogram for Li and 2-D Variogram and Directional Variograms for the Li-Domain
A) Modelled Variogram for Li
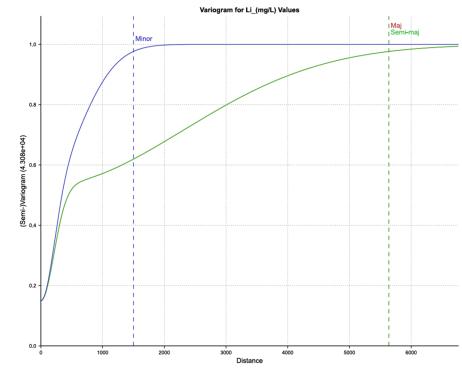
Lithium Argentina AG., 2026 Cauchari-Olaroz S-K 1300 Technical Report Cauchari-Olaroz Salars, Argentina | Page 258 of 418 |
B) 2-D Variogram and Directional Variograms for the Li-Domain
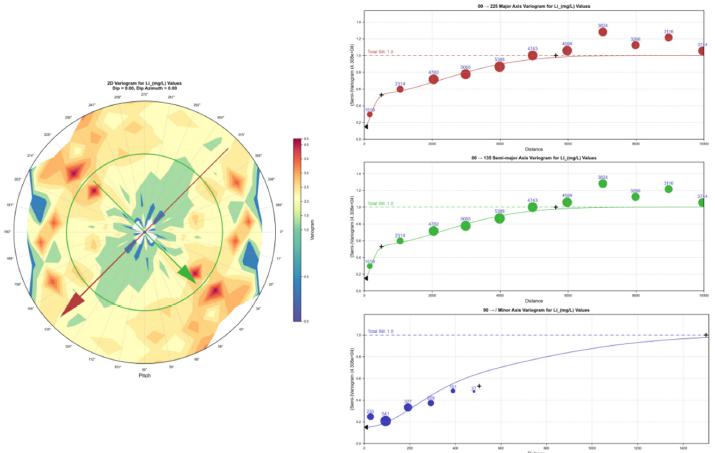
Source: Aquatec, (2025)
| 2. | Block model construction - The Mineral Resource block model within the Resource Evaluation Area was defined with a block size of x = 100 m, y = 100 m, and z = 25 m. The drainable volume is calculated directly within the block model using: |
| a. | the geometric volume of each block (100 × 100 × 25 = 250,000 m³), and |
| b. | the specific yield (Sy) assigned to each block. Block SY values are assigned per each blocks HSU categorization. Block HSU values are determined by on a majority composite basis of each blocks intersection with the HSU model. |
| c. | The lithium content (in tonnes) is calculated as the Drainable volume (m3) x Lithium Concentration (mg/L)/106. Where Lithium Concentration (Li) corresponds to the field obtained from inverse distance interpolation (mg/L). Because each block contains a different volume of brine depending on its assigned Sy value, the average lithium grade used for reporting is calculated as a brine-volume-weighted average, rather than a simple arithmetic mean. |
Lithium Argentina AG., 2026 Cauchari-Olaroz S-K 1300 Technical Report Cauchari-Olaroz Salars, Argentina | Page 259 of 418 |
| 3. | Inverse Distance (ID) Interpolation - Lithium grade estimation was performed exclusively using the ID method to the second power, also known as Inverse Distance Squared (ID2). The interpolation followed a four-pass strategy (MP1–MP4) with progressively increasing search radii. This approach was selected because ID interpolation produces stable results with fewer artifacts compared to alternative methods that were evaluated. The four ID passes were applied sequentially, with each block receiving the first valid estimate found. Operational parameters are summarized in Table 11.3. |
| Table 11.3 ID Interpolation Parameters | |||||
| Estimator |
Max (m) |
Interpolation Range (m) |
Min (m) |
Min No. Samples |
Max No. Samples |
| MP1 | 2,500 | 2,500 | 100 | 6 | 20 |
| MP2 | 5,000 | 5,000 | 200 | 4 | 20 |
| MP3 | 7,500 | 7,500 | 300 | 2 | 20 |
| MP4 | 25,000 | 25,000 | 500 | 2 | 20 |
Note: Common Parameters for All Passes
| · | Method: Inverse Distance (ID), exponent = 2.0. | |
| · | Declustering: None applied. | |
| · | Sectorization: None applied. | |
| · | Capping / Top-cut: None applied. | |
| · | Orientation: Dip = 0°, Azimuth = 0°, Pitch = 90°. |
| 4. | Statistical Validation of Interpolated Lithium Grades - The statistical validation of lithium grades was performed by comparing descriptive statistics of the input sample values with those obtained in the block model using the combined ID2 Li estimator (Table 11.4). |
| a. | The comparison between the descriptive statistics of the original lithium samples and the block model estimated using ID2 shows behavior consistent with expectations for this type of interpolation. |
| b. | The characteristic smoothing effect of the ID method is evident, reflected in a reduction of both the standard deviation and variance in the estimates compared to the original data. While the samples have a standard deviation of 207.56 mg/L, the estimated model shows a lower value of 156.49 mg/L, indicating reduced dispersion in the interpolated values. |
| Table 11.4 Key Statics of Datasets Used | ||||||||||
| Variable | n | Mean | Std. Dev. |
CV | Variance | Min | Q1 |
Median (Q2) |
Q3 | Max |
| Li_(mg/L) | 506 | 531.27 | 207.56 | 0.391 | 43,081.3 | 0.802 | 443.71 | 555.68 | 661.49 | 1,267.0 |
| Interpolated Lithium field | 2,345,183 | 468.73 | 156.49 | 0.334 | 24,489.3 | 2.277 | 361.45 | 466.05 | 594.64 | 1,109.9 |
| Note: | n = sample size as in number of samples, Std Dev = standard deviation, CV = coefficient of variation, Min = minimum, Q1 = first quartile, Q3 = third quartile, Max = maximum. |
| c) | The ID estimates show slight smoothing compared to the sample data, with a lower mean and moderated extreme values, which is typical of deterministic interpolation methods. Quartile comparisons indicate that the model adequately reproduces the central tendency and overall distribution shape of the dataset. |
Lithium Argentina AG., 2026 Cauchari-Olaroz S-K 1300 Technical Report Cauchari-Olaroz Salars, Argentina | Page 260 of 418 |
Swath plots in the X, Y, and Z directions (Figure 11.8, Figure 11.9 and Figure 11.10, respectively) confirm that spatial trends are consistent, with no artifacts or non-geological discontinuities observed. The vertical and lateral profiles reflect the expected geological behavior and data continuity. Overall, the analysis indicates that the interpolation method is reasonable and valid, providing a stable and reliable representation of lithium distribution.
Figure 11.8 Swath Plot in X for Li Domain
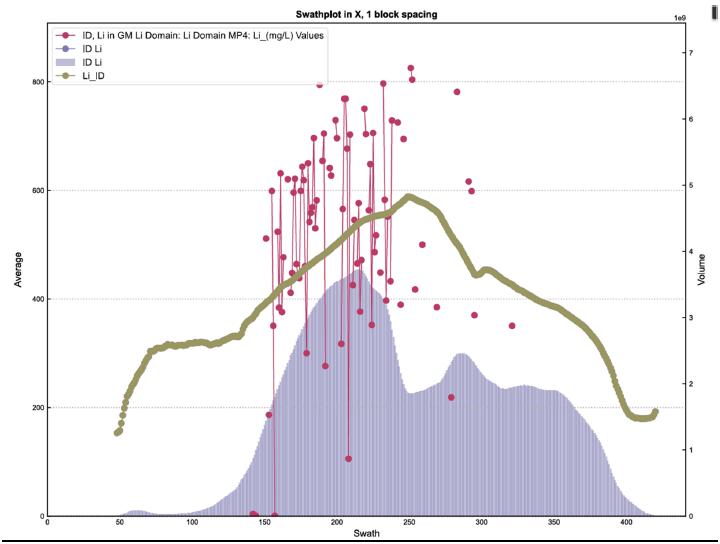
Source: Aquatec, (2025)
Lithium Argentina AG., 2026 Cauchari-Olaroz S-K 1300 Technical Report Cauchari-Olaroz Salars, Argentina | Page 261 of 418 |
Figure 11.9 Swath Plot in Y for Li Domain
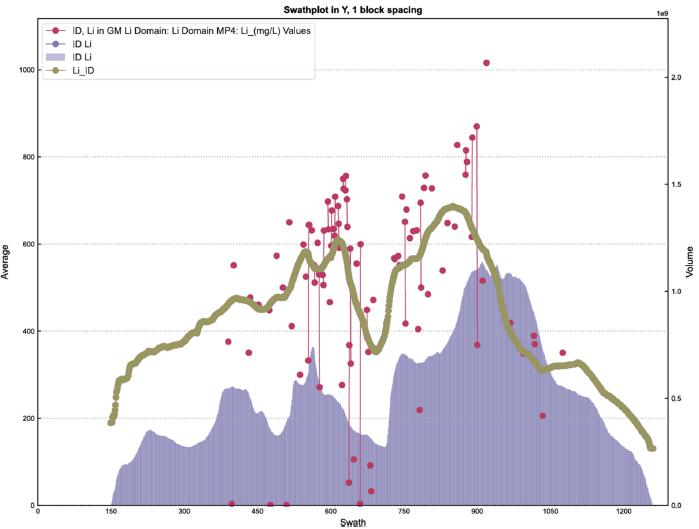
Source: Aquatec, (2025)
Lithium Argentina AG., 2026 Cauchari-Olaroz S-K 1300 Technical Report Cauchari-Olaroz Salars, Argentina | Page 262 of 418 |
Figure 11.10 Swath Plot in Z for Li Domain
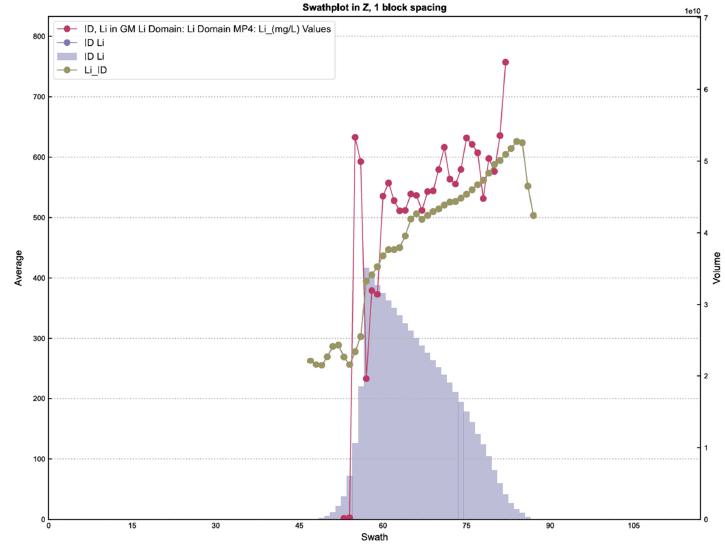
Source: Aquatec, (2025)
| 11.2.7 | Resource Classification |
Mineral Resource zones were classified using drill hole spacing and density criteria outlined by Houston et al. (2011) for lithium brine deposits (Figure 11.13). Different classification approaches were applied to Olaroz N and Cauchari South to reflect their different stages of development. Mineral Resource zones are summarized in Table 11.5 and described below.
Olaroz North is an advanced-stage area supported by a high density of drilling, sampling, and production data. Given the maturity of exploration and the substandial database, Mineral Resource classification in this area was based on drill hole density.
For classification purposes, Olaroz North was subdivided into two domains (Figure 11.11):
| · | Central Olaroz, corresponding to the active production wellfield; and | |
| · | Olaroz N, representing the northernmost project area. |
Lithium Argentina AG., 2026 Cauchari-Olaroz S-K 1300 Technical Report Cauchari-Olaroz Salars, Argentina | Page 263 of 418 |
Drill density was calculated within defined polygonal areas using the following relationship:
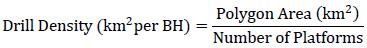
The polygons used in the calculations were extended beyond the property boundary, which increases the area attributed to each borehole and results in a more conservative density estimate. Individual platforms were used to represent grouped boreholes. Only platforms with brine chemistry data were included in the density calculation for each depth interval.
Mineral Resource classes were assigned based on the drill density thresholds for immature (clastic dominated) salars as defined by Houston et al. (2011) and are presented in Table 11.5:
| · | Inferred: up to 100 km²/BH. | |
| · | Indicated: up to 25 km²/BH. | |
| · | Measured: up to 6.25 km²/BH (Table 11.5). |
Cauchari South
Cauchari South is at an earlier stage of exploration and is characterized by lower data and borehole density. Resource classification in this area was therefore based on drill hole spacing rather than density. Classification categories were defined using radial distances from boreholes and wells with brine chemistry data, as follows:
| · | Measured: radius = 1,250 m. | |
| · | Indicated: radius = 2,500 m. | |
| · | Inferred: radius = 3,500 m. |
| Table 11.5 Drill Platform Density and Preliminary Classification by Elevation Interval | ||||
|
Polygon Area |
Depth Interval (mbgs) |
No. of with Samples |
Drill Density (km²/BH) |
Classification |
|
Northern Olaroz N Polygon Area = 63 km² |
3900–3800 | 2 | 31.7 | Inferred |
| 3800–3450 | 3 - 5 | 21.1 – 12.7 | Indicated | |
| 3450–basement | 1 | 63.3 | Inferred | |
|
Central Olaroz N Polygon Area = 200 km² |
3900–3450 | 40 - 76 | 5.0 – 2.6 | Measured |
| 3450–3300 | 12 - 27 | 16.7 - 7.4 | Indicated | |
| 3300–basement | 4 - 6 | 50.0 - 33.3 | Inferred | |
Lithium Argentina AG., 2026 Cauchari-Olaroz S-K 1300 Technical Report Cauchari-Olaroz Salars, Argentina | Page 264 of 418 |
Figure 11.11 Representative Cross Sections and Aerial View of the 2026 Measured, Indicated, and Inferred Mineral Resource Estimate
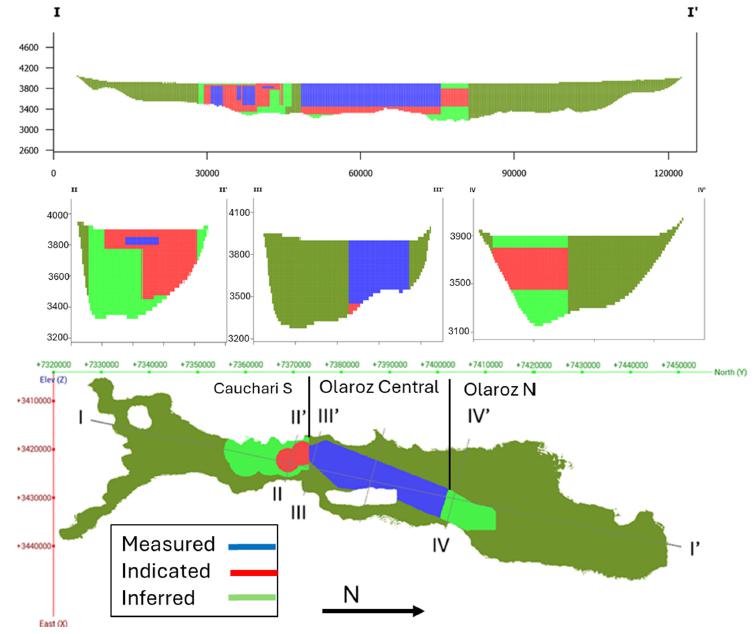
Source: Aquatec, (2025)
Lithium Argentina AG., 2026 Cauchari-Olaroz S-K 1300 Technical Report Cauchari-Olaroz Salars, Argentina | Page 265 of 418 |
| 11.3 | 2026 Mineral Resource Statement |
The Mineral Resource Estimate is presented in Table 11.6 and the following is noted:
| · | A lithium grade cut-off of 300 mg/L is used to define the Resource. |
| · | Mineral Resources are also expressed in the industry standard Lithium Carbonate Equivalent (LCE = Lithium × 5.323). |
| · | Mineral Resources are calculated with grade data from both before and during brine production, which started in 2018. Consequently, the mass of lithium produced up to Month and Year is conservatively excluded from the Resource Estimate. |
| · | According to operational data recorded for the 2018–2025 period, a total of 52,786 t of lithium. |
| · | It is noted that the mass of produced lithium is exceedingly small (<1%) relative to the total Measured and Indicated Mineral Resource. |
| Table 11.6 Summary of 2026 Lithium Mineral Resource Estimate – Exclusive of Mineral Reserves (1-12) |
|
Mineral Resource Classification |
Aquifer (m3) |
Brine (m3) |
Average Li (mg/L) |
Li (t) |
LCE (t) |
LCE (t) |
| Measured | 5.94E+10 | 5.89E+09 | 557 | 2,742,686 | 14,599,317 | 6,540,494 |
| Indicated | 3.87E+10 | 3.82E+09 | 571 | 2,122,708 | 11,299,172 | 5,062,029 |
| Measured + Indicated | 9.81E+10 | 9.71E+09 | 562 | 4,865,393 | 25,898,489 | 11,602,523 |
| Inferred | 2.77E+10 | 3.24E+09 | 567 | 1,806,125 | 9,614,004 | 4,307,073 |
| Notes: |
| 1. | S-K 1300 definitions were followed for Mineral Resources and Mineral Reserves. | |
| 2. | The independent Qualified Person for the 2026 Mineral Resource Estimate is Mark King, PhD. PGeo, FGC. | |
| 3. | Mineral Resources are also expressed in the industry standard Lithium Carbonate Equivalent (LCE = Lithium × 5.323). | |
| 4. | The mass of lithium produced from 2018–2025 period (52,786 t = 280,982 t LCE) has been removed from the Mineral Resource. | |
| 5. | The Effective Date of the Mineral Resource Estimate is December 31st, 2025. | |
| 6. | The Mineral Resource Estimate is not a Mineral Reserve Estimate and does not have demonstrated economic viability. There is no certainty that all or any part of the Mineral Resources will be converted to Mineral Reserves. | |
| 7. | Calculated brine volumes only include Measured, Indicated, and Inferred Mineral Resource volumes above cut-off grade. | |
| 8. | Comparisons of values may not add due to rounding of numbers and the differences caused by use of averaging methods. | |
| 9. | A lithium grade cutoff of 300 mg/L is used to define the Mineral Resource. | |
| 10. | The Mineral Resources Estimates are net of Mineral Reserves (421,854 t Li) without Process efficiency that has been removed from the Estimated Measured Resources | |
| 11. | The commodity price of $18,000 / tonne for lithium carbonate (2025) for the life of the project was used to assess the economic viability for the mineral estimates, as described below. |
Lithium Argentina AG., 2026 Cauchari-Olaroz S-K 1300 Technical Report Cauchari-Olaroz Salars, Argentina | Page 266 of 418 |
A lithium cut-off concentration grade of 300 mg/L was conservatively applied for the 2019 Mineral Resource and Mienral Reserve Estimate. For comparison of the utilized cut-off grade to a breakeven cut-off grade calculation, the following analytical formula can be used based on the controlling inputs as quantified for LOM:
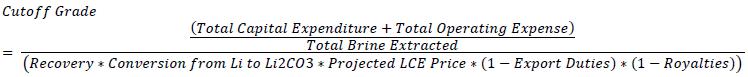
Where:
Total Capital Expenditure= US$ 1,781 million
Total Operating Expenditure = US$ 6,020 million
Cost of Capital = US$ 178 million (10 percent of Total Capital)
Total Brine Extracted = 628 Mm3
Conversion from Li to Li2CO3 (LCE) = 5.323
Projected LCE Price = US$ 20,000 per metric ton of LCE
Export Duties =4.5%
Royalties= 3.0%
Calculated Recovery= 65 %.
Resulting in a calculated breakeven cut-off grade of approximately 200 mg/L.
| 11.4 | Reasons for Differences from Previous Estimate (Burga, 2025) |
Table 11.7 compares the current and previous (Burga et al. 2025) Mineral Resource Estimate. The current Mineral Resource is 8% larger for the Olaroz North Project Area and 42% in total. The differences between the two Mineral Resource Estimates are attributable to the following factors:
| · | The current Mineral Resource Estimate includes production samples that provide evidence of sustainable grades during the sustained production pumping, supporting expansion of Measured and Indicated Mineral Resource zones. |
| · | An updated Mineral Resource classification method was used, that is based on well density instead of well spacing. The updated method is acceptable due to the enhanced resource certainty that is afforded primarily by sustained production pumping, and also by additional drilling and sampling. This classification update has resulted in zones that are relatively continuous, as opposed to the discontinuous zones derived through well spacing. |
| · | The Mineral Resource zone in Olaroz North has been expanded by 19% due to the classification update carried out due to the reasons exposed above. |
| · | The new Mineral Resource zone also includes areas of the Cauchari South basin that were not included in the previous Mineral Resource Estimate. The major increase in Mineral Resources is because of the addition of Cauchari South Exploration Campaign data which account for 6,746,787 t LCE Measured + Indicated and 4,467,557 t LCE Inferred Mineral Resources, making a total addition of 11,214,344 t LCE coming from Cauchari South area. |
Lithium Argentina AG., 2026 Cauchari-Olaroz S-K 1300 Technical Report Cauchari-Olaroz Salars, Argentina | Page 267 of 418 |
| · | An updated characterization of porosity values for the hydrostratigraphic units, based on 762 samples taken from the different wells and piezometers (Section 11.3.4) during different field campaigns carried out in the previous years. |
Figure 11.12 shows a comparison between the current and previous Mineral Resource Estimation areas (Burga et al., 2025).
|
Table
11.7 | ||||
| Resource Classification |
Resources LEC (tonnes) |
Difference | ||
| Current (Effective date December 31, 2025) |
Previous (Burga et al. (2025)) (Effective date |
Tonnes | % | |
| Measured | 14,599,317 | 3,040,109 | 11,559,208 | 380% |
| Indicated | 11,299,172 | 13,177,246 | -1,878,074 | -14% |
| Measured + Indicated | 25,898,489 | 16,217,355 | 9,681,134 | 60% |
| Inferred | 9,614,004 | 4,722,700 | 4,891,304 | 104% |
Lithium Argentina AG., 2026 Cauchari-Olaroz S-K 1300 Technical Report Cauchari-Olaroz Salars, Argentina | Page 268 of 418 |
Figure 11.12 Comparison Between the Extension of the Current and Previous (Burga, 2025) Mineral Resource Estimates
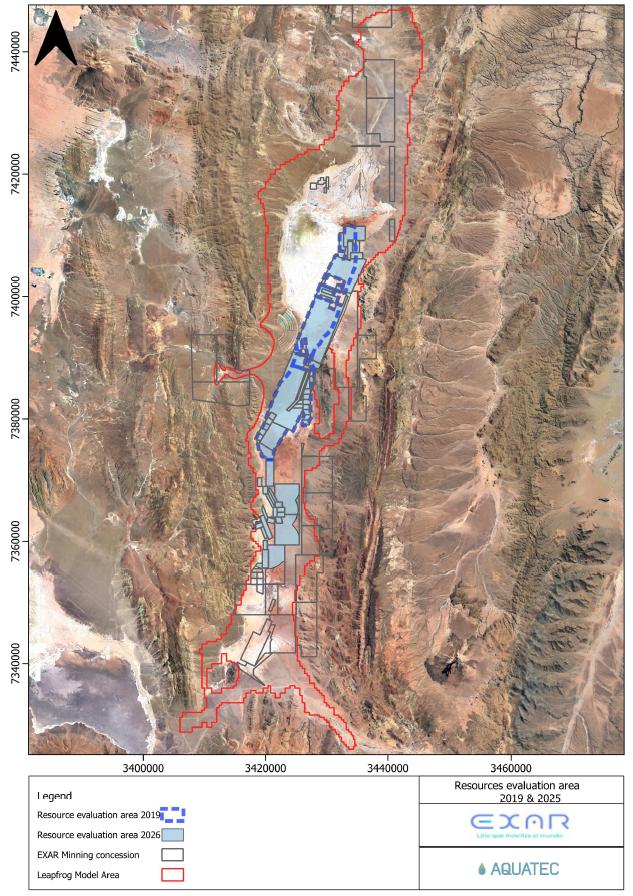
Source: Aquatec, (2025)
Lithium Argentina AG., 2026 Cauchari-Olaroz S-K 1300 Technical Report Cauchari-Olaroz Salars, Argentina | Page 269 of 418 |
| 11.5 | Confidence in the Mineral Resource Estimate |
In the opinion of the Qualified Person, the Mineral Resource Estimate has been prepared using data of sufficient quality, quantity, and spatial distribution to support the geological, hydrogeological, and hydrostratigraphic interpretations on which it is based. Confidence in the estimate is supported by:
| · | Extensive exploration data collected during the 2017, 2018, and 2019 programs, which have been previously published, together with production and operating data provided by Exar, including brine chemistry, lithium concentration, lithological information, and data used to inform the updated hydrostratigraphic model |
| · | The estimate has further benefited from an extended period of production pumping since 2018, during which 39 production wells were progressively brought online in the current exploitation area at Cauchari-Olaroz and 82,847,494 m3 of brine was extracted between 2018 and 2025, equivalent to 280,982 t of LEC or 52,786 t of lithium. |
| · | Recommendations from previous technical reports have been implemented through further field investigations, including specific yield testing. The resulting updated specific yield dataset, comprising 714 samples collected during multiple campaigns, has improved the basis for estimation and supports the classification of the Mineral Resource. |
Consequently, the new Mineral Resource Estimate is based on a more robust conceptual model, supported by a significantly larger validated dataset of:
| · | Chemical data with an addition of samples from 39 production wells and 20 pumping tests, and |
| · | Lithological information from 340 locations (wells, piezometers). |
To the QPs knowledge, there are no other known factors—such as environmental, permitting, legal title, taxation, socio-economic, or political issues—that could materially impact this Mineral Resource estimate, except as disclosed in this report. For details on relevant environmental and community activities, see Section 17.0.
Lithium Argentina AG., 2026 Cauchari-Olaroz S-K 1300 Technical Report Cauchari-Olaroz Salars, Argentina | Page 270 of 418 |
| 12.0 | Mineral Reserve Estimate |
| 12.1 | Background |
Mineral Reserve classifications used in this section conform to the S-K regulations:
| · | Mineral Reserve: a Mineral Reserve is an estimate of tonnage and grade or quality of Indicated and Measured Mineral Resources that, in the opinion of the qualified person, can be the basis of an economically viable project. More specifically, it is the economically mineable part of a Measured or Indicated Mineral Resource, which includes diluting materials and allowances for losses that may occur when the material is mined or extracted. |
| · | Modifying Factors: modifying factors are the factors that a qualified person must apply to Indicated and Measured Mineral Resources and then evaluate in order to establish the economic viability of Mineral Reserves. A qualified person must apply and evaluate modifying factors to convert Measured and Indicated Mineral Resources to Proven and Probable Mineral Reserves. These factors include, but are not restricted to: Mining; processing; metallurgical; infrastructure; economic; marketing; legal; environmental compliance; plans, negotiations, or agreements with local individuals or groups; and governmental factors. The number, type and specific characteristics of the modifying factors applied will necessarily be a function of and depend upon the mineral, mine, property, or project. |
| · | Probable Mineral Reserve: a Probable Mineral Reserve is the economically mineable part of an Indicated and, in some cases, a Measured Mineral Resource. |
| · | Proven Mineral Reserve: A Proven Mineral Reserve is the economically mineable part of a Measured Mineral Resource and can only result from conversion of a Measured Mineral Resource. |
The mining method to be employed for the Project involves an extraction wellfield using production-scale wells for pumping brine from the aquifer in the Resource Evaluation Area. As such, the Mineral Reserve for the Project is identified based on the extraction wellfield unit and the Measured and Indicated Mineral Resources within the resource model (Section 11.0).
The division between Proven and Probable Mineral Reserves is based on: (1) sufficiently short duration of wellfield extraction to allow a higher degree of predictive confidence, yet long enough to enable significant production, and (2) a duration long enough to enable accumulation of a strong data record to allow subsequent conversion of Probable Mineral Reserves to Proven Mineral Reserves. Provided a detailed data record for monitoring wellfield operations and further updates to model calibration, the authors believe it will be possible to convert Probable Reserves to Proven Reserves on an ongoing basis.
Lithium Argentina AG., 2026 Cauchari-Olaroz S-K 1300 Technical Report Cauchari-Olaroz Salars, Argentina | Page 271 of 418 |
| 12.2 | Overview |
This Mineral Reserve Estimate was developed using MODFLOW-USG (Panday et al., 2013), a control volume finite difference code, coupled with the Groundwater Vistas modeling interface (ESI, 2015). The MODFLOW-USG platform is publically available groundwater flow and transport code that is an industry standard for a wide variety of groundwater applications. It has been verified and validated in public forums and in professional publications by the United States Geological Survey (Panday et al., 2013). MODFLOW-USG software is an effective tool for salar modelling because it enables stable simulation of two challenging and critical salar processes: evaporative flux from the salar surface and lithium capture at production wells. This software was also used for the previous Mineral Reserve Estimate (Burga et al., 2025).
| · | The primary steps and considerations used to develop and apply the numerical groundwater model for the purposes of Mineral Reserve estimation were as follows: |
| · | The calibrated MODFLOW model was developed to reliably simulate pumping from the production wellfield. Specifically, it was used to verify the feasibility to produce 40,000 tpa LCE from the Project Processing Plant until end of 2060). In other words, the target production considers processing losses. |
| · | The MODFLOW model was used to simulate wellfield pumping, to estimate two primary feasibility parameters: lithium recovery and drawdown in production wells. A previous Mineral Reserve Estimate study by LAR (2012) concluded that rigorous consideration of variable density within the aquifer did not materially affect these two parameters. Consequently, variable-density flow and transport was not simulated in the previous and current numerical modelling analyses. |
| · | The geology (HSUs), lithium distribution, Sy distribution and Mineral Resource classes were transferred directly into MODFLOW from the Leapfrog model described in Section 11.0. Some differences were incurred in this transfer, due to the differing size of the MODFLOW mesh. However, these differences were generally small. |
| · | The lateral and vertical extents of the model were defined to coincide with the natural boundaries of the salar. The objective in defining the model domain was to position its boundaries sufficiently beyond the Resource Evaluation Area so that they would not significantly constrain the production wellfield simulations, while still maintaining the domain at a practical size for numerical modelling. |
| · | Hydraulic and grade conditions were assigned along each boundary of the numerical groundwater model based on an evaluation of sub-watershed boundaries and interpreted surficial contacts alluvium and bedrock following the updated HSU model, as well as through the incorporation of a basin-wide water balance model of the entire basin (Sections 12.5 and 12.6). |
| · | Hydraulic and transport properties were evaluated and assigned for each HSU in the model (Section 12.7). A 3-D lithium concentration field was imported directly into MODFLOW from the updated resource (Leapfrog) model (Section 11.0). In zones with no available data outside of the Resource Evaluation Area, initial lithium concentrations were conservatively set to 11 mg/l. |
| · | Steady state (pre-development) calibration was conducted with spatially representative pre-development hydraulic head data. Transient calibration was conducted with head data from historic pumping tests, recent pumping tests, and recent production pumping. |
Lithium Argentina AG., 2026 Cauchari-Olaroz S-K 1300 Technical Report Cauchari-Olaroz Salars, Argentina | Page 272 of 418 |
| · | A conceptual well design was input to the model, based on the current and projected well construction details and production rates. The wellfield was simulated over the life of mine estimate of 40 years from the start of production. Well locations and production rates were adjusted as required, to maximize overall extraction (Section 12.10). |
| · | To align with future expansions, the total brine pumped from the production wellfield through the end of 2060 is lower than the amount considered in previous Reserve estimations. Therefore, the Stage I Reserve estimate is consistent with the planned Stage 2 expansion. Ongoing dynamic modelling work to scale the project beyond 80 ktpa LCE, including the introduction of DLE technology with higher recovery efficiencies, will further support the Stage 2 expansion. |
| · | The wellfield was simulated with the MODFLOW Well Package, forming the basis. of the Mineral Reserve Estimate. Extracted concentrations represent a composite value that is weighted by the transmissivity of each model layer. The simulated wells are assumed to be 100 percent efficient. |
| · | The Mineral Reserve Estimate has been conservatively modeled and stated as a Proven Mineral Reserve from the start of Year 1 through to the end of Year 10. These years are relative to the Effective Date of this Estimate (that is, from 2026 to 2035). It is stated as a Probable Mineral Reserve from the start of Year 11 to the end of the forecasted production period (2060) |
| 12.3 | Conceptual Model |
Exar has advised the authors that it is unaware of any environmental, permitting, legal, title, taxation, socio-economic, marketing, or political factors, that may materially affect the Mineral Reserve Estimate contained in this Report
The conceptual model of recharge and discharge for a closed-basin, salar watershed is shown in Figure 12.1. As shown, groundwater is recharged by precipitation in upland mountainous areas and directly to the salar. Under natural conditions, 100% of discharge occurs through evapotranspiration, primarily on the margins of the salar where the water table may be at or near the surface, but also in the more central zones.
Groundwater inflow from upland areas to the salar occurs at the margins of the salar and moves towards the center of the salar, while simultaneously undergoing evapotranspiration. Consequently, inflowing water is relatively fresh as it enters the salar and its salinity increases with movement towards the center. The evapotranspiration rate is highest in the salar margins, where the water table is closest to the surface and the water is relatively fresh (freshwater evaporates more quickly). The rate decreases towards the center of the salar.
Groundwater flow in the salar is influenced by standard hydraulic gradients caused by recharge in elevated areas and discharge (due to evaporation) in lower areas. It is also influenced by density gradients, whereby freshwater entering the salar tends to flow on top of the higher density brine that has accumulated within the salar.
Lithium Argentina AG., 2026 Cauchari-Olaroz S-K 1300 Technical Report Cauchari-Olaroz Salars, Argentina | Page 273 of 418 |
Figure 12.1 Conceptual Model and Model Boundary Conditions
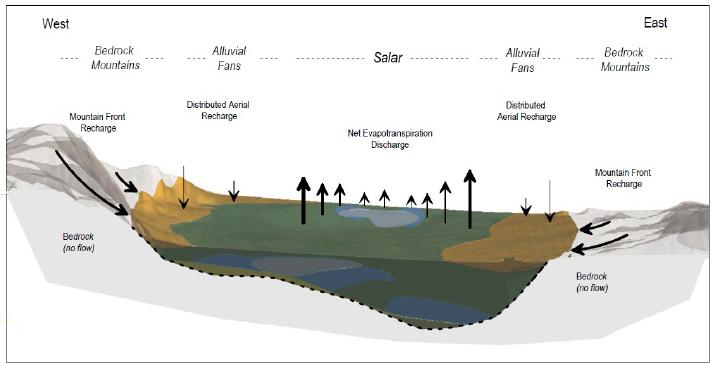
Source: Burga et al. (2020)
| 12.4 | Numerical Model Construction |
The model domain is shown in Figure 12.2. It covers an area of about 1,410.5 square kilometers and encompasses the sedimentary and evaporite deposits comprising Cauchari-Olaroz area. The model domain (Figure 12.3) was designed with the following features, to represent the Conceptual Model and to enable Mineral Reserve estimation:
| · | It includes the Mineral Resource estimation area. |
| · | It is large enough to minimize influence of applied boundary conditions on production well simulations. and |
| · | The base of the model domain was set at the top of bedrock basin in which the salar sediments were deposited. |
| · | It enables freshwater inflow from drainage sub-basins that surround the salars. |
| · | It promotes discharge from the basin via evaporation from the moist salar surfaces. |
| · | It promotes groundwater movement is from the margins of the salars, where mountain front recharge enters the model domain as groundwater underflow, toward the center of the salar. |
Precipitation recharge is generally applied to the model surface outside evaporative zones (consistent with Figure 12.1).
Lithium Argentina AG., 2026 Cauchari-Olaroz S-K 1300 Technical Report Cauchari-Olaroz Salars, Argentina | Page 274 of 418 |
The boundaries of a numerical model also represent the conditions defined in the Conceptual Model, and are as follows:
| · | Western Boundary: Cenozoic volcanic units form a high-relief hydrogeological divide, limiting groundwater flow toward the salar. |
| · | Eastern Boundary: Topographic highs form a regional hydraulic divide, restricting lateral inflow from eastern basins. |
| · | Southern Boundary: Elevated structures create a partially closed boundary, limiting groundwater exchange to the south. |
| · | Northern Boundary: Ignimbritic plateaus form a topographic and hydrogeological divide, restricting flow toward the Salar de Olaroz. |
The model domain encompasses the sedimentary and evaporite deposits comprising Cauchari-Olaroz area. The extent of the model domain, which covers an area of about 1,410.5 square kilometers, is shown on Figure 12.1.
| 12.5 | Numerical Model Mesh |
The horizontal discretization of the domain was initially defined with a grid of 800 × 800 m cells, with progressive refinement applied in the area where the wells used in the long-term pumping tests and production are located. In this area, the cell size was reduced to 100 × 100 m to improve local hydraulic resolution.
Refinement was implemented using the MODFLOW USG Quadtree Refinement scheme, which allows smaller cell sizes in zones of interest, avoiding excessive subdivision of the rest of the domain. This made it possible to maintain a reduced number of elements in the model, optimizing computational efficiency (Figure 12.2).
As a result, the domain is divided into a total of 173,124 cells, with 152 rows and 55 columns, of which 83,752 are active cells.
The vertical discretization of the model was established based on the geological interpretation developed in Leapfrog, where six Hydrostratigraphic Units (HSUs) were defined. These units were represented in the numerical model using six vertical layers (Figure 12.3). To accurately simulate lithium transport, vertical refinement was also applied, dividing each HSU into six vertical elements.
The vertical discretization of the model was established based on the geological interpretation developed in Leapfrog, where six Hydrogeological Units were defined. These units were represented in the numerical model using six vertical layers, as illustrated in (figure 15.4). To correctly simulate lithium transport, vertical refinement was applied, dividing each hydrogeological unit into six vertical elements.
Lithium Argentina AG., 2026 Cauchari-Olaroz S-K 1300 Technical Report Cauchari-Olaroz Salars, Argentina | Page 275 of 418 |
Figure 12.2 Numerical Model Grid with Inactive Cells
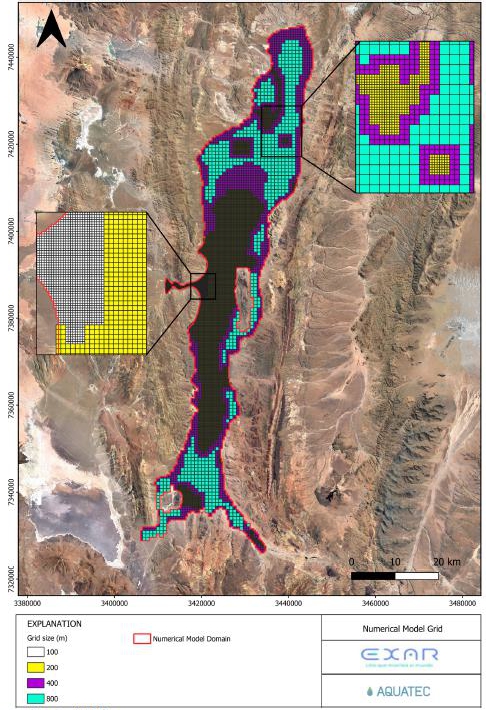
Source: Aquatec (2025)
Lithium Argentina AG., 2026 Cauchari-Olaroz S-K 1300 Technical Report Cauchari-Olaroz Salars, Argentina | Page 276 of 418 |
Figure 12.3 Vertical Discretization of the Geological Model in Leapfrog (top) Versus the Numerical Flow Model in GWV (bottom)
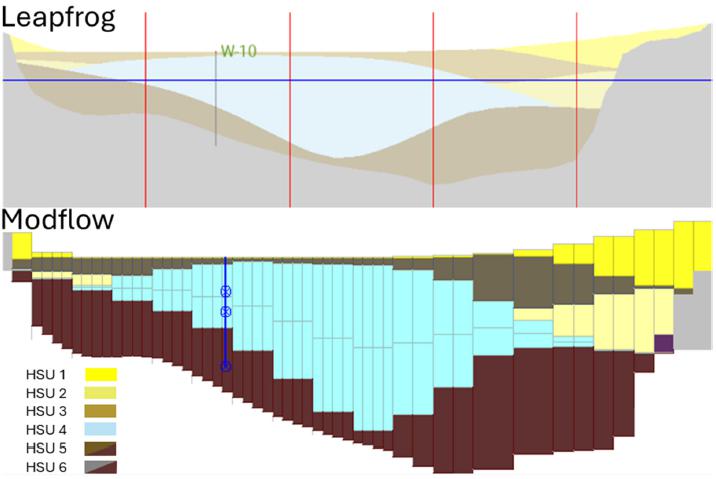
Source: Aquatec (2025)
| 12.6 | Numerical Model Boundary Conditions |
| 12.6.1 | Overview |
Numerical boundary conditions were applied to simulate groundwater flow conditions in the Conceptual Model, namely:
| · | No-flow boundaries were assigned to inactive areas of the model where groundwater inflow is not expected to occur. |
| · | Lateral recharge from upland areas through runoff and subsurface flow were simulated using a prescribed flux (Neumann) boundary condition. |
| · | Outflows due to pumping were also represent with a prescribed flux (Neumann) boundary condition. |
| · | Direct recharge to the top surface of the salar was represented using an areal flux boundary condition, distributed over the surface of the target area. |
Lithium Argentina AG., 2026 Cauchari-Olaroz S-K 1300 Technical Report Cauchari-Olaroz Salars, Argentina | Page 277 of 418 |
| · | Lagoons and surface channels were simulated with a mixed (Cauchy) boundary condition, allowing dynamic interaction between surface water and the underlying aquifer. |
| · | To simulate the hydraulic behavior of lagoons and surface channels, a mixed (Cauchy) boundary condition was employed, allowing dynamic interaction between surface water and the aquifer |
| 12.6.2 | Zero flow |
Zero-flow (Neumann, Q = 0) boundaries were applied to the base of the model (equivalent to base of the salar) and lateral edges where no active groundwater occurs. These locations are represented as inactive cells to confine flow within the basin. The model base corresponds to impermeable bedrock, as supported by geophysical and exploratory well data
The lateral boundaries of all model layers, except the top one, are assigned zero-flow boundary conditions, assuming that lateral hydraulic connection with the aquifer occurs primarily through the shallow detritic layer.
| 12.6.3 | Recharge |
Direct recharge from precipitation and lateral recharge from runoff and percolation were distinguished based on the eight sub-basins that feed the system (Figure 12.4).
| · | Direct recharge is assigned to the upper surface, to represent percolation of precipitation and/or surface water. The assigned values are applied in five distinct zones: two directly associated with the salar, and the remaining three associated with rivers located throughout the numerical model domain, as shown in Figure 12.4. |
| · | Lateral recharge represents contributions from upland runoff and recharge that enters the salar. In the model, this recharge is located along the edges of the domain, corresponding to the interface with each representative sub-basin. |
To represent lateral recharge, a prescribed flux boundary condition is applied, with a specific number of wells assigned to each zone according to the length of the boundary through which each sub-basin discharges.
Table 12.1 presents the different lateral recharge zones, the number of wells assigned, and the model layers in which the inflow is applied for each sub-basin in the numerical model. The spatial distribution of this recharge is shown in Figure 12.4.
Lithium Argentina AG., 2026 Cauchari-Olaroz S-K 1300 Technical Report Cauchari-Olaroz Salars, Argentina | Page 278 of 418 |
| Table 12.1 Summary of Mountain Front Recharge | |
| Sub-basin |
Recharge (L/s) |
| Sub-basin 0 | 356.46 |
| Archibarca | 248.50 |
| Arizado | 51.80 |
| Guayaos | 78.48 |
| Olaroz | 84.01 |
| Rosario | 1,182.75 |
| Tocomar | 423,19 |
| Turi-Lari | 215.78 |
| Total | 2,640.97 |
Lithium Argentina AG., 2026 Cauchari-Olaroz S-K 1300 Technical Report Cauchari-Olaroz Salars, Argentina | Page 279 of 418 |
Figure 12.4 Direct and Lateral Precipitation Recharge Zone in the Numerical Model
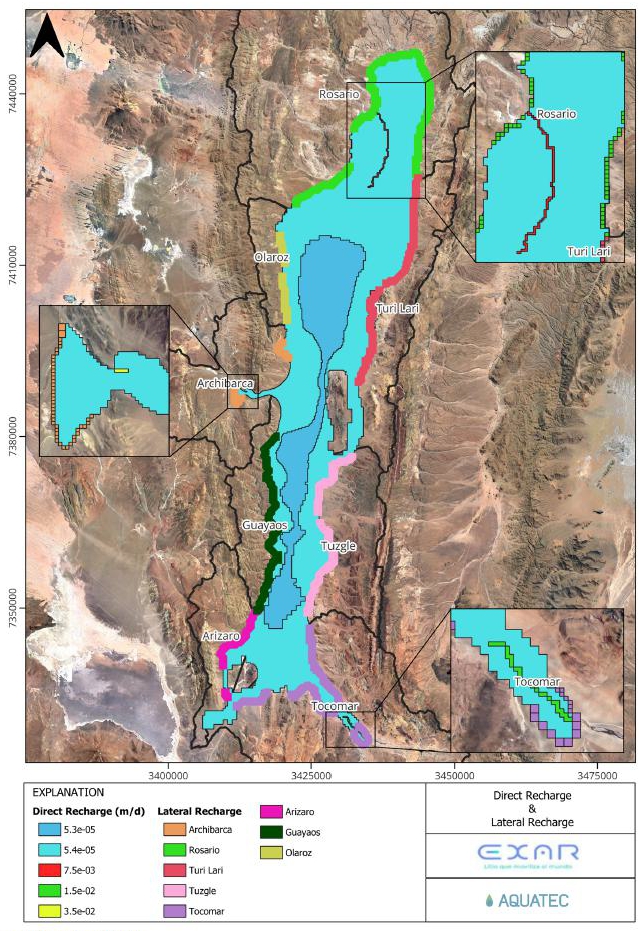
Source: Aquatec (2025)
Lithium Argentina AG., 2026 Cauchari-Olaroz S-K 1300 Technical Report Cauchari-Olaroz Salars, Argentina | Page 280 of 418 |
| 12.6.4 | Evaporation |
Four distinct evaporation zones were defined in the numerical model (see Figure 12.5). The model also accounts for the variation of evaporation with the depth of the water table. Evaporation curves were defined using a specified number of specific segments. The number of segments, the maximum surface evaporation rate, and the maximum depth to which evaporation acts (extinction depth) constitute the input data required by the numerical model.
Specifically, five segments were defined for each evaporation curve. Table 12.2 presents the points defining each segment, along with the normalized points based on extinction depth and evaporation rate, necessary to define the evaporation curve within the numerical model. The evaporation zones are shown in Figure 15.6.
| Table 12.2 Definition Points for the Numerical Model Segments | ||
| Zone |
ET Rate (m/d) |
Extinction (m) |
| 1 | 0.0000 | 0.00 |
| 2 | 0.0022 | 1.50 |
| 3 | 0.0049 | 1.65 |
| 4 | 0.0060 | 1.40 |
Lithium Argentina AG., 2026 Cauchari-Olaroz S-K 1300 Technical Report Cauchari-Olaroz Salars, Argentina | Page 281 of 418 |
Figure 12.5 Distribution of Evaporation Zones in the Numerical Model
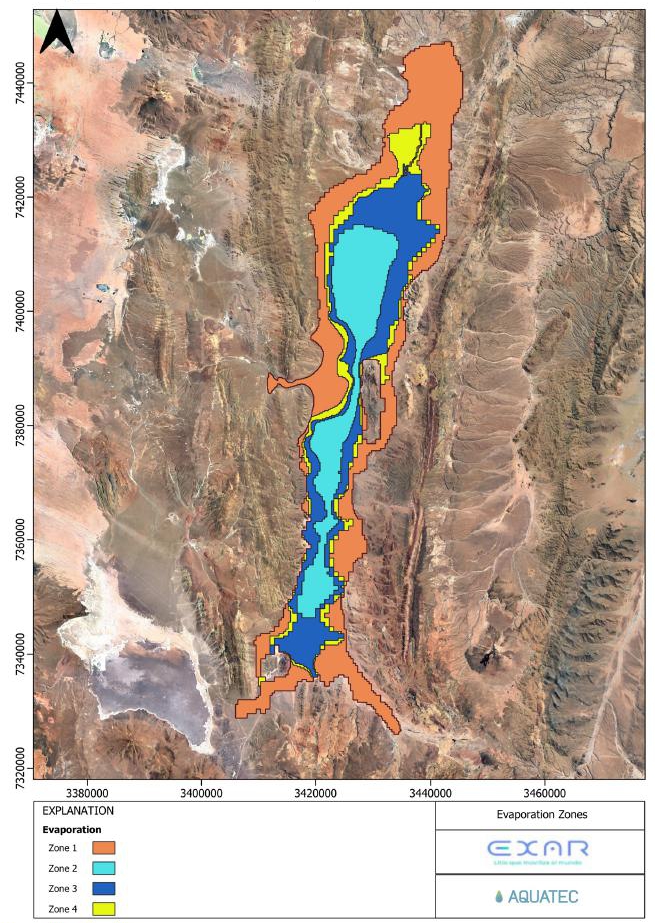
Source: Aquatec (2025)
Lithium Argentina AG., 2026 Cauchari-Olaroz S-K 1300 Technical Report Cauchari-Olaroz Salars, Argentina | Page 282 of 418 |
| 12.6.5 | Archibarca Zone |
Along the salar side of the Archibarca Fan, a series of lagoons are intermittently present, corresponding to the zone of freshwater discharge from the fan to the near-surface of the salar. Accordingly, they are represented in the model as with a non-linear mixed (drain) boundary condition, which allows discharge to the lagoons. Figure 12.6 shows the location of cells where the drain boundary condition was applied.
The prescribed drain head varies spatially and was set 0.25 m below the topographic elevation. A drain conductance value of CD = 500 m²/d was assigned.
Lithium Argentina AG., 2026 Cauchari-Olaroz S-K 1300 Technical Report Cauchari-Olaroz Salars, Argentina | Page 283 of 418 |
Figure 12.6 Cells Defined with a Drain Boundary Condition to Represent the Saline Interface and Lagoon Outcrop Zone
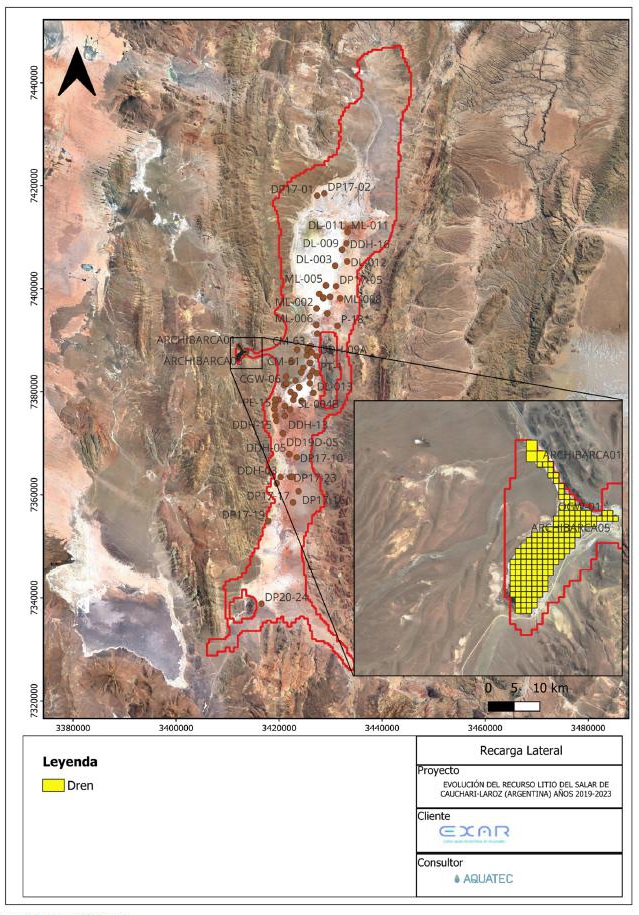
Source: Aquatec (2025)
Lithium Argentina AG., 2026 Cauchari-Olaroz S-K 1300 Technical Report Cauchari-Olaroz Salars, Argentina | Page 284 of 418 |
| 12.7 | Hydraulic Properties |
Hydraulic properties represented in the model include hydraulic conductivity in the three cardinal directions (Kx, Ky, and Kz), specific storage (Ss), and specific yield (Sy). Initial values used in the numerical model were those obtained from field test, previous numerical models, and published literature values for similar salar materials. Values were further adjusted through the calibration process. The final assigned values are shown in Table 12.3. A brief summary of the hydraulic and transport property values is provided below.
| · | Hydraulic Conductivity – The hydraulic conductivity (K) distribution used in the model was determined by (i) analysis of available pumping test data in the screened HSUs and (ii) calibration of the model in steady-state and transient modes. Without evidence of horizontal anisotropy from testing results, Kx is assigned to be equal to Ky. For reporting purposes horizontal hydraulic conductivity is termed radial hydraulic conductivity (Kr). Vertical anisotropy was evident from analysis of certain testing results. Where anisotropy was incorporated, values are based on results from pumping tests and literature estimates for similar materials. Sections showing representative K distributions in the model are provided in Figure 12.7. |
| · | Specific Storage – The range of specific storage assigned in the model are based on results from pumping tests in addition to literature estimates. The lower end of the range is near the compressibility of water, which indicates a rigid, low porosity material with small compressibility of the rock mass. The upper end of the range is indicative of higher porosity and larger compressibility. |
| · | Specific Yield and Effective Porosity – Assigned values of Specific Yield correspond to the Leapfrog model (Section 11.0). These values are based on laboratory analyses of core samples. Effective Porosity is assumed to be equivalent to Specific Yield and varies spatially based on the distribution of HSUs. |
| · | Dispersion – For modeling the transport of dissolved lithium in brine, assigned values of dispersivity correspond to 100 m for longitudinal dispersivity and 10 m for transverse dispersivity. These are standard values for large scale flow systems. Molecular diffusion was not included in the model because it has a negligible effect in large-scale regional models with evenly distributed solutes. |
| Table 12.3 Summary of Assigned Aquifer Parameter Estimates | |||||
| Hydrostratigraphic Unit |
Horizontal Hydraulic (m/d) |
Ratio (Kz/Kr) |
Specific (1/m) |
Specific | |
| Minimum | Maximum | ||||
|
HSU 1 – Upper Proximal Alluvial |
4.12* | 109 | 0.11 to 0.78 | 1.2E-4 | 0.1996 |
| HSU2–Intermediate Alluvial | 0.53 | 13.6 | 0.11 to 0.78 | 1.0E-05 | 0.0889 |
|
HSU 3 – Upper Distal Alluvial |
1.39 | 17.62 | 0.11 to 0.78 | 6.9E-05 | 0.1535 |
Lithium Argentina AG., 2026 Cauchari-Olaroz S-K 1300 Technical Report Cauchari-Olaroz Salars, Argentina | Page 285 of 418 |
| Table 12.3 Summary of Assigned Aquifer Parameter Estimates | |||||
| Hydrostratigraphic Unit |
Horizontal Hydraulic (m/d) |
Ratio (Kz/Kr) |
Specific (1/m) |
Specific | |
| Minimum | Maximum | ||||
|
HSU 4 – Evaporite–Alluvial Interbedded Unit |
0.24 | 7.41 | 0.11 to 0.78 | 1.2E-05 | 0.0644 |
|
HSU 5 – Lower Alluvial fan |
0.24 | 4.5 | 0.11 to 0.78 | 1.2E-05 | 0.137 |
The background data for hydraulic parameters included a total of 206 pumping tests conducted in the Cauchari-Olaroz basin. A subset of the most relevant tests was selected to initially populate the model based on: the screened unit in each pumping well, well depth and location, the year the test was performed, and test duration. Through this process, 31 constant-rate pumping tests were selected, which included 31 production wells and 61 observation wells. Hydraulic parameters obtained through these tests were analyzed and validated and were then used to initially populate the model (i.e., before further adjustment through calibration).
Final hydraulic parameter values were obtained through automatic calibration using pilot points with PEST, a parameter optimization module within MODFLOW. Figure 12.7, shows the final distribution of hydraulic conductivity, and the following trends are noted:
| · | The upper alluvium (HSU1) has the highest hydraulic conductivity, ranging from 4 to 109 m/d, with maximum values located in the northern Olaroz area. |
| · | HSU2 and HSU3, corresponding to the intermediate and upper distal alluvium, have hydraulic conductivity values ranging from 1 to 17 m/d. |
| · | HSU4 exhibit values between 0.25 and 7.5 m/d, with minimum values primarily located in the central part of the basin. |
| · | The lower alluvium (HSU5) shows hydraulic conductivity values ranging from 0.25 to 4.5 m/d, with the lowest values observed in the northeastern Olaroz area and the center of Cauchari. |
For Sy and Ss, (Table 12.3) The model has been calibrated assuming uniform values for each HSU. The values of Sy are the same as those used in the Mineral Resource Evaluation. In the case of Ss, the values were calibrated using PEST.
Lithium Argentina AG., 2026 Cauchari-Olaroz S-K 1300 Technical Report Cauchari-Olaroz Salars, Argentina | Page 286 of 418 |
Figure 12.7 Hydraulic Conductivity (m/d) for Each Model Layer
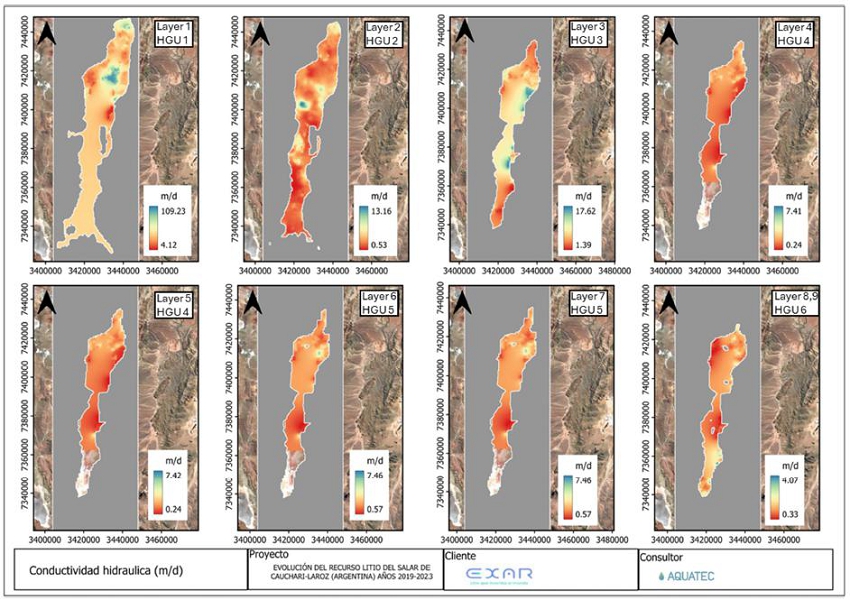
Source: Aquatec (2025)
Lithium Argentina AG., 2026 Cauchari-Olaroz S-K 1300 Technical Report Cauchari-Olaroz Salars, Argentina | Page 287 of 418 |
| 12.8 | Pre-Development Model Conditions |
The pre-development groundwater system in the salar was considered to be in equilibrium, where long term groundwater inflows are equal to groundwater outflows, with small changes in storage from year to year. The pre-development model was calibrated to “steady state” groundwater levels measured at 89 groundwater level monitoring locations in the basin representing 2013 conditions (prior to August 2013 when SDJ began operating) . The steady-state calibration relied on composite water levels from these wells. The potentiometric surface represented by the water levels shows groundwater flow directions consistent with the basin Conceptual Model (Figure 12.8).
Aquifer parameters for pre-development model calibration were varied to achieve an acceptable calibration. The simulated groundwater levels are considered to reasonably match pre-development conditions. A mean error of 1.06 m (RMS of 2.6%) was determined for the solution. The minimum, maximum and average residual (observed minus simulated groundwater elevation) is of 0, 8.5 and 2.4 m, respectively.
Figure 12.9 shows the spatial distribution of the residuals. Residuals lower than 4 meters are distributed through all the modelled surfaces. Higher residuals (up to 9 meters) are observed in the central area of the salar. The calibration points with the highest residuals correspond to deep piezometers, indicating lower vertical connectivity in some areas than indicated by field measurements. For example, PB-03, with a residual of -6 meters, is located below piezometer PF-03A, which has a residual of 0.2 m. This is generally considered a source of conservativism in the model since drawdown will tend to be felt more strongly in the upper layers.
Given these statistics, it was concluded that the steady-state distribution of heads could be reasonably used as the initial condition for predictive (future) model simulations.
Lithium Argentina AG., 2026 Cauchari-Olaroz S-K 1300 Technical Report Cauchari-Olaroz Salars, Argentina | Page 288 of 418 |
Figure 12.8 Piezometric Surface of the Pre-Development Model
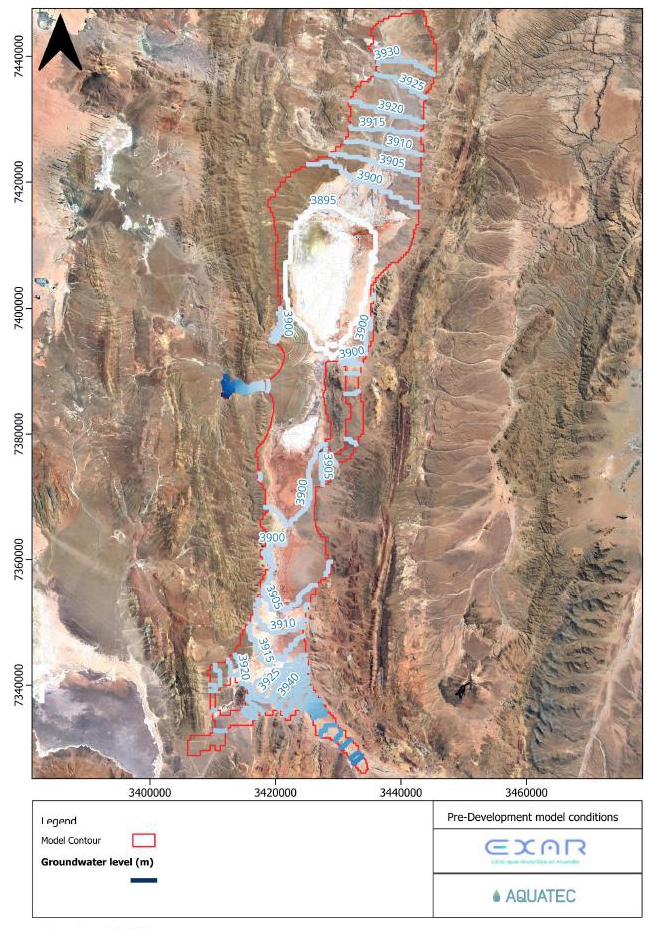
Source: Aquatec (2025)
Lithium Argentina AG., 2026 Cauchari-Olaroz S-K 1300 Technical Report Cauchari-Olaroz Salars, Argentina | Page 289 of 418 |
Figure 12.9 Distribution of the Residuals
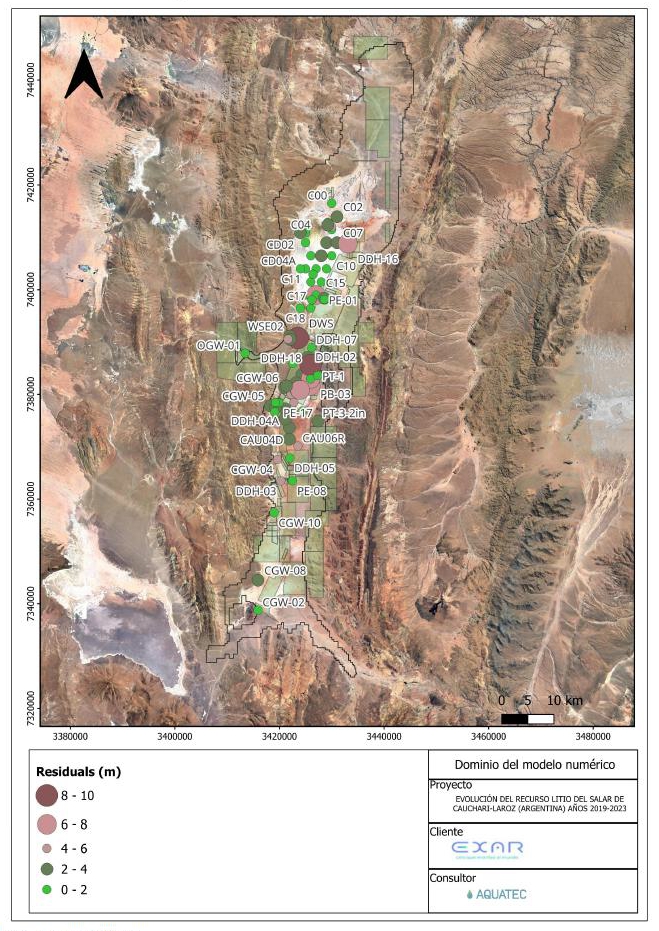
Source: Aquatec (2025)
Lithium Argentina AG., 2026 Cauchari-Olaroz S-K 1300 Technical Report Cauchari-Olaroz Salars, Argentina | Page 290 of 418 |
Figure 12-10 Observed Versus Calculated Residuals with Calibration Statistics for the Pre-development Model
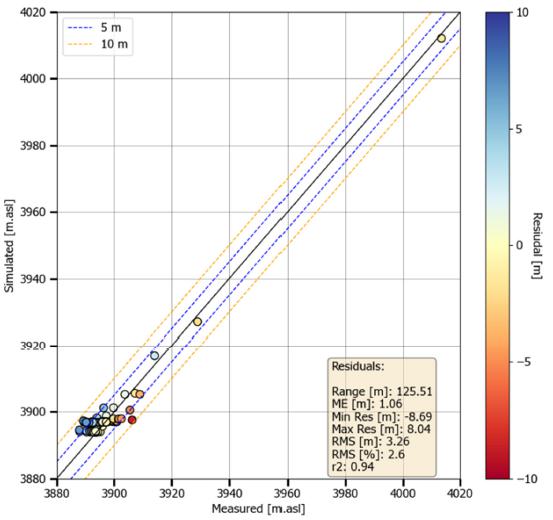
Source: Aquatec (2025)
The pre-development water budget for the model is provided in Table 12.4. The results show an acceptable error of 0.01 percent. Figure 12.11 shows the residuals histogram of the steady-state calibration, with results showing a relatively symmetric distribution centered around zero. This indicates that low residuals predominate with no systematic bias.
| Table 12.4 Summary of Model Boundary Fluxes | |
| Water Balance Component |
Modeled Flux (L/s) |
| Mountain Front Recharge | 2,180.5 |
| Areal Recharge | 907.88 |
| Evaporation | 2908.86 |
| Error | 0.3 |
| % Error | 0.01% |
Lithium Argentina AG., 2026 Cauchari-Olaroz S-K 1300 Technical Report Cauchari-Olaroz Salars, Argentina | Page 291 of 418 |
Figure 12.11 Head Residuals Histogram
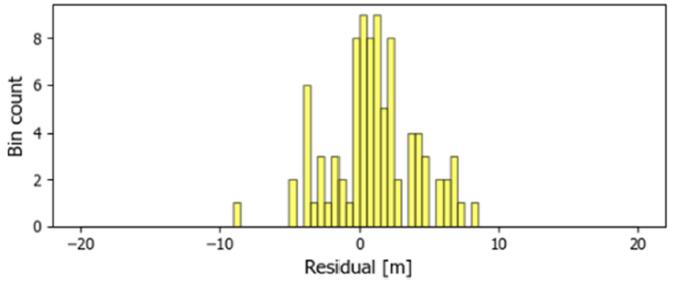
Source: Aquatec (2025)
| 12.9 | Transient Model Calibration |
As a starting point for the transient model calibration, a comparison has been made between the results from four (4) pumping tests conducted at different wells in the Cauchari sector and results from the steady state (pre-development) model. As shown in Figure 12.12, there is a good correspondence between the two sources of permeability estimates (the pumping test and the model calibration). Figure 12.12 also shows a comparison between the hydraulic conductivity obtained from pumping tests and from the steady state model. Note that values obtained from the pumping test match the harmonic mean of the permeabilities of the layers intersected by the wells.
Lithium Argentina AG., 2026 Cauchari-Olaroz S-K 1300 Technical Report Cauchari-Olaroz Salars, Argentina | Page 292 of 418 |
Figure 12.12 Hydraulic Conductivity Comparison Between the Pumping Test Analysis and the Model Calibrated Parameters
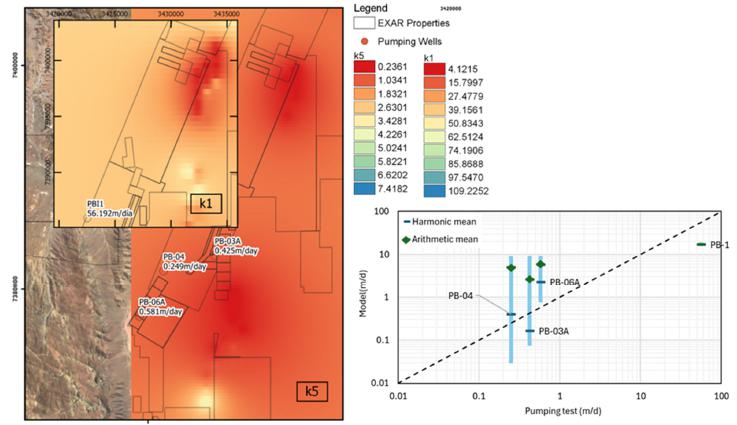
Source: Aquatec (2025)
Operation of the production wells since 2013 can be considered as a period of very long and highly relevant pumping tests, conducted in the most important zones of project. Consequently, the hydraulic monitoring (and brine chemistry sampling) conducted during this period was considered to take precedence over previous testing and was prioritized for transient calibration.
For the transient calibration, 215 observation wells were initially considered as calibration targets. Groundwater level trends were reviewed to ensure consistency with the assigned HSU, excluding or reassigning wells where screened intervals crossed multiple units. These criteria were mainly applied in data-dense areas; in areas with few monitoring wells, the original dataset was retained.
The final dataset maintains spatial and vertical coverage that was considered adequate while minimizing redundancy and noise. Calibration covers the ten-year operational period from August 2013 to December 2023.
Lithium Argentina AG., 2026 Cauchari-Olaroz S-K 1300 Technical Report Cauchari-Olaroz Salars, Argentina | Page 293 of 418 |
The simulation of water levels observed in the 215 wells is shown in Figure 12.13. This figure illustrates the comparison between the observed piezometric levels and the simulated levels in a pseudo-steady state for these wells. In this graph, the 1:1 line represents a perfect fit (where both levels are equal). Results show an RMS of 4.87%, an average residual value of around 4.71 meters (Figure 12.15 and Figure 12.14). As an example, Figure 12.15 and Figure 12.14 shows the calibration and residuals for measurements taken in October 2023 (After 10 years of simulation). Most of the points show a good agreement with residuals lower than 10 meters. Higher residuals are observed in six piezometers measuring the intermediate layers of the aquifer located in the Olaroz Basin (Figure 12.15 and Figure 12.14). Piezometers with highest residuals are located in areas surrounded by production wells. The high residuals in those points can be caused by:
| · | The temporal discretization that doesn’t allow to capture daily changes in the pumping wells. |
| · | Presence of local zones with low or high permeability, or aquitards not included in the model, that may create hydraulic connections between the piezometers and the head changes induced by pumping. |
These aspects should be further evaluated in future model updates as the project proceeds.
Figure 12.13 Observed Versus Calculated Piezometric Levels for the Transient Model at October 2023
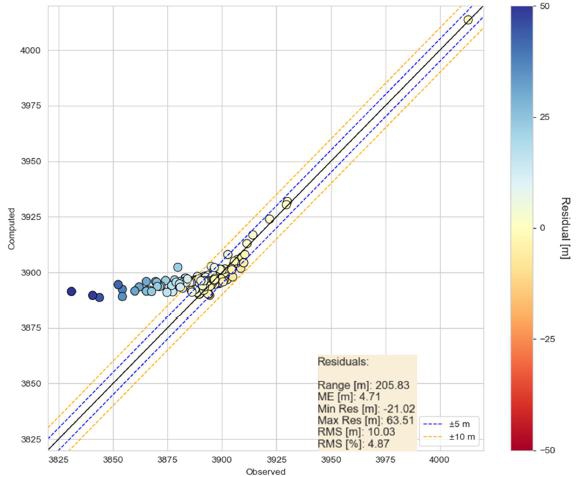
Source: Aquatec (2025)
Lithium Argentina AG., 2026 Cauchari-Olaroz S-K 1300 Technical Report Cauchari-Olaroz Salars, Argentina | Page 294 of 418 |
Figure 12.14 Distribution of the Residuals for October 2023
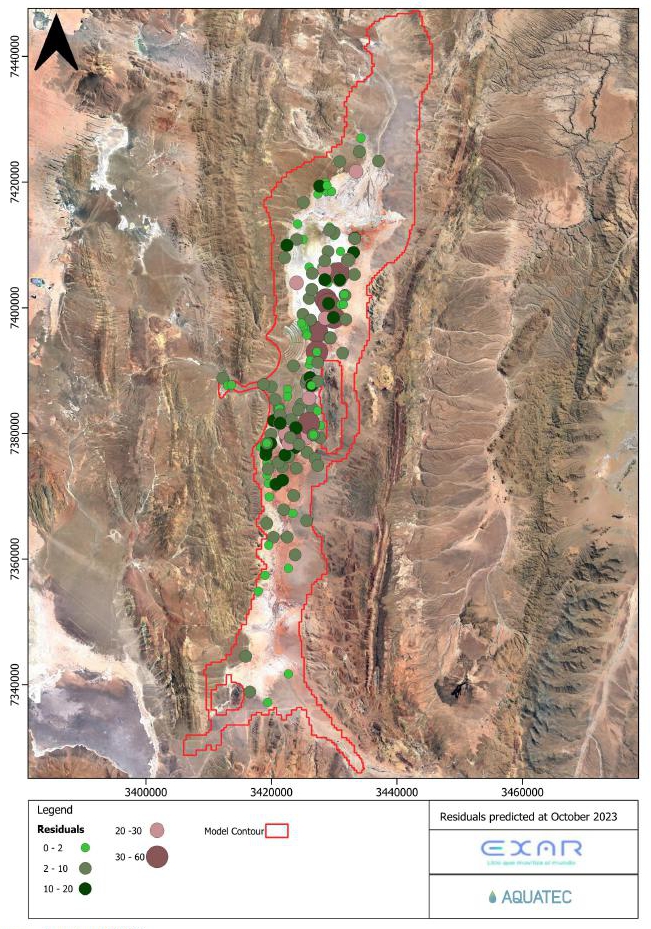
Source: Aquatec (2025)
Lithium Argentina AG., 2026 Cauchari-Olaroz S-K 1300 Technical Report Cauchari-Olaroz Salars, Argentina | Page 295 of 418 |
Figure 12.15 Head Residuals Histogram
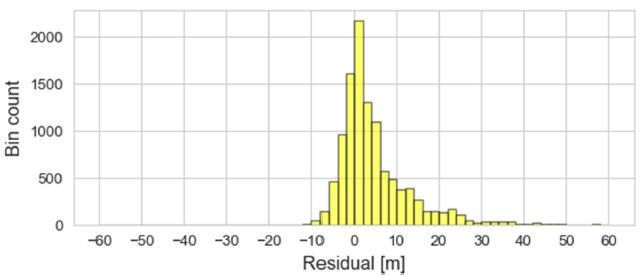
Source: Aquatec (2025)
After transient model calibration to the hydraulic data, the model was further verified by comparing simulated lithium grades (from production wells) to simulated values for the same wells. Results are shown in Figure 12.16 and are considered to be in reasonable agreement, for the purposes of using the model as a predictive tool for the Mineral Reserve Estimate. As shown, the model tends to be slightly conservative in grade prediction, in that underestimate the grades from the production wells.
Lithium Argentina AG., 2026 Cauchari-Olaroz S-K 1300 Technical Report Cauchari-Olaroz Salars, Argentina | Page 296 of 418 |
Figure 12.16 Average Lithium Grades from Production Wells Production Wells (2018-2025)
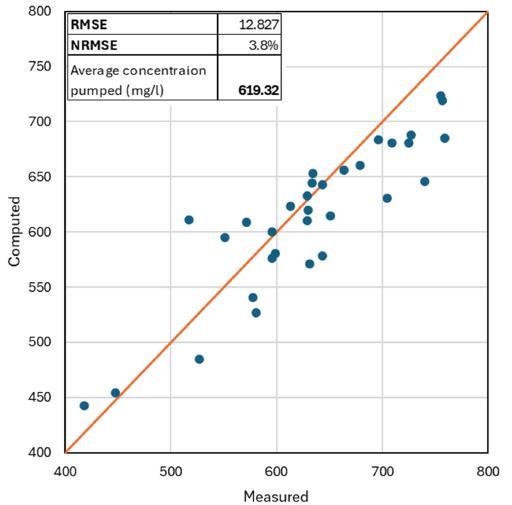
Source: Aquatec (2025)
| 12.10 | 2026 Mineral Reserve Estimate Model Results |
After calibration and verification, the model was used to predict production of LCE for the 40-year operational period (2018-2058). A series of simulations were conducted to Determine effective pumping rates and durations for each simulated production well. The simulated wellfield consists of 39 wells, and the layout is shown in Figure 12.17. The operational constraints for this procedure were as follows:
| · | To achieve a target project production rate of at least 40,000 tpa LCE, after processing losses are considered; |
| · | To maintain a minimum average lithium grade of 540 mg/L, in produced brine during the production period; |
| · | To limit total brine production to the maximum concessioned volume; |
| · | To distribute brine production in a relatively uniform manner among the 39 wells: and |
| · | Not to affect the free water bodies located at north and South of the Salar. |
Lithium Argentina AG., 2026 Cauchari-Olaroz S-K 1300 Technical Report Cauchari-Olaroz Salars, Argentina | Page 297 of 418 |
Figure 12.17 shows the surface drawdown predicted by the model for the year 2060. The figure indicates that pumping from the wells produces local drawdowns of up to 10 meters in the central area of the Olaroz salar. However, the drawdown is confined to the central zone and does not affect the alluvial areas located along the margins of the salar, particularly to the north and south.
Figure 12.14 shows the total LCE mass and brine volume pumped. The figure includes a target line representing the total LCE recovery required at the wellhead to achieve the process production target of 40,000 t LCE. This relationship is based on a processing efficiency of 63%, as provided by EXAR. The model results support the technical feasibility of this production rate over the 40-year production period.
Annual projections are shown in Figure 12.19 and listed in Table 12.5 for wellfield brine production rate, lithium grades, lithium recovered at the wellhead, and LCE produced after processing losses. The modeling results show that during the 35-year simulated pumping period, a component of brine dilution is predicted occur, resulting in grade reduction over time (Figure 12.18). To compensate for the decline, and to maintain consistent recovery of lithium mass, a corresponding increase in brine pumping rate was implemented.
Lithium grades and drawdown results represent composite values which are weighted by the amount of simulated extraction from each model layer, in accordance with the transmissivity of the screened HSUs.
Lithium Argentina AG., 2026 Cauchari-Olaroz S-K 1300 Technical Report Cauchari-Olaroz Salars, Argentina | Page 298 of 418 |
Figure 12.17 Maximum Drawdown Predicted at the Upper Part of the Aquifer for Year 2060
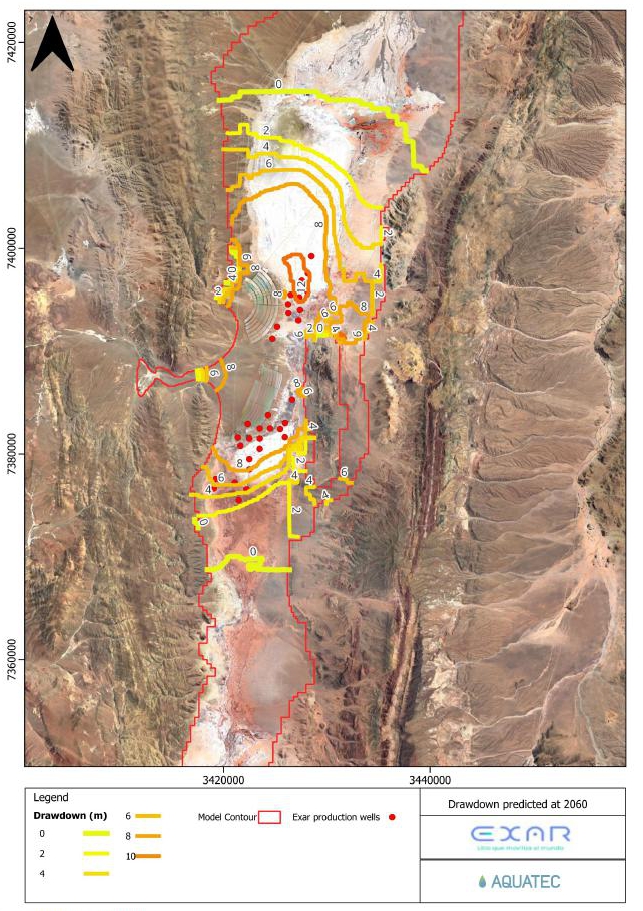
Source: Aquatec (2025)
Lithium Argentina AG., 2026 Cauchari-Olaroz S-K 1300 Technical Report Cauchari-Olaroz Salars, Argentina | Page 299 of 418 |
| Table 12.5 Projected Annual Results from 2026 Mineral Reserve Estimate Model | |||||
| Wellfield Operation Year |
Total (L/s) |
Lithium | LCE | ||
| Average Wellfield Concentration (mg/l) |
Total Wellfield (tonnes) |
Total (t) |
Total (t) | ||
| 2026 | 652.9 | 590.4 | 12,015 | 63,956 | 40,292 |
| 2027 | 652.9 | 591.7 | 11,990 | 63,824 | 40,209 |
| 2028 | 652.9 | 590.8 | 11,996 | 63,856 | 40,229 |
| 2029 | 652.7 | 589.9 | 11,933 | 63,520 | 40,018 |
| 2030 | 653.0 | 589.0 | 11,912 | 63,405 | 39,945 |
| 2031 | 655.0 | 588.0 | 11,921 | 63,455 | 39,977 |
| 2032 | 656.5 | 587.1 | 11,953 | 63,623 | 40,083 |
| 2033 | 657.9 | 586.2 | 11,918 | 63,439 | 39,967 |
| 2034 | 661.2 | 585.3 | 11,948 | 63,600 | 40,068 |
| 2035 | 663.2 | 584.4 | 11,957 | 63,648 | 40,098 |
| 2036 | 664.8 | 583.4 | 11,989 | 63,815 | 40,204 |
| 2037 | 666.4 | 582.5 | 11,956 | 63,643 | 40,095 |
| 2038 | 669.9 | 581.6 | 11,990 | 63,820 | 40,207 |
| 2039 | 672.3 | 580.7 | 12,001 | 63,879 | 40,244 |
| 2040 | 674.0 | 579.7 | 12,033 | 64,051 | 40,352 |
| 2041 | 675.7 | 578.8 | 11,999 | 63,870 | 40,238 |
| 2042 | 679.2 | 577.9 | 12,029 | 64,030 | 40,339 |
| 2043 | 681.5 | 576.8 | 12,037 | 64,071 | 40,365 |
| 2044 | 683.3 | 575.9 | 12,067 | 64,233 | 40,467 |
| 2045 | 685.1 | 575.0 | 12,032 | 64,046 | 40,349 |
| 2046 | 688.8 | 573.9 | 12,063 | 64,210 | 40,452 |
| 2047 | 691.3 | 573.0 | 12,073 | 64,263 | 40,485 |
| 2048 | 693.3 | 572.1 | 12,106 | 64,439 | 40,597 |
| 2049 | 695.3 | 571.1 | 12,074 | 64,270 | 40,490 |
| 2050 | 699.2 | 570.2 | 12,108 | 64,452 | 40,605 |
| 2051 | 701.8 | 569.3 | 12,120 | 64,516 | 40,645 |
| 2052 | 703.8 | 568.4 | 12,154 | 64,698 | 40,760 |
| 2053 | 705.8 | 567.5 | 12,122 | 64,524 | 40,650 |
| 2054 | 709.8 | 566.5 | 12,155 | 64,700 | 40,761 |
| 2055 | 712.5 | 565.6 | 12,166 | 64,758 | 40,798 |
| 2056 | 714.5 | 564.7 | 12,199 | 64,936 | 40,909 |
| 2057 | 716.6 | 563.7 | 12,166 | 64,758 | 40,798 |
| 2058 | 720.6 | 562.8 | 12,200 | 64,942 | 40,914 |
| 2059 | 723.4 | 562.0 | 12,215 | 65,023 | 40,964 |
Lithium Argentina AG., 2026 Cauchari-Olaroz S-K 1300 Technical Report Cauchari-Olaroz Salars, Argentina | Page 300 of 418 |
| Table 12.5 Projected Annual Results from 2026 Mineral Reserve Estimate Model | |||||
| Wellfield Operation Year |
Total (L/s) |
Lithium | LCE | ||
| Average Wellfield Concentration (mg/l) |
Total Wellfield (tonnes) |
Total (t) |
Total (t) | ||
| 2060 | 725.5 | 561.3 | 12,259 | 65,253 | 41,109 |
| Average | 680.7 | 577.7 | 12041.8 | 64098.5 | 40,419 |
Figure 12.18 Temporal Evolution of the Averaged Lithium Concentration Extracted from the Wellfield
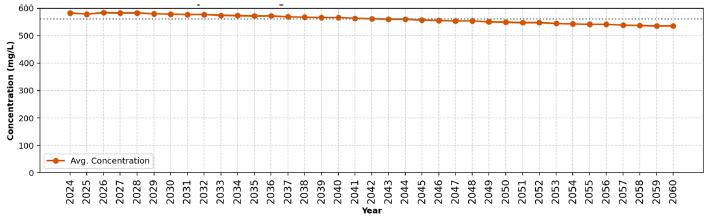
Source: Aquatec (2025)
Figure 12.19 Annual Total LCE Production from the Wellfield
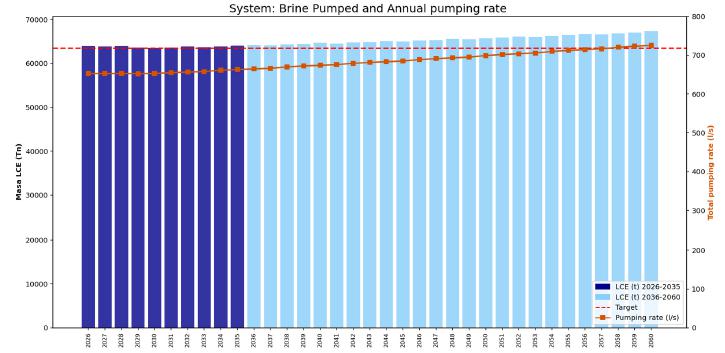
Source: Aquatec (2025)
Lithium Argentina AG., 2026 Cauchari-Olaroz S-K 1300 Technical Report Cauchari-Olaroz Salars, Argentina | Page 301 of 418 |
| 12.11 | Statement for Lithium Mineral Reserve Estimate |
The numerical model was used to estimate lithium production at the wellhead, for the remainder of the 40-year life-of-mine plan (35 years). The Mineral Reserve Estimate is summarized in Table 12.6. It is noted that the 40-year production period started in 2018 and that lithium produced to date is excluded from the Mineral Reserve Estimate. In other words, the Mineral Reserve Estimate only includes lithium that will be produced from the Effective Date of the Estimate (January 1, 2026) to the end of the production period (2060; a period of 25 years) The Mineral Reserve Estimate is inclusive of the reported Mineral Resource Estimate (Table 12.6).
| Table 12.6 Summary of 2026 Mineral Reserve Estimate (1-14) | ||||||
|
Mineral Reserve Classification |
Production Period (Years) |
Brine Pumped (m3) |
Average Concentration (mg/L) |
Lithium (t) |
LCE (t) |
LCE LAR’s (t) |
| Proven |
2026 – 2035 (0 to 10 yr) |
227,782,565 | 588.26 | 75,315 | 400,886 | 179,597 |
| Probable |
2036 – 2060 (11 to 35) |
526,320,091 | 572.18 | 190,463 | 1,013,796 | 454,181 |
| Total | 35 years | 754,102,655 | 580 | 265,779 | 1,414,682 | 633,778 |
| Notes: |
| 1. | S-K 1300 definitions were followed for Mineral Resources and Mineral Reserves. | |
| 2. | The Mineral Reserve Estimate has an effective date of December 31, 2025. | |
| 3. | Reserves are estimated using 63.0 % of process efficiency | |
| 4. | Lithium carbonate equivalent (“LCE”) is calculated using mass of LCE = 5.322785 multiplied by the mass of Lithium Metal. | |
| 5. | The values in the columns for “Lithium Metal” and “LCE” above are expressed as total contained metals. | |
| 6. | The Production Period is inclusive of the start of Year 0, 2026. | |
| 7. | The average lithium concentration is weighted by per well simulated extraction rates. | |
| 8. | Values may not sum exactly, due to rounding of numbers and the differences caused by use of averaging methods. | |
| 9. | The commodity price of $18,000 / tonne for lithium carbonate (2025) for the life of the project was used to assess the economic viability for the mineral estimates, as described below . | |
| 10. | A lithium grade cutoff of 300 mg/L is used to define the Mineral Reserve Estimate. | |
| 11. | The independent Qualified Person for the 2026 Mineral Resource Estimate is Mark King, PhD. PGeo, FGC. | |
| 12. | The estimate of Mineral Reserves may be materially affected by legal, political, environmental, or other risks. | |
| 13. | The point of reference is brine pumped from the wellfield to the evaporation ponds. |
The Measured and Indicated Mineral Resources (Section 11.4) correspond to the total amount of lithium-enriched brine estimated to be available within the aquifer while the Proven and Probable Mineral Reserves represent a portion of the Mineral Resource Estimate that can be extracted under the proposed pumping schedule and wellfield configuration. Therefore, the Mineral Reserve Estimate is not “in addition” to the Mineral Resource Estimate Rather, it represents a portion of the total Mineral Resource that is extracted during the life of mine plan.
Lithium Argentina AG., 2026 Cauchari-Olaroz S-K 1300 Technical Report Cauchari-Olaroz Salars, Argentina | Page 302 of 418 |
The authors consider that the Mineral Reserve Estimate has been conservatively modeled and represents the following, relative to the Effective Date of the Estimate (January 1, 2026):
| · | A Proven Mineral Reserve for Year 1 through 10; and |
| · | A Probable Mineral Reserve for Years 11 to 35 (end of life of mine plan). |
The division between Proven and Probable Mineral Reserves is based on:
| 1. | sufficiently short duration of wellfield extraction to allow a higher degree of predictive confidence, yet long enough to enable significant production, and |
| 2. | a duration long enough to enable accumulation of a strong data record to allow subsequent conversion of Probable Mineral Reserves to Proven Mineral Reserves. |
The following is noted, with regard to this Mineral Reserve Estimate:
| · | The Mineral Reserve Estimate is expressed as mineral recovered at the wellhead. |
| · | A processing efficiency of 63 % is reported by EXAR, see 14.6 Plant Design basis for further details. |
| · | The average production rate (from the Process) is 40,419 tpa LCE for the 35-year period. |
| · | The pumping rate has been adjusted to achieve constant production during the 35-year life of the mine. |
| · | Average lithium concentration of 580 mg/L is predicted for the 35-year pumping period. |
| · | A maximum average concentration of 590.4 mg/L is predicted to occur at the start-up of full-build in Year 2026. |
| · | A minimum average concentration of 561.3 mg/L is predicted to occur at the end of the pumping period, in Year 2060. |
| · | A lithium cut-off concentration grade of 300 mg/L was conservatively applied for the 2019 Mineral Resource and Mineral Reserve Estimate. For comparison of the utilized cut-off grade to a breakeven cut-off grade calculation, the following analytical formula can be used based on the controlling inputs as quantified for LOM: |
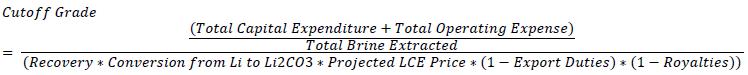
Where:
Total Capital Expenditure= US$ 1,781 million
Total Operating Expenditure = US$ 6,020 million
Cost of Capital = US$ 178 million (10 percent of Total Capital)
Total Brine Extracted = 628 Mm3
Conversion from Li to Li2CO3 (LCE) = 5.323
Projected LCE Price = US$ 20,000 per metric ton of LCE
Export Duties =4.5%
Royalties= 3.0%
Calculated Recovery= 65 %.
Resulting in a calculated breakeven cut-off grade of approximately 200 mg/L.
Lithium Argentina AG., 2026 Cauchari-Olaroz S-K 1300 Technical Report Cauchari-Olaroz Salars, Argentina | Page 303 of 418 |
| 12.12 | Reasons for Differences from Previous Estimate (Burga, 2025) |
The differences between 2019 and 2026 Mineral Reserves Estimations are summarized below and presented in Table 12.7. The main differences between previous and current Reserve Estimates are attributed to the following:
| · | Production Basis and Expansion Framework |
| o | The 2026 Mineral Reserves Estimate is based on a target production rate of 40,000 tpa of LCE for Stage 1 operations. The current Estimate intentionally evaluates Mineral Reserves sufficient to support this base production rate, while preserving additional extraction capacity for a potential Stage 2 expansion in the future which could include Cauchari South and a total production of approximately 80,000 tpa LCE. |
| o | In contrast, the 2019 Reserves Estimate, considered a maximum production of 48,800 tpa LCE over a 40-year operating period, based on a larger wellfield and production capacity beyond Stage 1. |
| · | Mine Life and Treatment of Historical Production |
| o | The 2026 Mineral Reserves Estimate considers a 35-year period, from January 1, 2026 through December 31, 2060. The Estimate is forward-looking and excludes historical production from year 2018 to 2025 of 280,978 t LCE which includes the current brine inventory. |
| o | No material change to previous 40-year project life from 2019 Reserve Estimate after adjusting for brine production from 2018-2025 and 2026 Mineral Reserves Estimate of 35-year period from January 1, 2026 to December 31, 2060. |
| o | Despite the exclusion of historical production, modeled lithium at the end of the reserve life remains robust and drawdowns in both salars are not significant, leaving room for an extension of project life or future Stage 2 expansion. |
| · | Process Recovery Assumptions |
| o | The 2026 Mineral Reserves Estimate uses an updated process recovery assumption of 63.0%, reflecting demonstrated operating performance, while the 2019 Mineral Reserve Estimate applied a theoretical process efficiency of 53.7 %. |
Lithium Argentina AG., 2026 Cauchari-Olaroz S-K 1300 Technical Report Cauchari-Olaroz Salars, Argentina | Page 304 of 418 |
| · | Proven Mineral Reserves |
| o | The 2026 Proven Mineral Reserve Estimate represents the first 10 years of production, supported by production history and updated resource modeling, increasing certainty compared to the 2019 Reserves Estimates. As a result, Proven Mineral Reserves have increased by 45% in 2026 relative to the 2019 estimations. |
| · | Probable Mineral Reserves |
| o | The 2026 Probable Mineral Reserve Estimates are reduced by 40%, relative to the 2019 estimate. This decrease is caused by changes in classification methodology and production assumptions, rather than a deterioration in resource quality. Key factors include: |
| § | Five years of production previously classified at Probable being reclassified as Proven, supported by operational data. |
| § | Production from 2018 to end of 2025 is not considered in the 2019 Mineral Reserve Estimate. |
| · | Wellfield Development Assumptions |
| o | In the 2019 Mineral Reserve Estimate, the wellfield output involved 56 wells to produce 48,800 tpa LCE, which was considered the wellfield limit. The 2026 Mineral Reserve estimation considers 39 production wells (currently active) drilled to prove sufficient brine for Stage 1 production rates. |
| Table 12.7 Comparison of Mineral Reserve Estimates - Current and Previous (Burga et al. 2025) | |||||
|
Stage 1 Reserve Classification |
Mineral Reserves Estimates LCE (t) | Tonnes | Difference | ||
|
Previous Burga (et al.2025) |
Current (Effective Date |
% | |||
| Proven | 276,250 (5 y) | 400,886 (10 y) | 124,636 | 45% | |
| Probable | 1,675,770 (35 y) | 1,013,796 (25 y) | -661,974 | -40% | |
|
Total Proven & Probable |
1,952,020 (40 y) | 1,414,682 (35 y) | -537,338 | -28% | |
| Process efficiency | 53.7% | 63% | - | 9.3% | |
| Tonnes per year | 48,800 | 40,419 | -8,381 | -17% | |
| Years | 40 | 35 | 5 | ||
| No. of wells | 56 | 39 | 14 | ||
| 12.13 | Relative Accuracy in Mineral Reserve Estimate |
The relative accuracy and confidence in the Mineral Reserve Estimate is a function of the accuracy and confidence demonstrated in sampling and analytical methods, development and understanding of the conceptual hydrogeologic system, and construction and calibration of the numerical groundwater flow model. As has been demonstrated in this report and in previous technical reporting by LAR (2012, 2017, and 2019), input data and analytical results via sample duplication, the use of multiple methods to determine brine grade, and to obtain aquifer parameters from pumping tests have been verified and used as a basis for the Mineral Reserve Estimate model. The current evaluation has benefitted significantly from the accumulated and lengthening period of proven production.
Lithium Argentina AG., 2026 Cauchari-Olaroz S-K 1300 Technical Report Cauchari-Olaroz Salars, Argentina | Page 305 of 418 |
Using standard methods, a conceptual geological and hydrogeologic model consistent with the geologic, hydrogeologic, and chemistry data obtained during the field exploration phases of the Project was prepared. The conceptual model was then used to prepare the numerical groundwater flow model. In addition, the calibration of the numerical model iteratively provided support for the conceptual hydrogeologic model. After review and verification of model projections and brine production to date, the authors have a reasonably high level of confidence that the salar system, assuming certain levels of uncertainties and risk described in Section 13.0, can yield the quantities and grade of brine calculated in the current Reserve Estimate.
The Company has advised the QP that it is unaware of any other factors – such as environmental, permitting, legal, title, taxation, socio-economic, marketing, or political factors - that may materially affect this Mineral Reserve Estimate, except as disclosed in this report. For details on relevant environmental and community activities, see Seciton 17.
The current Mineral Reserve Estimate assumes that production from adjacent external property areas will not impact future brine production on the subject properties of this evaluation. However, depending on the location of production wells and the potential overlap of brine aquifer capture areas, this assumption may introduce significant uncertainty. Adjacent external brine production wells could directly affect the current Mineral Reserve Estimate by causing dilution of brine concentrations or lowering brine levels in the aquifer. It is noted that both the transient simulation and the Mineral Reserve Estimation incorporates brine extraction by neighboring operators. Incorporating these external stresses enhances model reliability, allowing more accurate reproduction of historical conditions and more robust predictions.
The dynamic reserve model should be periodically updated to enhance calibration accuracy. It should serve as a decision-support tool to simulate and implement optimal production scenarios.
Lithium Argentina AG., 2026 Cauchari-Olaroz S-K 1300 Technical Report Cauchari-Olaroz Salars, Argentina | Page 306 of 418 |
| 13.0 | Mining Methods |
| 13.1 | Production Wellfield |
A total of 42 wells were used to simulate brine extraction for the Updated Mineral Reserve Estimate. The wells comprising the brine extraction wellfield are spatially distributed in the Resource Evaluation Area of the Project to optimize well performance and capture of brine enriched in lithium (Figure 12.6).
During the first years of ramp up operation, in 2023 and 2025, 39 wells were operative to support LCE production. During 2023, average wellfield extraction was 493 L/s and in 2024, 704 L/s were pumped. Table 13.2 lists the total wellfield delivery rate per year.
Due to uncertainties in the spatial distribution of aquifer hydraulic properties and ultimate well hydraulic efficiencies at constructed production wells, difference may exist between pumping rates applied in the simulation versus measured pumping after construction of wells. In addition, it is likely that wells will need to be rehabilitated or replaced during the 35-year production period and cost estimates should include provisions to cover such expenditures.
| 13.2 | Brine Production Uncertainties, Limitations, and Risk Assessment |
An assessment of key potential sources of uncertainties and limitations in the numerical model predictions and the Mineral Reserve Estimate is provided below. These descriptions are based on an extensive series of model runs for calibration and sensitivity analysis provided in prior LAR reporting for the previous Mineral Reserve Estimate and additional modeling analysis used for the 2025 Mineral Reserve Estimate and subject of this report.
| · | Initial brine concentrations – These are based on relatively extensive sampling programs. The order of uncertainty in the average modeled brine concentration is expected to be ± 6% and is based on differences reported in prior Mineral Resource area models of brine concentration. |
| · | Effective Porosity (φe) and Specific Yield (Sy) – Effective porosity is difficult to measure in the field. Therefore, effective porosity was assumed to be equal to specific yield for modeling purposes. A high degree of variability is noted in the Sy estimates (as based on RBRC results). Since most of extracted brine is derived from elastic rather than pore storage, uncertainties in effective porosity affect the distance that lithium mass in the brine travels to reach a production well. As a result, uncertainties in estimates of specific yield will affect the amount of mass capture produced by the wellfield at boundaries with more dilute concentrations of lithium. To avoid these potential dilution effects and reduce uncertainty, the wellfield is currently configured for maximizing mass capture within the Project property aquifer volumes with largest amounts of lithium mass, and at sufficient distances from more dilute areas near aquifer boundaries. |
| · | Dispersivity – The value of dispersivity, which controls the spreading of dissolved lithium as it is transported with groundwater, is also difficult to determine in field settings given the scale of the model domain. Values were set in the Updated Mineral Reserve model to be generally consistent with the previous modeling effort (King, Kelley, Abbey, 2012) and professional literature estimates for controlled testing (Gelhar et al., 1992 and Hess et al., 2002), and the amount of spreading parallel to groundwater flow (horizontal dispersivity) is reasonably assumed to be greater than the transverse and vertical components. Sensitivity runs with varied dispersivity values will aid in better evaluating its effect on the simulated results. |
Lithium Argentina AG., 2026 Cauchari-Olaroz S-K 1300 Technical Report Cauchari-Olaroz Salars, Argentina | Page 307 of 418 |
| · | Stratigraphic assumptions – Stratigraphic variability is inherent in any depositional environment. The updated HSU model is based on the available data and interpretation of depositional processes. Additional refinements using model zonation of aquifer parameters were made based on well responses to the pumping tests, to refine the continuity of aquifer and aquitard units between wells. |
| · | Hydraulic conductivity (K) – The K distribution field is directly correlated with HSU model and, given the large range in lithologic heterogeneity of the HSUs, values of K have a broad range as well as associated uncertainty. Similar to stratigraphic uncertainty, the magnitude of the uncertainty for K estimates primarily affects the number of required pumping wells, rather than the total Mineral Reserve Estimate. If K values are smaller than represented in some areas of the model, it ultimately would require closer well spacing which can be addressed by the addition of contingency wells. |
| · | Water balance – The water balance is defined as the entry of water into the salar, either laterally or vertically (recharge), and water exiting the model primarily via evaporation (discharge). Given the conceptual model of the basin, recharge at mountain fronts and basin margins essentially controls influx and thereby dictates evaporative discharge flux. The amount of recharge into the model domain has the potential to affect the required number of pumping wells and steady-state residual mean, where for example, a lower recharge estimate to the salar could improve the apparent spatial bias of negative residuals (Table 12.3). Sensitivity analyses shows if actual recharge is significantly less than represented in the model, then the amount of drawdown and dilution associated with a given pumping rate will tend to be greater over long pumping periods. Consequently, more production wells would be required to spread out the effects of brine extraction and promote less drawdown and dilution at individual pumping wells. This is addressed by the addition of contingency wells. |
| · | Water density – In most salar settings, variations in the density of groundwater are an important driver for flow, especially in the marginal mixing zone. Similar to the previous modeling efforts, a constant density of groundwater was assumed in this Updated Mineral Reserve model. Although the extensive numerical modeling analysis of LAR (2012) indicated that the consideration of variations in groundwater density did not significantly impact the simulated results of that model, the extended domain of this Updated Mineral Reserve model includes the marginal salar areas and freshwater zones of the basin. Therefore, in future modeling updates, and with additional measurements of groundwater density, consideration of variable-density flow and transport is recommended with modeling code and interface utilized (MODFLOW-USG with Groundwater Vistas). In addition, the steady-state calibration may be improved if the observed groundwater values were corrected for water density; in this case, the equivalent freshwater head would be higher than the respective observed field groundwater elevation (Table 12.3), resulting in an increased residual mean and possible improvement of the spatial bias of over predicted model values. This improvement would also be subject to more field measurements of water density in order to properly convert the observed groundwater elevations to equivalent freshwater heads. |
Lithium Argentina AG., 2026 Cauchari-Olaroz S-K 1300 Technical Report Cauchari-Olaroz Salars, Argentina | Page 308 of 418 |
| 13.3 | Well Utilization |
For the 2025 Mineral Reserve Estimate, it was assumed that 39 wells would be needed to meet or exceed the production goal targets. From 2018 to 2024, prior to initiation of full-scale operations, a total of 39 brine extraction wells were constructed. Storage ponds and the recovery plant were also assumed to be fully operational at the start of the simulation.
Variations in brine demand due to differences in brine-pond evaporation rates, either seasonal or due to long-term climatic trends, were not incorporated directly into the simulations. Incorporation of brine pumping variations can be conducted as part of model predictive scenarios for operational controls. In practice, however, pumping at selected wells could be stopped and started as necessary to meet total wellfield requirements.
| 13.3.1 | Well Utilization 2018 to 2025 |
From 2018 to 2025, a total of 39 producing wells have been progressively commissioned in the current exploitation area of the Mineral Resource (Cauchari-Olaroz), which sustained the ramp-up operation during those years.
From 2018 to the present, the number of wells in production has increased, as has the volume of brine extracted and the efficiency in the concentration of lithium. In 2018, production began with the pumping of 5 wells located in the Cauchari Salar. During 2019, 8 wells were incorporated into the production, considerably increasing the volume of brine extracted compared to the previous year. By 2020, the number of wells in production doubled, with a total of 24 wells in production, distributed in the Cauchari-Olaroz Salar. During 2021, 1 well was incorporated into production, this and the improvements in the efficiency of the wells meant an increase of almost 70% in brine production compared to the previous year. From 2022 to 2024, brine pumping and production reached a total of 39 wells.
Currently, three (3) new infill producing wells are being built in the Salar de Olaroz in order to increase the versatility and productive capacity of the pumping field. Their location information is presented in Table 13.1.
Table 13.2 summarizes the volume of brine pumped per well, as well as the average flows per year. Figure 13.1 shows graphically the volume of exploitation per well. Figure 13.2 shows the location of the production wells and Figure 13.3 shows the location of the production wells against the area of the 2019 Mineral Resource Estimate.
| Table 13.1 Borehole Drilling Summary for Infill Producing Wells Program Conducted in 2024 | |||||||
| Borehole ID |
Type | Platform | Contractor | Stage | Location | Coordinates | |
| X | Y | ||||||
| Pozo 44 | Rotary | W-30 | Wichi Toledo | Under construction | Olaroz | 3425552 | 7393300 |
| Pozo 45 (Note 1) | Rotary | W-28 | Wichi Toledo | Under construction | Olaroz | 3425189 | 7392374 |
| Pozo 46 | Rotary | W-29 | Wichi Toledo | Under construction | Olaroz | 3424736 | 7391203 |
Note 1: W-28 construction not finished.
Lithium Argentina AG., 2026 Cauchari-Olaroz S-K 1300 Technical Report Cauchari-Olaroz Salars, Argentina | Page 309 of 418 |
Table
13.2
Volume Pumped per Production Well per Year and Average Flow per Year - Cauchari-Olaroz
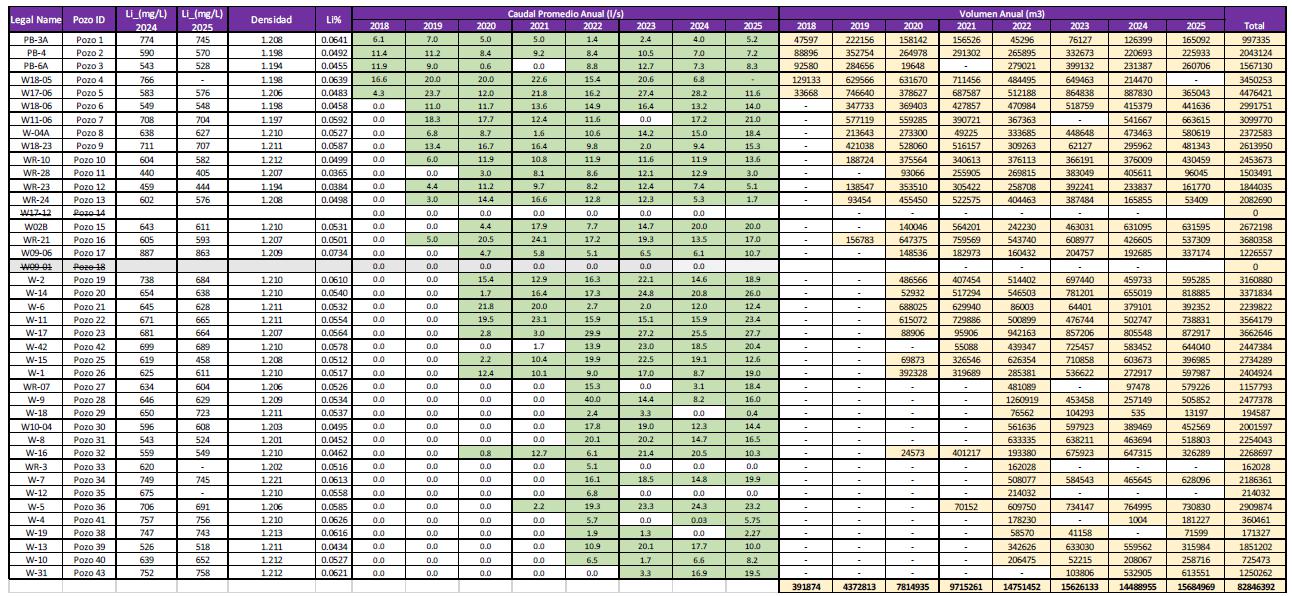
Note: The volumes shown here include all feed to the system as well as the volumes used for pond leak detection and pumping tests.
Source: (Exar 2025)
Lithium Argentina AG., 2026 Cauchari-Olaroz S-K 1300 Technical Report Cauchari-Olaroz Salars, Argentina | Page 310 of 418 |
Figure 13.1 Production Wells – Pumped Volumes per Well per Year
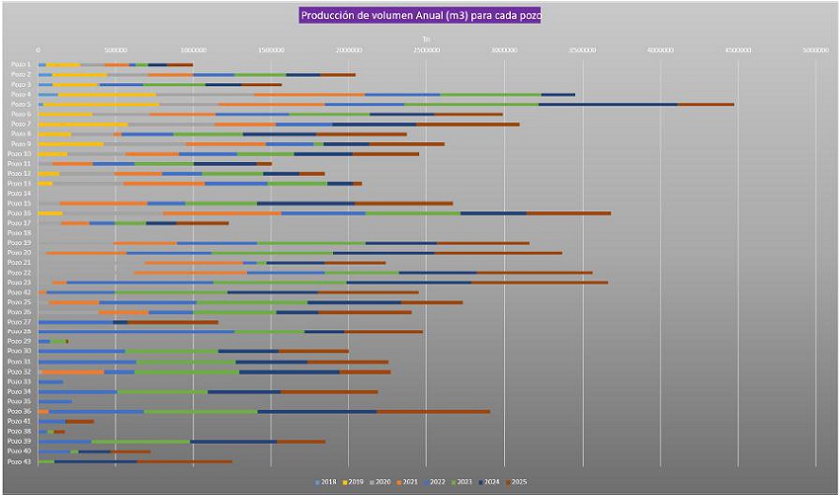
Source: (Exar 2025)
Lithium Argentina AG., 2026 Cauchari-Olaroz S-K 1300 Technical Report Cauchari-Olaroz Salars, Argentina | Page 311 of 418 |
Figure 13.2 Location of Production Wells
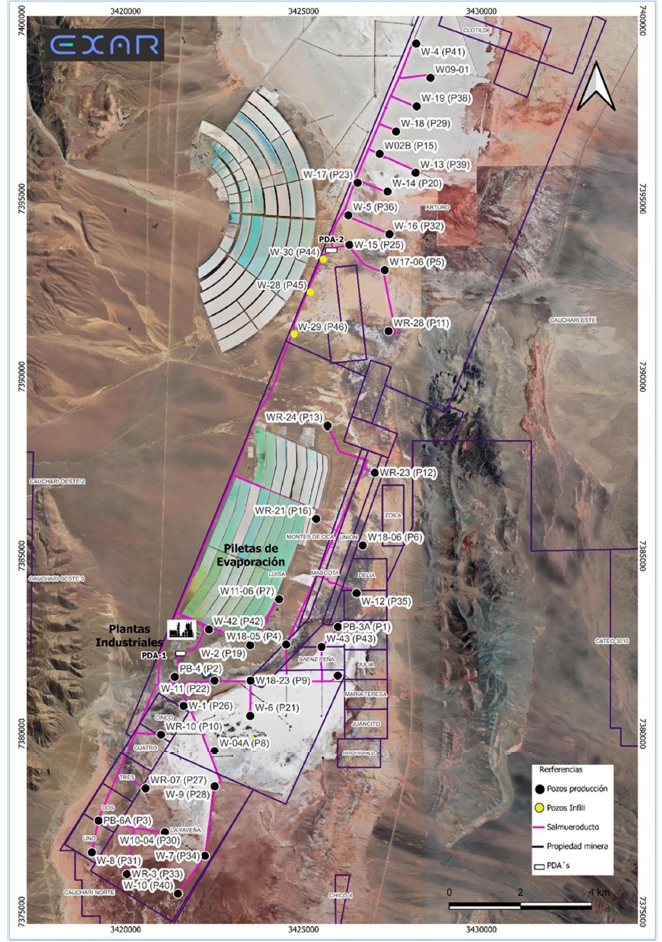
Source: (Exar, 2024)
Lithium Argentina AG., 2026 Cauchari-Olaroz S-K 1300 Technical Report Cauchari-Olaroz Salars, Argentina | Page 312 of 418 |
Figure 13.3 Location of Production Wells Showing 2019 Mineral Resource Area
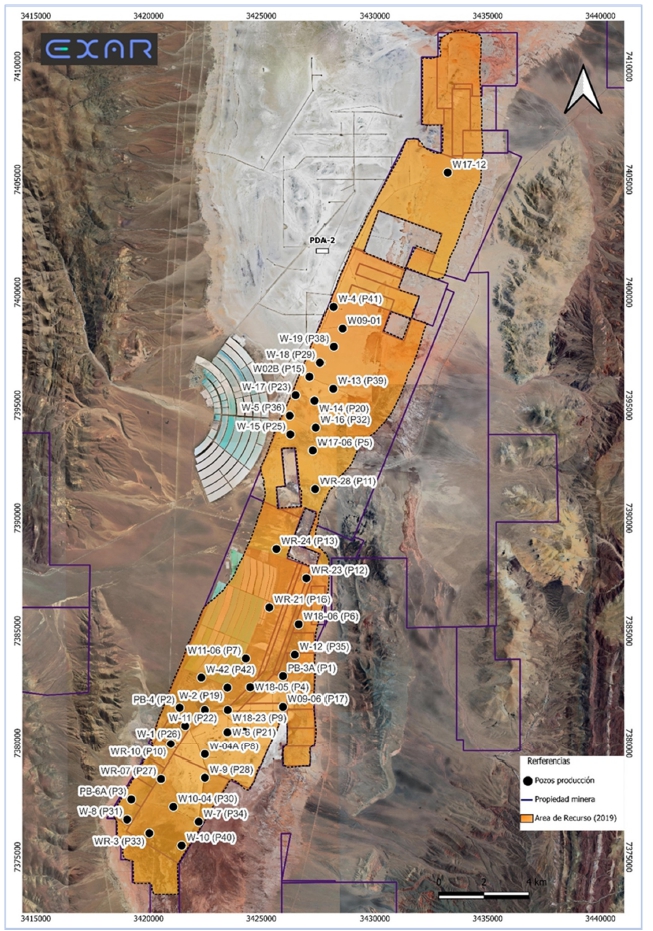
Source: (Exar, 2024)
Lithium Argentina AG., 2026 Cauchari-Olaroz S-K 1300 Technical Report Cauchari-Olaroz Salars, Argentina | Page 313 of 418 |
| 14.0 | Processing and Recovery Methods (Brine Processing) |
| 14.1 | General |
The lithium recovery process consists of the following main processing stages:
| · | Brine production from wells. | |
| · | Sequential solar evaporation. | |
| · | Liming for Impurity Reduction. | |
| · | Lithium plant including: |
| o | Boron removal; | |
| o | Purification process; | |
| o | Forced Evaporation process; | |
| o | Polishing; | |
| o | Carbonation/Lithium carbonate precipitation; | |
| o | Lithium carbonate drying and transportation; and | |
| o | Lithium carbonate packaging. |
The current process design, based on testing and simulation, has been enhanced with:
| · | Sulphate and boron reduction. | |
| · | Plant-Based potassium chloride reduction. |
Mass and energy balance simulations were developed for estimation of operating and equipment costs. A conservative approach was used to design the ponds and plant infrastructure to ensure product purity and delivery commitments.
| 14.2 | Process Description |
| 14.2.1 | Process Block Diagram |
Figure 14.1 shows the process diagram that outlines the general process. The brine is pumped from the salar into the pond system on the left side. As it progresses through the ponds, different salts precipitate, and chemical treatments are applied. The concentrated brine leaves the pond system on the right side then enters on the top left of the Lithium Carbonate Plant Simplified Block flow diagram.
Lithium Argentina AG., 2026 Cauchari-Olaroz S-K 1300 Technical Report Cauchari-Olaroz Salars, Argentina | Page 314 of 418 |
Figure 14.1 Process Block Diagram
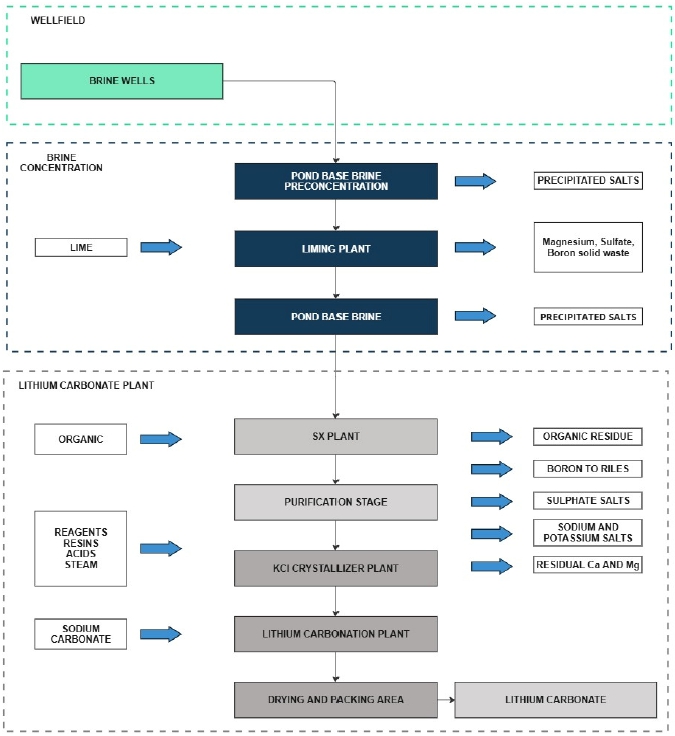
Source: (Exar, January 2026)
| 14.3 | Brine Concentration Process Description |
| 14.3.1 | Pond Surface Area |
Exar has designed, configured and planned the operation of the pond system based on test work at the site and multiple laboratory tests.
Lithium Argentina AG., 2026 Cauchari-Olaroz S-K 1300 Technical Report Cauchari-Olaroz Salars, Argentina | Page 315 of 418 |
A water evaporation rate of 6.26 mm/day (average rate between summer and winter) was used as the design criteria for the pond system, which was obtained using Class A evaporation pans and the test results discussed in Section 10.2.2. In addition, 5% of the available evaporation time the pond will be available for harvesting as an optimization of the process (process design considered 10% of the available evaporation time). A seasonal model of the ponds has been used to obtain the net annual productivity including variation in rain fall, evaporation rates, and brine chemistry changes due to temperature. All these variables are estimated based on site-specific statistics.
Using the above-mentioned rate, a total pond surface area of 1,200 Ha is required to produce 40,000 tpa of lithium carbonate. The operation strategy considers daily evaporation control adjustments by adjusting surface area requirements as necessary during operations through monitoring weekly pond mass balances and long-term prediction based on historic evaporation and meteorological data.
The pond system consists of 28 evaporation ponds.The ponds configuration includes two parallel trains as presented in Figure 14.5. Associated piping allows for flexible operation and bypassing of individual ponds for maintenance activities.
The evaporation ponds produce salt tailings composed of Na, Ca, K, sulphate and borate salts. The brine concentrate from the terminal evaporation pond is further processed, through a series of polishing and impurity removal steps.
| 14.3.2 | Pond Design |
The pond design consists of engineered fill material and a thick impermeable pond liner (geomembrane) with geotextile only on berms. The use of both engineered fill material and a liner reduces the potential of rocks penetrating the liner and compromising pond impermeability. The engineered fill material consists of screened sands and fines which are installed on the native material in the pond area below the liner then leveled and compacted.
Testing of this design using pond liners from several different suppliers and installation details was completed to reach the final decisions on the liner and construction approaches. A total of 10 pond cells (approx. 40 m x 40 m) were constructed on site and installed with the proposed design. Production and salt harvesting were then simulated, and the liners were then tested for damage/leakage using inspection and mass balances on the test ponds.
Figure 14.2 illustrates the evaporation ponds constructed upon the engineered bedding that was overlain with a geotextile and liner.
Lithium Argentina AG., 2026 Cauchari-Olaroz S-K 1300 Technical Report Cauchari-Olaroz Salars, Argentina | Page 316 of 418 |
Figure 14.2 Evaporation Ponds at Cauchari Salar
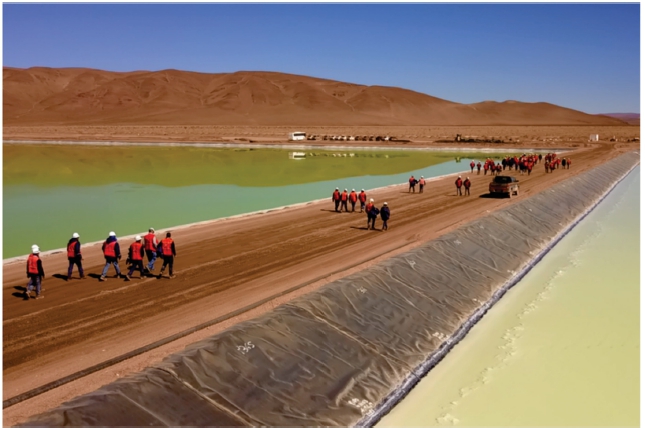
Source: Burga et al. (2020)
The pond berms were constructed using compacted, impermeable clay-rich soils and overlain with the engineered materials described above. Testing of the berm construction material, sourced locally in the Olaroz salar, has confirmed the design specifications (Figure 14.3). Evaporation ponds are shown in Figure 14.4.
Lithium Argentina AG., 2026 Cauchari-Olaroz S-K 1300 Technical Report Cauchari-Olaroz Salars, Argentina | Page 317 of 418 |
Figure 14.3 Testing of Berm Material
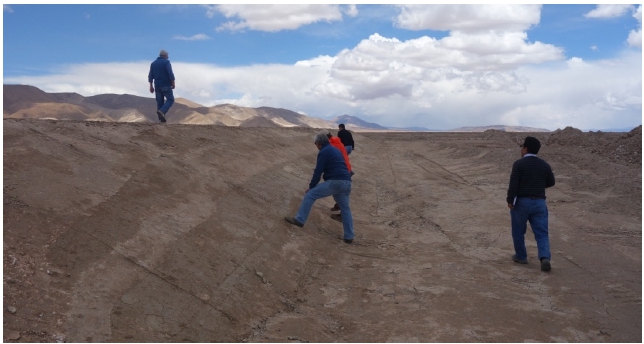
Source: Burga et al. (2020)
Figure 14.4 Evaporation Ponds – Close Up
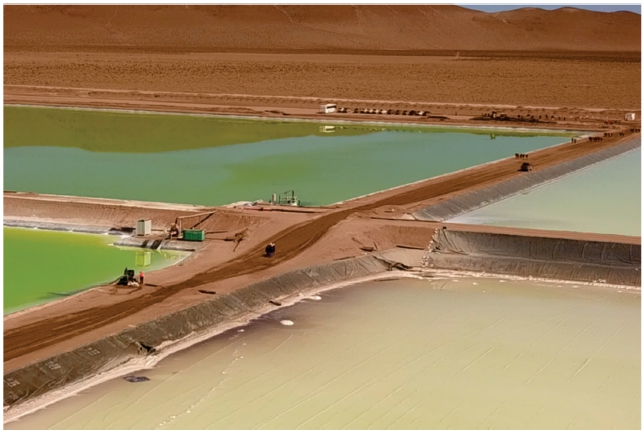
Source: Burga et al. (2020)
Lithium Argentina AG., 2026 Cauchari-Olaroz S-K 1300 Technical Report Cauchari-Olaroz Salars, Argentina | Page 318 of 418 |
| 14.3.3 | Pond Layout |
Figure 14.5 presents the outline of the ponds and the salt disposal area.
Figure 14.5 Evaporation Ponds
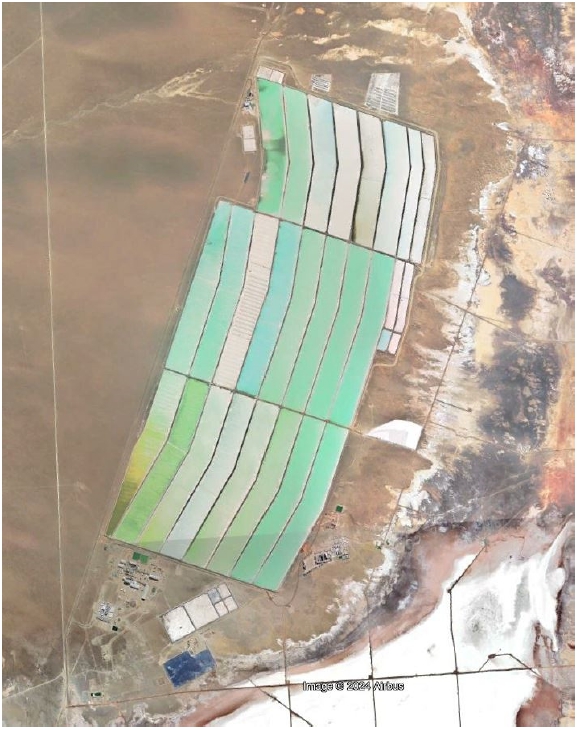
Source: (Google Earth, 2024)
| 14.3.4 | Pond Transfer System |
Each pond is equipped with a pump station and pipeline system for transferring brine between ponds (Figure 14.6). The ponds are arranged geometrically to efficiently move brine during the anticipated normal operation and maintenance of the ponds and pump systems. An analysis of the prevailing wind direction was considered in pond orientation, pump station locations, and brine inlets.
Lithium Argentina AG., 2026 Cauchari-Olaroz S-K 1300 Technical Report Cauchari-Olaroz Salars, Argentina | Page 319 of 418 |
Brine progresses along the long axis of the pond. Internal, temporary walls constructed of salt ensure the brine does not bypass the pond section and has a consistent residence time.
Figure 14.6 Evaporation Ponds – Transfer Pump Station
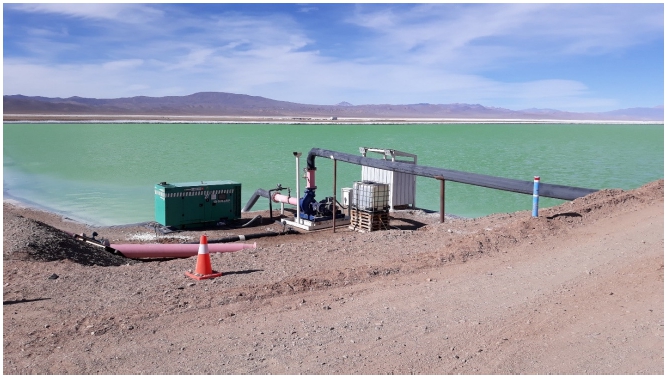
Source: Burga et al. (2020)
| 14.3.5 | Salt Harvesting |
As brine concentrates, the salt precipitates in the pond thus purifying the brine. Salt that precipitates in the bottom of ponds is porous and entraps brine. In order to recover pond volume taken up by precipitated salt and recover lithium values entrapped with the brine; salt will be harvested. Harvesting began after the third year of ponds operation.
The harvesting operation consists of draining the free brine from the pond, scraping the salt to a minimum depth, and making drainage trenches before removing salt. Draining the entrapped brine from the salt will recover roughly 90% of the lithium that was entrapped in the salt. Harvesting is being conducted 24/7 to satisfy overall production plans.
| 14.3.6 | Impurity Reduction-Liming |
A liming stage is necessary to avoid the precipitation of lithium compounds by removing some of the sulphate. In the liming system almost all of the Mg is precipitated with a portion of the sulphates and boron compounds.
The only reagent used in this area is quick lime (CaO) which is stored in two silos of 1,000-tonne capacity each. A milk of lime preparation system includes the vertimill lime slaker to prepare the reagent for the process.
Lithium Argentina AG., 2026 Cauchari-Olaroz S-K 1300 Technical Report Cauchari-Olaroz Salars, Argentina | Page 320 of 418 |
Milk of lime and brine from the pre-concentration ponds are contacted in two separate trains of reactors. These reactors produce a slurry of sulphates, magnesium hydroxides and borates that can be easily separated from the brine and washed to recover the lithium.
The reactions that take place precipitate magnesium hydroxide, gypsum and calcium borates. The reactions give the following products:
(Mg)+2 + Ca(OH)2,(s) → Mg(OH)2,(s) + Ca+2
Ca+2 + SO4-2 → CaSO4,(s)
2Ca+2 + 3B2O4 → Ca2B6O11·5H2O(s)
The brine with precipitated solids is discharged from the reaction tank to a solid liquid separation system. The treated brine stream goes to the post-concentration ponds for further concentration, whereas the solids are transferred to a disposal area.
| 14.4 | Lithium Plant Process Description |
Pre-treated and concentrated brine from the evaporation ponds is fed into the lithium plant.
The plant is composed of the following processing sections:
| · | SX circuit for boron removal. |
| · | Purification circuit: In this circuit, impurities such as magnesium, calcium, and sulphates are removed from the brine using specific reagents. |
| · | Forced Evaporation and KCl Crystallizer circuit. |
| · | Carbonation circuit to precipitate high-grade Lithium carbonate. |
| · | Drying and packing area. |
The block diagram for the plant is shown in Figure 14.7 Lithium Carbonate Plant Block Diagram.
Lithium Argentina AG., 2026 Cauchari-Olaroz S-K 1300 Technical Report Cauchari-Olaroz Salars, Argentina | Page 321 of 418 |
Figure 14.7 Lithium Plant Block Diagram
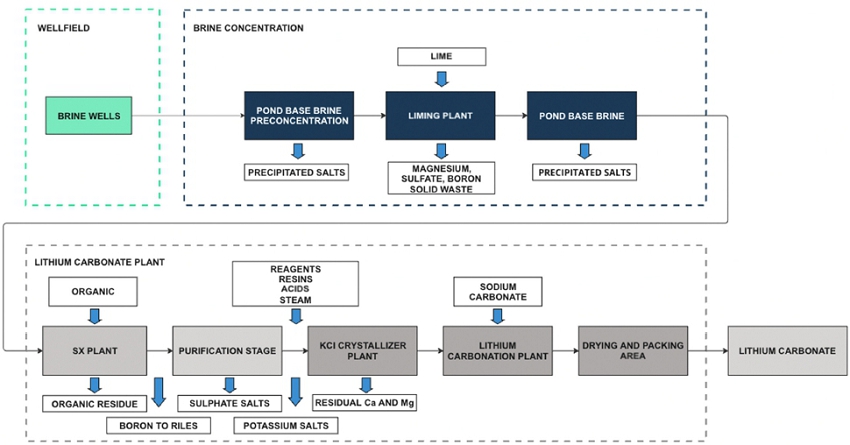
Source: Exar, 2026
Lithium Argentina AG., 2026 Cauchari-Olaroz S-K 1300 Technical Report Cauchari-Olaroz Salars, Argentina | Page 322 of 418 |
| 14.4.1 | Solvent Extraction for Boron Removal |
Boron removal is necessary to achieve high-quality lithium product. The solvent extraction stage allows an effective removal of this element. This step reduces boron concentration to specification values
In the 2012 Feasibility Study, a boron solvent extraction stage was considered to treat the brine and produce an essentially boron-free brine for further processing. Test work provided the basis of design for the solvent extraction plant including six solvent extraction stages and three stripping stages.
The design of the extraction unit is based on pilot testing at the pilot plant located at the Project site, and Tenova have provided a process guarantee.
The main reagents of this process are:
| · | The organic mix used in the extraction is a mix of Escaid 110 and 2-Ethyl-hexanol. |
| · | 32% HCl to control the acidic pH in the extraction stage, acidifying to a pH of 2.5. |
| · | 5% NaOH solution to prepare the aqueous stripping solution and reach a pH of 10 in the stripping stages. |
The boron from the feed is transferred to the organic phase as the liquids mix during the extraction process. The extraction circuit consists of six stages.
Boron removal from the organic phase is carried out using an alkaline caustic solution. The stripping circuit has three stages. The extracted solution containing boron is sent to a disposal tank for the process. The regenerated organic phase is recycled back into the extraction stage.
The solvent extraction plant configuration is shown in Figure 14.8 Boron Solvent Extraction.
Lithium Argentina AG., 2026 Cauchari-Olaroz S-K 1300 Technical Report Cauchari-Olaroz Salars, Argentina | Page 323 of 418 |
Figure 14.8 Boron Solvent Extraction
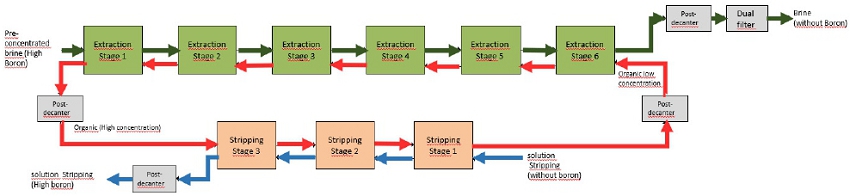
Source: Exar, 2026
Lithium Argentina AG., 2026 Cauchari-Olaroz S-K 1300 Technical Report Cauchari-Olaroz Salars, Argentina | Page 324 of 418 |
| 14.4.2 | Purification Process |
The rest of the impurities, magnesium, calcium, and sulphates are removed from the brine in the purification process.
The purification process consists of the following steps:
| · | Primary purification: main objective is magnesium and sulphates removal. |
| · | Secondary purification: main objective is calcium and sulphates removal. |
| · | Primary IX: main objective is the removal of any residual calcium, magnesium and other divalent ions. |
Purification is done in two stages using Ca(OH)2, Na2CO3, CaCl2 and BaCl2 as reagents that are effective for the precipitation of calcium, magnesium, sulphate.
The circuit includes the solid/liquid separation stages, and the ion exchange sequences for the overall removal of traces of divalent ions (calcium and magnesium mainly but also strontium and barium).
The process stages included in the purification circuit area outlined in the Figure 14.9 Brine Purification Circuit Diagram.
Figure 14.9 Brine Purification Processing Circuit Diagram
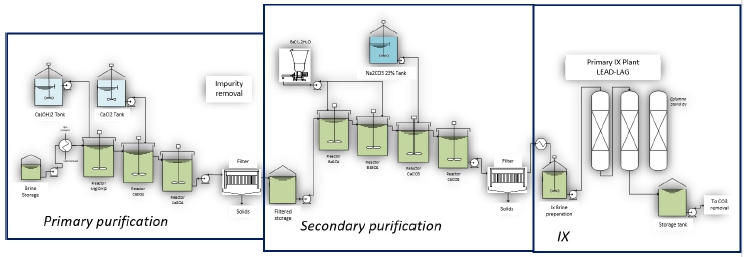
Source: Exar, 2026
| 14.4.2.1 | Primary Purification – Magnesium and Sulphate Reduction |
Magnesium must be removed before the carbonation step. This is accomplished by adding lime in a set of reactors. The lime reacts with the magnesium in the brine to form insoluble magnesium hydroxide.
Mg2+(aq) + Ca(OH)2(lime) à Mg(OH)2(solid) + Ca2+(aq)
Lithium Argentina AG., 2026 Cauchari-Olaroz S-K 1300 Technical Report Cauchari-Olaroz Salars, Argentina | Page 325 of 418 |
Residual sulphate ions are precipitated by addition of calcium chloride in a stirred reactor. The precipitated solids are removed by a solid-liquid separation system.
CaCl2(sn) + SO42- + 2H2O à CaSO4(solid).2H2O + 2Cl-
The primary purification filter cakes report to final disposal.
Figure 14.10 Primary Purification Processing Circuit Diagram presents the configuration of this section of the plant.
Figure 14.10 Primary Purification Processing Circuit Diagram
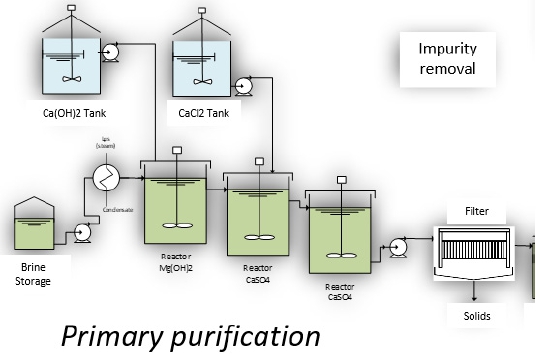
Source: Exar, 2026
| 14.4.2.2 | Secondary Purification – Calcium and Sulphates Removal |
Residual calcium and sulphates in the brine will be precipitated with soda ash and barium chloride.
BaCl2.2H2O + SO42- à BaSO4(solid) + 2Cl-
Ca2+(aq) + Na2CO3(sn) à CaCO3(solid) + 2Na+(aq)
The precipitated solids will be removed by a solid-liquid separation system. The secondary purification filter cakes report to final disposal. Figure 14.11 Secondary Purification Processing Circuit Diagram presents the configuration of this section of the plant.
Lithium Argentina AG., 2026 Cauchari-Olaroz S-K 1300 Technical Report Cauchari-Olaroz Salars, Argentina | Page 326 of 418 |
Figure 14.11 Secondary Purification Processing Circuit Diagram
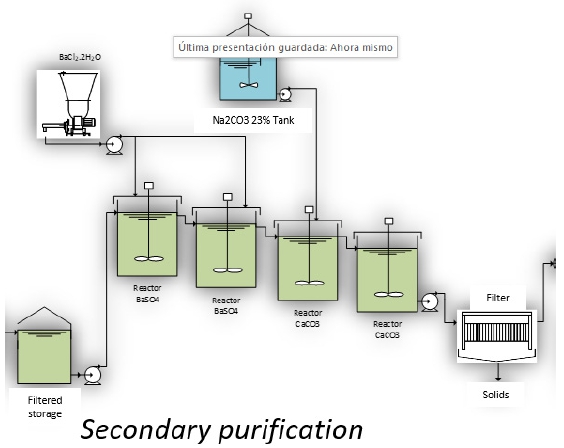
Source: Exar, 2026
| 14.4.2.3 | Primary IX |
An ion exchange system acts as a guard to remove any residual calcium, magnesium and other divalent ions. The main objective is to obtain Ca, Mg, Ba and Sr <1 ppm. Its utilization depends on the product the plant is producing.
Lithium Argentina AG., 2026 Cauchari-Olaroz S-K 1300 Technical Report Cauchari-Olaroz Salars, Argentina | Page 327 of 418 |
Figure 14.12 Primary IX Circuit Diagram presents the configuration of this section of the plant.
Figure 14.12 Primary IX Circuit Diagram
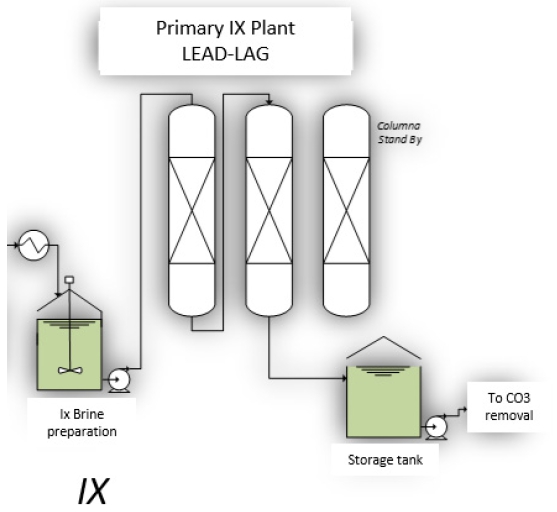
Source: Exar, 2026
For IX resin regeneration, the following stages are required with the following streams:
| · | Displacement and backwashing uses demineralized water. | |
| · | Regeneration: uses HCl 8%. | |
| · | Conversion uses NaOH 5%. | |
| · | Washing: uses demineralized water. |
| 14.4.2.4 | Carbonate Removal |
The objective is to reduce the carbonate concentration in the brine by adding HCl in desorption equipment for conditioning the brine for effective carbonate removal:
CO32- + HCl à CO2 + 2Cl-
Lithium Argentina AG., 2026 Cauchari-Olaroz S-K 1300 Technical Report Cauchari-Olaroz Salars, Argentina | Page 328 of 418 |
Figure 14.13 Carbonate Removal Circuit Diagram presents the configuration of this section of the plant.
Figure 14.13 Carbonate Removal Circuit Diagram
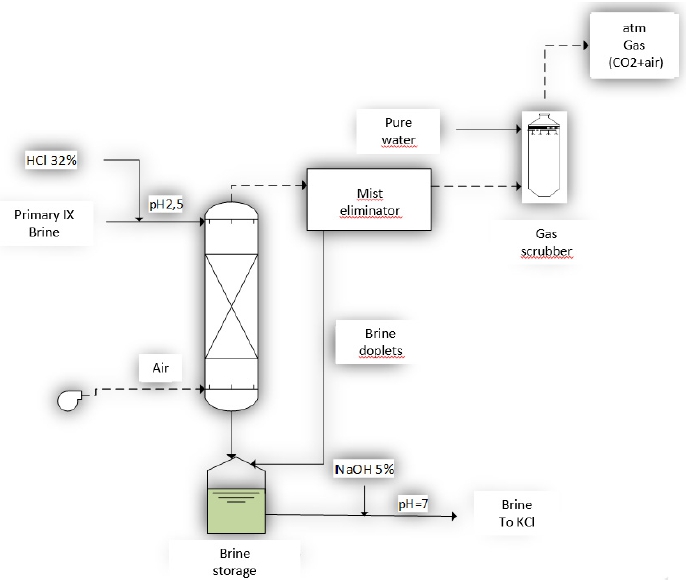
Source: Exar, 2026
| 14.4.3 | Evaporation and KCl Crystallization Stage |
Potassium and sodium concentrations are reduced by evaporative crystallization. Centrifuges are used to separate the sylvinite crystals. There are two trains, A and B, with the same capacity. This stage also increases the lithium concentration
The evaporator has the following steps:
| 1. | Vacuum evaporation. Triple-effect evaporator (4 bodies). Crystallization by water loss. |
| 2. | First Solid/Liquid separation in Pusher type centrifuges. Continuous operation. |
| 3. | Crystallization by cooling; crystals grow due to differential KCl saturation. There is crystal seeding in this operation. |
Lithium Argentina AG., 2026 Cauchari-Olaroz S-K 1300 Technical Report Cauchari-Olaroz Salars, Argentina | Page 329 of 418 |
| 4. | Second Solid/Liquid separation in Peeler type centrifuges. Batch operation. |
| 5. | Concentration adjustment to 3% by mass lithium by dilution. |
Figure 14.14 Evaporation and KCl Crystallization Diagram presents the configuration of this section of the plant.
Figure 14.14 Evaporation and KCl Crystallization Diagram
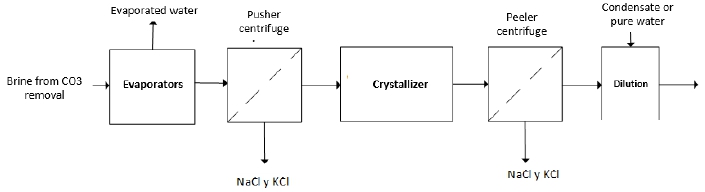
Source: Exar, 2026
| 14.4.3.1 | Secondary IX Polishing |
The objective is to remove divalent ions (Ca, Mg, Ba, and Sr) from the brine to allow the final lithium carbonate product to meet the required product specifications.
This operates in the same way as primary IX, but its operation will depend on previous stages performance.
The configuration of this stage is presented in Figure 14.15 Secondary IX Polishing Diagram.
IX regeneration is the same as in Primary IX.
Lithium Argentina AG., 2026 Cauchari-Olaroz S-K 1300 Technical Report Cauchari-Olaroz Salars, Argentina | Page 330 of 418 |
Figure 14.15 Secondary IX Polishing Diagram
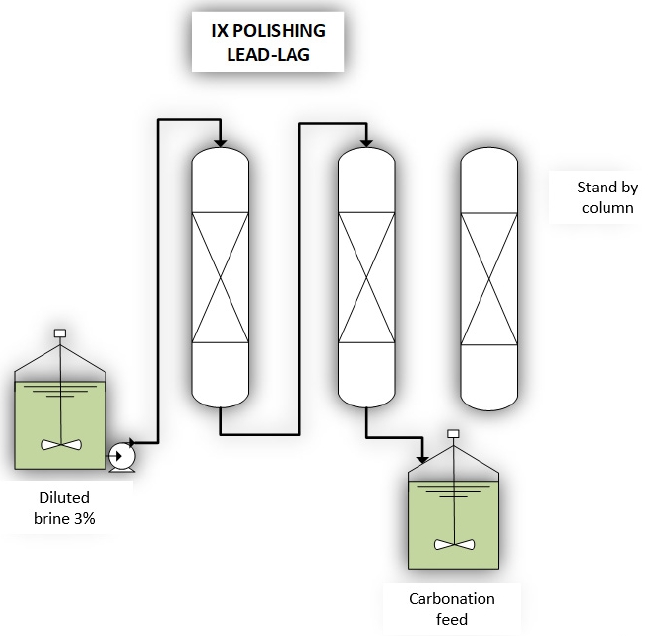
Source: Exar, 2026
| 14.4.4 | Lithium Carbonate Crystallization and Recovery |
The main objective is to generate the lithium carbonate (solid). The feed is divided between the first two reactors to reduce supersaturation and improve the size and purity of the crystals. Then the feed is mixed in the reactors with soda ash. The centrifuges dewater the crystals and then the crystals are washed with condensate to maintain a high yield of lithium, and the wash water will be sent to the evaporator feed.
Figure 14.16 Lithium Carbonate Crystallization Diagram presents the configuration of this section of the plant.
Lithium Argentina AG., 2026 Cauchari-Olaroz S-K 1300 Technical Report Cauchari-Olaroz Salars, Argentina | Page 331 of 418 |
Figure 14.16 Lithium Carbonate Crystallization Diagram
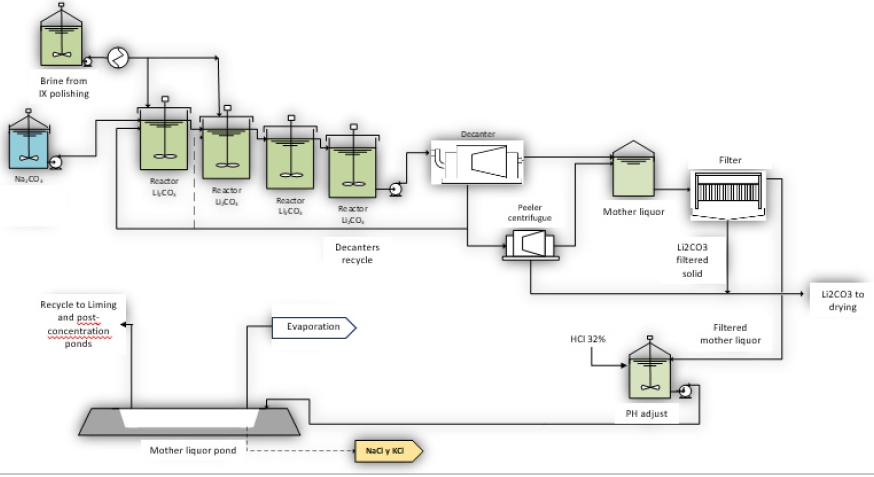
Source: Exar, 2026
In addition to the reactors, the process consists of:
| · | Decanter centrifuges: 3 decanter centrifuges operating in parallel receive the slurry from Reactor Trains A and B. (119.34 t/h). Objective: to obtain a dense lithium carbonate slurry with 30% solids by mass. |
| · | Peeler centrifuges: 6 peeler centrifuges in parallel, divided into two trains, each of a diameter of1.8 m. Objective: to obtain a lithium carbonate cake with retained moisture between 8% and 13% by mass. |
| · | Filter presses: 2 vertical plate-type filter presses with a filtration area of 100 m², receiving the mother liquor from the decanters and peelers. Objective: to recover the fine lithium carbonate solids suspended in the mother liquor. |
The carbonation reactors have a special configuration as shown on Figure 14.17 Carbonation Reactor Diagram. The reactor configuration includes a draft tube configuration to promote internal recirculation and the reaction between the soda ash and the feed brine.
Lithium Argentina AG., 2026 Cauchari-Olaroz S-K 1300 Technical Report Cauchari-Olaroz Salars, Argentina | Page 332 of 418 |
Figure 14.17 Lithium Carbonation Reactor Diagram
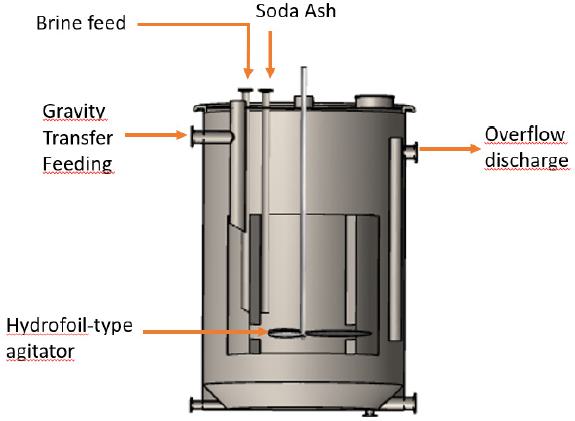
Source: Exar, 2026
| 14.4.4.1 | Mother Liquor Handling |
Mother liquor is sent to a dedicated pond for accumulation. Then it is fed to liming plant and post-concentration ponds system, as shown in Figure 14.18.
Exar continues to analyze optimization alternatives to improve the performance of this recycle.
Figure 14.18 Mother Liquor Diagram
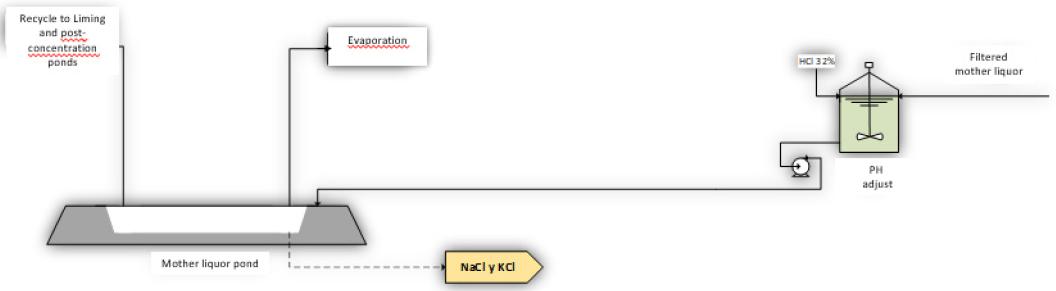
Source: Exar, 2026
| 14.4.5 | Lithium Carbonate Drying, Micronization and Packaging |
The wet cake from the centrifuges is fed to a rotary dryer with indirect steam heating. The product reaches the commercial moisture level in the dryer.
Lithium Argentina AG., 2026 Cauchari-Olaroz S-K 1300 Technical Report Cauchari-Olaroz Salars, Argentina | Page 333 of 418 |
The dry product is conditioned for packaging including the following process sequence:
The dry solid is transported to a distribution hopper that allows the flow to be split considering half of the flow rate to be fed into the micronization process and the other half going to the bulk packaging. An inline magnet bank is installed to remove all ferromagnetic particles.
The micronization system is employed to produce fine lithium carbonate for customers who require a fine, narrowly distributed particle size.
The final product can be packaged in two types of containers:
| · | 20 kg bags of micronized product, 50 bags per pallet. |
| · | 600 kg big bags of either micronized or non-micronized product, with pallets holding 2 big bags each. |
The overall configuration of the system is presented in Figure 14.19 Lithium Carbonate Drying, Micronization and Packaging Diagram.
Lithium Argentina AG., 2026 Cauchari-Olaroz S-K 1300 Technical Report Cauchari-Olaroz Salars, Argentina | Page 334 of 418 |
Figure 14.19 Lithium Carbonate Drying, Micronization and Packaging Diagram
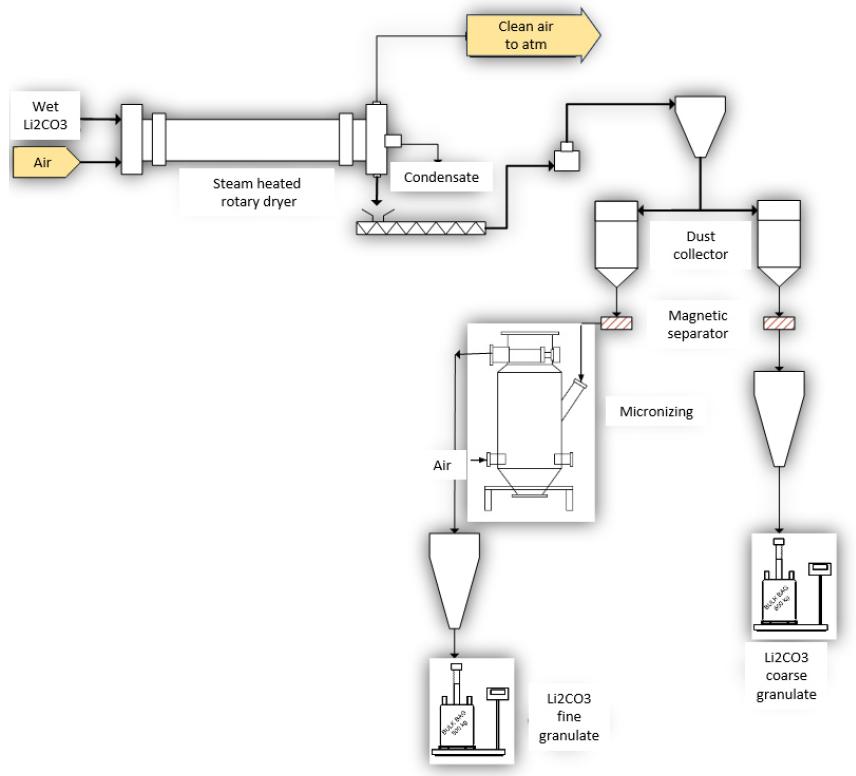
Source: Exar, 2026
| 14.5 | Reagents |
Quick lime (CaO) is trucked to site and stored in silos. Hydrated lime (Ca(OH)2) is made on site and distributed to the various users. Two different lime qualities have been sourced. A lower-grade lime is used to supply the liming plant while a higher quality grade CaO with less magnesium is used within the lithium carbonate plant for magnesium removal.
Soda ash (Na2CO3) is trucked to the Project site. Sodium carbonate solution will be prepared with purified water. It is used for calcium removal and to produce lithium carbonate in the processing facility.
Barium chloride is trucked and stored at site. A solution of barium chloride is prepared with purified soft water and used to remove sulphate in solution.
Lithium Argentina AG., 2026 Cauchari-Olaroz S-K 1300 Technical Report Cauchari-Olaroz Salars, Argentina | Page 335 of 418 |
Calcium chloride is trucked and stored at site. A solution of calcium chloride will be prepared with purified water and used to remove sulphate in solution.
Hydrochloric acid is trucked and stored at site as 32 wt.% solution. Hydrochloric acid as 32 wt.% solution is used as a pH modifier. The acid is diluted and used as awash solution in ion exchange columns.
Sodium hydroxide is trucked and stored at site. A solution of sodium hydroxide is prepared with purified water and used as a stripping agent in the boron solvent extraction circuit and as a pH modifier.
| 14.6 | Plant Design Basis |
The following describes the criteria for the operation of the Lithium Carbonate Plant:
| · | Plant operating capacity is 40,000 tpa lithium carbonate product; |
| · | The plant operates 292 days per year (80% runtime); |
| · | Design factor of 1.2; |
| · | Lithium carbonate plant yield is 85%; |
| · | Lithium carbonate has a purity of at least 99.5%; |
| · | 50 % of the production could be micronized; |
| · | Final product particle size distribution will be set based on customer demand; and |
| · | Product can be packed into 600 kg maxi bags for shipping and dispatching to customers or 20 kg bags of micronized product. |
| · | Process efficiency design was 53.7%. Overall lithium recovery increased from 53.7% in 2024 to 63% in 2025 based on: |
| Area | Recovery |
| Ponds | >90% |
| Liming Plant | 90% |
| Lithium Chemical Plant | 77,4% |
| Total | 63% |
The reasons are:
| o | Recoveries in Pre-Concentration ponds stabilized in >90% from 2024 as those ponds are fully ramped up and under full harvesting cycle. | |
| o | Recoveries in Liming plant stabilized in 90% from mid 2024 as this plant completed ramp up. | |
| o | Recoveries in Post-Liming ponds increased in 2025 as more ponds enter into harvesting process, with related entrained lithium brine recovery. |
Lithium Argentina AG., 2026 Cauchari-Olaroz S-K 1300 Technical Report Cauchari-Olaroz Salars, Argentina | Page 336 of 418 |
| o | Recoveries in Chemical Plants improved from 70.1% in 2024 to 77.4% in 2025 as those plants completed ramp-up. |
| 14.7 | Process Configuration Update |
Due to changes observed in product dynamics and market conditions, and with the objective of optimizing the project’s techno-economic framework, a comprehensive review of the originally contemplated process scheme has been conducted. As a result of this analysis, a series of measures aimed at improving operational flexibility, overall process efficiency, and the ability to supply the target market were defined. Within this context, the reconfiguration of certain aspects of the production process is proposed, as described below:
| · | Alternatives for improved recycle of mother liquor and other Li rich waste streams, to allow improved recoveries and lower re-processing costs |
| · | Installation of two new filters at the lime plant to increase process capacity and upstream operational flexibility. |
| · | Improvements to the brine distribution and accumulation system from wells, and reconfiguration and addition of marginal pond area, based on brine dynamics, evaporation rates, and upstream demand. |
| · | Preparation of soda ash using weak mother liquor (mainly wash waters) to recirculate internal streams, recover lithium, and optimize water usage. |
| · | Reconfiguration of carbonation reactors to increase processing volume (changing from two lines with four reactors each to four lines with two reactors each) and to enhance operational flexibility. |
| · | Increased operational flexibility at the KCl plant to improve response to unforeseen events. |
| · | Reconfiguration of KCl RILES to improve process efficiency by routing them to the purification area. |
| · | Modification of sulfate concentration to minimize lithium co-precipitation. |
| · | Potential elimination of barium chloride dosing in the purification stage, depending on the specifications of certain products and customers. |
Lithium Argentina AG., 2026 Cauchari-Olaroz S-K 1300 Technical Report Cauchari-Olaroz Salars, Argentina | Page 337 of 418 |
| 15.0 | Project Infrastructure |
| 15.1 | Main Facilities Location |
Figure 15.1 and Figure 18.2 present aerial views of the location of the main facilities that are part of Cauchari-Olaroz, including:
| · | Wellfield; |
| · | Evaporation ponds; |
| · | Lithium carbonate plant; |
| · | Salt and process residues disposal; and |
| · | Camp. |
| 15.2 | Brine Extraction |
| 15.2.1 | Brine Extraction Wells |
The Mineral Reserve model output states the required brine production rate is achieved with 39 brine wells. Additional 5 wells are planned for back up purposes (Table 15.1). It is estimated that an additional one well per year of operation will be drilled throughout the 40-year operation to maintain brine productivity.
Currently, 39 wells are considered for production. The wells will be screened across the most productive lithium bearing unit and sealed against freshwater aquifers.
|
Table
15.1 (Re: Section 12.0) | ||
| Description | Unit | Value |
| Total brine from wells (average) | L/s | 680.7 |
| Estimated average well brine output | L/s | 17.45 |
| Number of wells planned | no. | 39 |
| Reserve wells | no. | 5 |
| Total production wells required | no. | 44 |
| 15.2.2 | Well Pumps |
Submersible well pumps are equipped with variable speed drives. Flow from each well is monitored before discharging into a common pipeline. Brine from 7 wells is combined in two main pipelines that discharge into a collecting brine pool called ‘PDA2’. A pumping station allows brine transfer into another collecting brine pool called ‘PDA1’. Brine from the remaining wells is received in this collecting pool and the mixed brine is transferred to two main pipelines discharging directly into ‘PDA1’.
The collecting brine pools (‘PDA1’ and ‘PDA2’) enhance brine homogenization as well as act as intermediate pumping stations before transferring the full brine flow into the pre-concentration ponds. Transfer pumps from PDA2 to PDA1 have sufficient flow to meet the demands of the pond system.
Lithium Argentina AG., 2026 Cauchari-Olaroz S-K 1300 Technical Report Cauchari-Olaroz Salars, Argentina | Page 338 of 418 |
| 15.2.3 | Additional Equipment in the Wellfield |
In addition, the wellfield equipment required include:
| · | 10,000 L to 20,000 L capacity water trucks. |
| · | Temporary portable diesel generators for well pump operation in early stages. |
| · | Cable reel truck for electrical network. |
| · | Electrical lines for proper power distribution; and |
| · | Portable brine transfer pumps. |
| 15.2.4 | Wellfield Electric Power Distribution |
A 60 km 13.2 kV transmission line from the main plant substation feeds the two substations in the wellfield located at brine collection ponds PDA2 and PDA1. The substations downgrade the voltage for distribution to the pond pumps. Low voltage aerial distribution lines feed power to well pumps, where local transformers provide 400 V power to well pumps.
| 15.3 | Evaporation Ponds |
There are 28 evaporation ponds located in the southeast area of the Property. The ponds configuration includes two parallel trains. Associated piping allows for flexible operation and bypassing of individual ponds for maintenance activities.
Figure 15.1 shows infrastructure plan with the location of the evaporation ponds, while Figure 15.2 shows the individual evaporation pond locations.
Lithium Argentina AG., 2026 Cauchari-Olaroz S-K 1300 Technical Report Cauchari-Olaroz Salars, Argentina | Page 339 of 418 |
Figure 15.1 Aerial View - Main Facilities
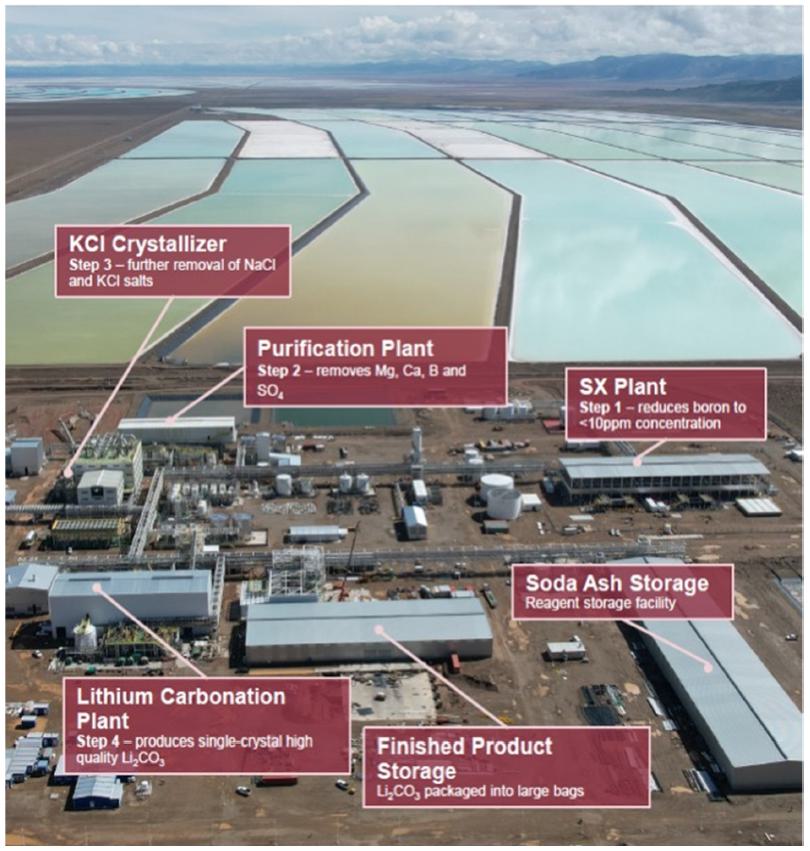
Source: Exar (2026)
Lithium Argentina AG., 2026 Cauchari-Olaroz S-K 1300 Technical Report Cauchari-Olaroz Salars, Argentina | Page 340 of 418 |
Figure 15.2 Aerial View of Evaporation Ponds
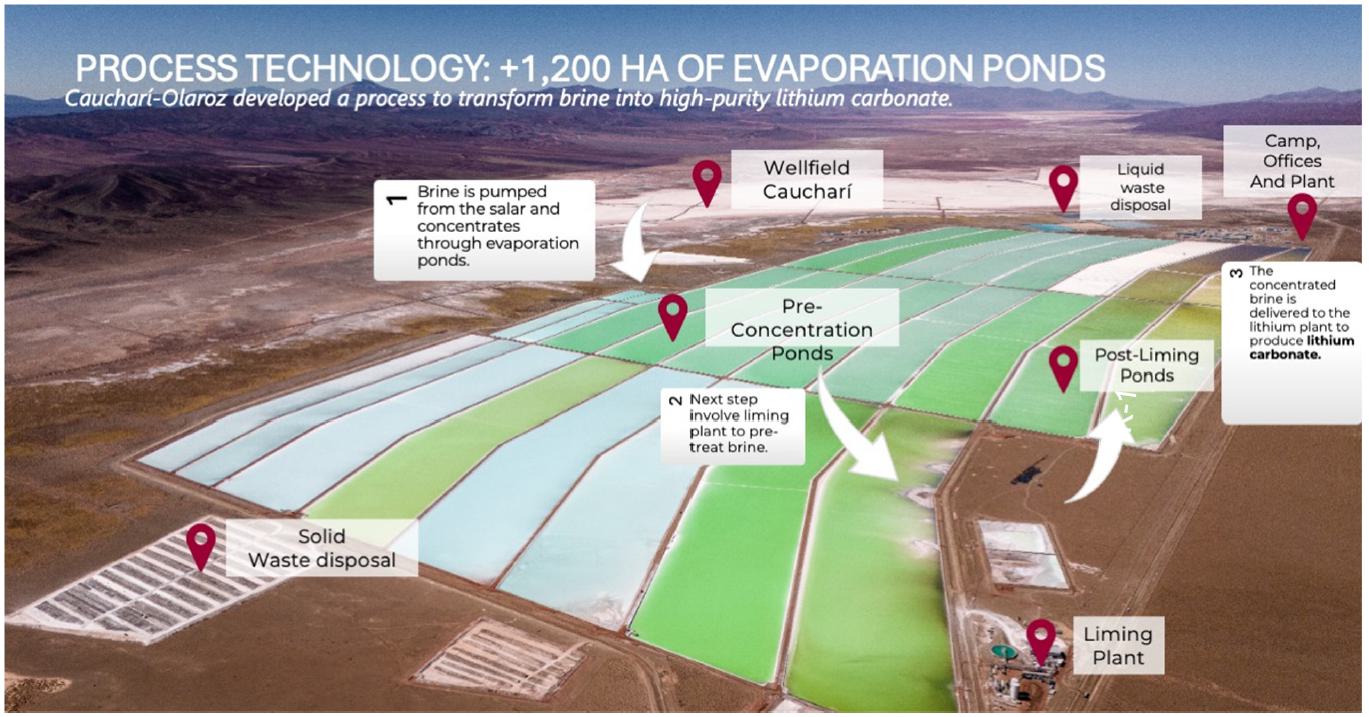
Source: Exar (2026)
| 15.4 | Salt Harvest Equipment |
Pond design and operation require the removal of the salt deposits formed at the bottom of the ponds. Typical earthmoving machinery is used for salt removal, such as front-end loaders and dump trucks. There is a minimum salt depth in the pond to protect the liner from harvesting activities. Harvested salts, some of which are rich in potassium, will be stockpiled locally and available for future recovery pending market value.
| 15.5 | Liming Stage |
| 15.5.1 | Quick Lime Reception |
The quicklime is received from a truck that feeds storage silos by pneumatic conveying. Quicklime is converted to hydrated lime or “slaked Lime” where lime is reacted with water in the plant’s engineered system. Lime slurry is discharged from the reaction system and is screened to remove larger agglomerated material and contaminants. The lime slurry is stored in a tank and distributed through a recirculating loop into two liming systems. One for higher quality lime, one for cost-effective and adequate lower quality lime.
The lower quality lime is used to treat the brine at the ponds. The reaction between the lime and the brine results in a precipitated solid containing almost all of the magnesium and most of the sulphate. The solids are filtered from the brine and washed to recover the lithium. The solids are then disposed of in an on-site salt pile, while the brine is sent for further concentration.
Lithium Argentina AG., 2026 Cauchari-Olaroz S-K 1300 Technical Report Cauchari-Olaroz Salars, Argentina | Page 341 of 418 |
| 15.5.2 | Liming System |
In the liming system, a set of processes allow for the removal of magnesium and sulphate present in the lithium-rich brine obtained from the pre-concentration ponds. The process is carried out in three steps: 1) preparation of the milk of lime, 2) its addition to the brine and the resulting reaction, and 3) separation of the undesired precipitated solid byproducts of the reaction.
| 1. | Preparation of Milk of Lime: Quicklime is delivered by truck and transferred to storage silos using a pneumatic conveying system. From the silos, the quicklime is mixed with water in a specially designed system, undergoing a typical slaking reaction. |
| 2. | Lime addition reaction: Milk of lime is introduced into lithium brine, triggering a reaction that forms magnesium and sulphate precipitates. This is done in 3 continuous stirred tank reactors in series. More than half of the unwanted initial sulphate and nearly all the magnesium originally present in the brine form precipitates. |
| 3. | Separation of undesired solid byproducts: These precipitates are subsequently removed using press filters, yielding a clarified brine. As a result, the filtered brine is left at a reduced sulphate content and nearly free of magnesium. The filter cakes are then transported to a landfill for final disposal. |
The clarified brine is then transferred to the post-Liming evaporation ponds for further concentration. This additional concentration is necessary before the brine can be fed into the lithium carbonate plant.
| 15.6 | Lithium Carbonate Plant |
The plant is located approximately 8000 m south of National Highway 52. Plant equipment is designed for an 80% On Stream Factor (7,006 hours per year).
| 15.6.1 | Process Facilities |
The process facility flow chart is shown in Figure 15.3 and is referred to in the sections below.
Lithium Argentina AG., 2026 Cauchari-Olaroz S-K 1300 Technical Report Cauchari-Olaroz Salars, Argentina | Page 342 of 418 |
Figure 15.3 Process Facility Flow Diagram
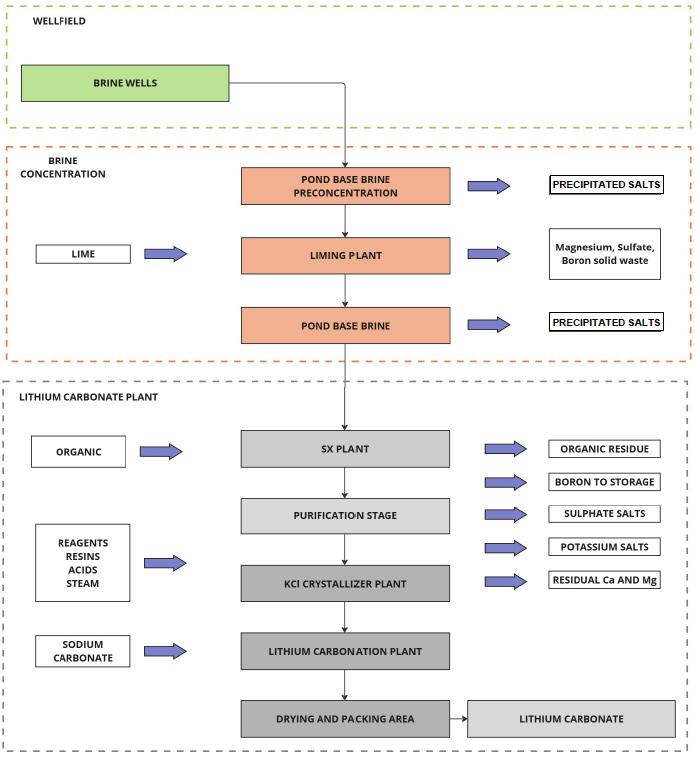
Source: Exar (2026)
| 15.6.1.1 | Boron Removal - Solvent Extraction |
The boron concentration from the last evaporation pond is too high to make good quality lithium carbonate and most of it needs to be removed. A solvent extraction process has been engineered to reduce the boron concentration to <10 ppm. The feed needs to be conditioned prior to feeding the solvent extraction process. The organic material being used is highly selective for boric acid species, so the feed must be acidified prior to loading the organic material.
Lithium Argentina AG., 2026 Cauchari-Olaroz S-K 1300 Technical Report Cauchari-Olaroz Salars, Argentina | Page 343 of 418 |
The extraction circuit is made up of a set of conventional mixing-decanters that contact an organic mixture to selectively remove the boron without dissolving in the brine. This phase loads the brine with boron compounds. The organic phase is then regenerated by removing the boron from the organic phase, while the purified brine is further purified.
The regeneration of the organic phase is done by a caustic solution in a set of mixing-decanters. The boron species are removed as sodium borate solution. The sodium borate solution is accumulated in intermediate ponds and later used for minor dilutions in pond pumping operations. The solids associated with this stream precipitate in the concentration pond system. The regenerated organic phase is recycled back to the extraction pipeline.
| 15.6.1.2 | Brine Purification |
The brine purification section targets the removal of Mg, Ca, B, and SO4 to allow the evaporation system to operate at a low scaling rate and achieve the uptime target for the process plant.
| 15.6.1.3 | Primary Treatment |
The primary treatment uses slaked lime to precipitate magnesium and calcium borates. Additional reagents are added to remove sulphates. The primary treatment uses a higher quality of quick lime to purify the brine. These reagents precipitate the target ions as solids and are engineered to allow for efficient filtration and washing of the solids to maintain the yield of lithium. The wash water is returned to the process while the solids are sent to the final disposal pile. The purified brine is then sent to secondary treatment.
| 15.6.1.4 | Secondary Treatment |
The secondary treatment polishes the brine from the primary treatment to finish removing sulphates and divalent ions from the brine. The brine is treated with calcium chloride and barium chloride to eliminate the sulphate. A small dose of soda ash is used to remove the divalent ions as precipitated carbonates.
The slurry produced in the chemical treatment is sent to a solid/liquid separation system. This system filters off the solids and washes the solids with water to recover the lithium. The moist cake is then discharged into a storage pile. The brine from this treatment then goes to ion exchange for final purification of the divalent ions.
| 15.6.1.5 | Primary IX |
The purified brine from secondary purification filter is subject to an ion exchange treatment to remove impurities to minimum levels.
The IX system includes a set of columns that allow for continuous operation and resin regeneration process. Conventional steps are used for elution to restore the ion exchange capacity of the resin including elution, regeneration and washing. Multiple columns are cycled through the loading, regeneration, elution, and lag processes.
Lithium Argentina AG., 2026 Cauchari-Olaroz S-K 1300 Technical Report Cauchari-Olaroz Salars, Argentina | Page 344 of 418 |
| 15.6.1.6 | Brine Concentration and Na/K Reduction |
After the filtration of the slurry from the brine purification plant, the brine is concentrated to increase the lithium concentration for final polishing prior to lithium carbonate production. This process removes NaCl and KCl salts from the brine to meet the target quality specifications. The resulting NaCl and KCl salts are separated from the brine with a centrifuge and washed with process condensate. The resulting wash liquid is recycled back to the feed for the evaporation/ crystallization. The solid NaCl and KCl salts are sent to stockpile disposal, and the purified brine is sent to the lithium carbonate precipitation reaction system.
| 15.6.1.7 | Feed Preheat |
The feed is preheated via a series of preheaters using condensate and steam to condition the brine prior to processing in the multiple effect evaporator. The steam heaters are used to raise the temperature.
| 15.6.1.8 | Multiple-Effect Evaporation and Crystallization |
A forced-circulation evaporator/crystallizer is utilized for the three-effect multiple effect design. The design of this system incorporates the third effect using two crystallizers. An additional centrifuge separates the NaCl from the second effect crystallizer. The discharge from the third effect crystallizer is sent to a flash-cooled crystallization stage.
| 15.6.1.9 | Flash-Cooled Crystallization |
The flash-cooled crystallizer provides further removal of salts by the controlled crystallization of KCl and NaCl. The mixed salts are removed from the crystallizer by a centrifuge.
| 15.6.1.10 | Process Condensate Collection |
Additional facilities include a process condensate handling, reverse osmosis feed water, and material handling equipment for solids handling.
| 15.6.1.11 | Mg/Ca Polishing IX |
In case to produce battery grade product, the conditioned stream from the evaporation is fed to ion exchange resin (IX) for further removal of Mg and Ca to less than 1 ppm. This is a conventional commercial circuit that allows for continuous operation and resin regeneration in a batchwise operation with continuous processing and purification of brine.
| 15.6.2 | Lithium Carbonate Production |
| 15.6.2.1 | Carbonation |
The lithium carbonate production system consists of reactive crystallizer that produces single-crystal product to obtain a high yield and consistent quality.
There are facilities to control temperature and pH and to dose the Na2CO3 to optimize precipitation conditions. A heat recovery system is also included in this stage. The crystallization train includes four reactors working in series.
Lithium Argentina AG., 2026 Cauchari-Olaroz S-K 1300 Technical Report Cauchari-Olaroz Salars, Argentina | Page 345 of 418 |
| 15.6.2.2 | Final Product |
The resulting slurry is filtered to remove the lithium carbonate product. The filter operates as a counter current wash system using the wash water from the filtered stream. The final wash solution is used for dilution and the brine from the reaction is recycled to recover the lithium. A portion of solids are recycled from the separation system to the first one reactor to promote the crystals growing and improve the number of solids in the reactors.
The moist cake from the filter is centrifuged on a basket centrifuge and then fed to a rotary dryer. The wash water is sent to the counter current wash on the lithium carbonate filter.
The dryer is an indirect steam tube rotary dryer type. A baghouse is used to collect fine particles of lithium carbonate to control loss of final product.
The product is air-cooled while transported by a pneumatic system to storage. Then it is fed to the micronizer equipment to provide a defined particle size.
The lithium carbonate product is loaded in silos based on a packaging size system. It can be packaged into polyethylene big bags or sealed plastic bags.
| 15.6.3 | Plant Wide Instrumentation |
Well, pond, and plant control signals are be provided to a centralized control system. The control system utilizes redundant controllers. Communication with remote devices such as those associated with wells and ponds will utilize fiber optic communications. Distributed control system information, operation, and alarms are accessible from a centralized control room.
| 15.7 | Supporting Services |
| 15.7.1 | Fresh Water |
The freshwater requirements are provided by local wells within the watershed. The infrastructure for water handling includes wells, low-voltage transmission lines to power the wells, pipelines, storage tanks and reverse osmosis plants. Water is required by the process and both camps.
First, a pumping system fills a water storage tank located in the plant. This in turn feeds the fire water system and the raw water system. Raw water feed the ultra-filtration and reverse osmosis (RO) and water treatment plant to produce pure water for the process. At the time of this report the Company has applied to increase the freshwater use to 150 L/s which meet the water demands of an operation of more than 40,000 tpa LCE. The actual water consumption is 70-80 L/s.
Then, the well currently supplying freshwater to both camps are called PBI and is located 3.5 km north of the Operations Camp.
The infrastructure installed at Campamento de Construcción includes a 20 m3 raw water storage tank, two reverse osmosis plants that together have a production capacity of 7.74 m3/hour, 110 m3 of treated water storage distributed in 4 tanks and a pressurization system.
The Operations Camp has a 25 m3 raw water storage tank, two reverse osmosis plants that together have a production capacity of 13 m3/hour, 160 m3 of treated water storage distributed in 6 tanks, and two pressurization systems. In addition, the reverse osmosis plant supplies water to 4 tanks of 25 m3 each for the firefighting system.
Lithium Argentina AG., 2026 Cauchari-Olaroz S-K 1300 Technical Report Cauchari-Olaroz Salars, Argentina | Page 346 of 418 |
| 15.7.2 | Sanitary Services |
Each camp has an effluent treatment plant that receives and treats sanitary effluents.
These plants work under the activated sludge system and generate a treated effluent whose physical parameters make it suitable for use in road irrigation or disposal in infiltration beds.
| 15.7.3 | Diesel Fuel |
The plant includes a diesel storage and dispensing station for mobile equipment and transport vehicles. The total storage capacity is 210,000 liters of diesel.
Diesel fuel is used in electric generators, cargo vehicles, vans, road equipment and special equipment used in operations (cranes, telescopic handlers, forklifts). Spill kits and fire fighting equipment are located on equipment and in each building and designated area.
| 15.8 | Permanent Camp |
The permanent camp (called Operations Camp), and the Construction Camp are located 8,000 m south of National Highway 52. The Operations Camp is a complete housing and administrative complex to support all activities of the operation with a capacity of 762 people.
The Operations Camp includes office buildings, living area, dining facilities, medical room, and recreation areas, consisting of a gym, an indoor sports center, a recreation room and an outdoor soccer field.
In the Construction Camp there are eight housing modules with a total capacity of 392 people, which are only used occasionally. In addition, this camp includes the pilot plant facilities, water treatment plants and contractor workshops.
Figure 15.4 shows the camp layout and its components.
Lithium Argentina AG., 2026 Cauchari-Olaroz S-K 1300 Technical Report Cauchari-Olaroz Salars, Argentina | Page 347 of 418 |
Figure 15.4 Project Infrastructure Camp General Layout
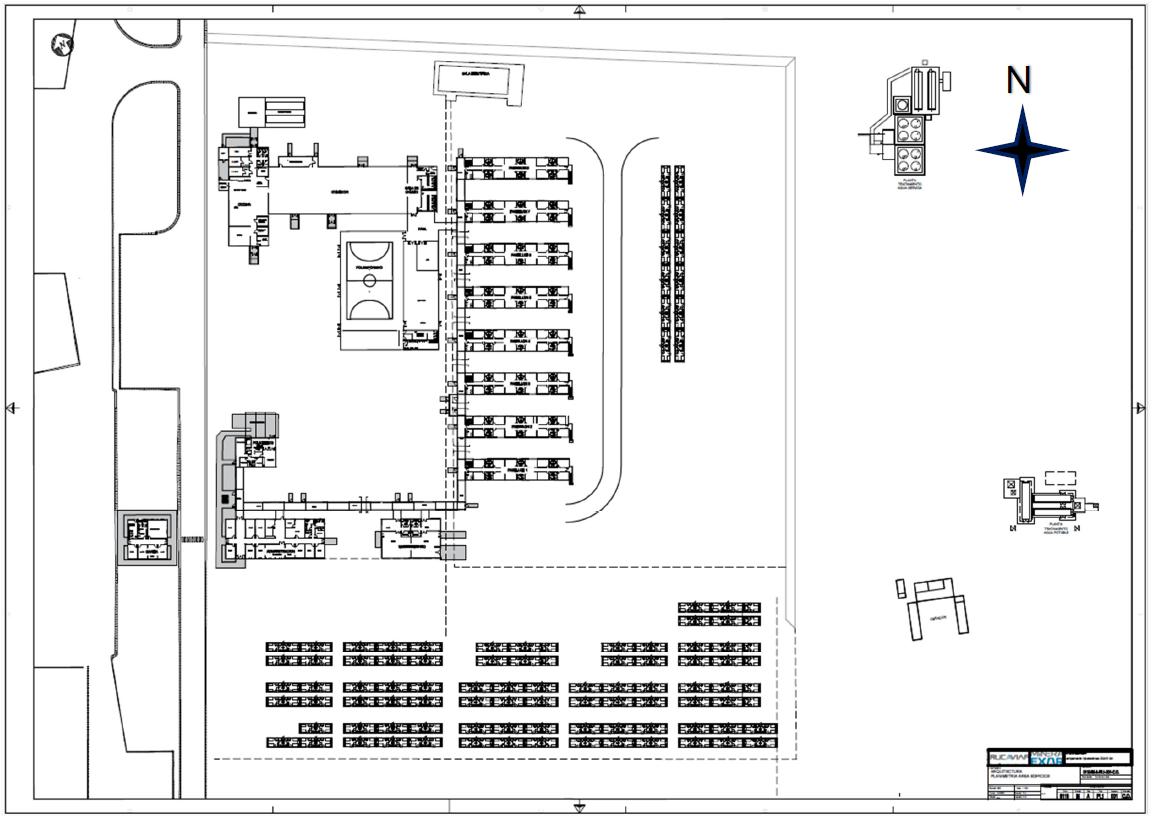
Source: Exar (2026)
Lithium Argentina AG., 2026 Cauchari-Olaroz S-K 1300 Technical Report Cauchari-Olaroz Salars, Argentina | Page 348 of 418 |
| 15.8.1 | Other Buildings |
Additional buildings in Operations Camp include:
| · | Lithium carbonate plant. |
| · | Spare parts and consumables warehouse building. |
| · | Soda ash storage building. |
| · | Final product – lithium carbonate – storage building. |
| · | Chemical laboratory. |
| · | Maintenance Shop. |
| · | Water treatment plants. |
All buildings are equipped with appropriate lighting, heating, ventilation, and security provisions. Buildings and specially equipped vehicles are equipped/furnished with safety showers, spill kits, first aid kits, etc.
| 15.8.2 | Security |
At the main entrance of the plant, there is a barrier and a security booth to grant access to the facilities. Then, there is a second access control point upon reaching the main module of the camp. There, individuals' entry is registered again using facial and fingerprint recognition.
Given the remote location of the facilities, it is not necessary to enclose the plant with a metallic perimeter fence. The plant is illuminated to allow night work and improve security.
| 15.9 | Off-Site Infrastructure and Support Systems |
| 15.9.1 | Natural Gas Pipeline |
The natural gas pipeline transport fuel to the Project from the Rosario gas compression station located 52 km south of the plant. The main pipeline belongs to Gas Atacama. This natural gas pipeline has sufficient capacity to supply its current users and the needs for the Project site.
The Exar Gas Pipeline began operations on April 28, 2022, with a pressure of 25.5 bar. It has a length of 53,044 meters, a diameter of 6 inches, and a pipe wall thickness of 4.8 mm in regular terrain and 7.11 mm in special crossings (Schedule 40, API 5L GrB). The pipeline draws gas from the mainline owned by the ENEL-Gas Atacama Group, which is a 20-inch export pipeline that is supplied by REFINOR and TGN (Vaca Muerta).
The Exar gas pipeline operates according to the following specifications:
| · | - Maximum Operating Pressure (MAPO): 27 barg. |
| · | - Design Pressure: 82.5 bar (NAG-100/Section 105 / Design Factor: 0.60). |
It is a welded pipeline with 100% of its welds radiographed, following API 1104 standards, and it has a 1600-micron anticorrosive coating (NAG-108 (2009), Subgroup G4.2). It includes a Cathodic Protection System using Sacrificial Anode Batteries (High-Potential Magnesium Alloy, AZ-63).
Lithium Argentina AG., 2026 Cauchari-Olaroz S-K 1300 Technical Report Cauchari-Olaroz Salars, Argentina | Page 349 of 418 |
Minimum burial depth is 1.00 m, with 2.50 m for road crossings and 3.50 m for water crossings. Along its route, there are two automatic line valves, as well as a Primary Regulation and Measurement Station, where it connects to Gas Atacama and measures the flow mainly consumed by two boilers that generate steam for Exar’s processes.
The maximum flow rate (Qmax) is 6600 Sm³/h of natural gas, and the Company is currently in a ramp-up phase, consuming an average of 3300 Sm³/h.
| 15.9.2 | Electrical Power Supply |
Electricity is provided by a new 33 kV transmission line that interconnect with an existing 345 kV transmission line located approximately 60 km south of the Project. The interconnection consists of a sub-station with a voltage transformer (345/33 kV) and associated switchgear.
A stepdown 33/13.2 kV substation at the Project site, consist of two voltage transformers (33/13,2 kV, 15-20 MVA), one (1) 33 kV electrical room and one (1) 13.2 kV electrical room with suitable switchgears and auxiliary equipment for the 13.2 kV local distribution system.
The 13.2 kV local electrical distribution system provides power to the plant, camp, intermediate brine accumulation and homogenizing pools/lime pumps, wells, and evaporation ponds. In general, all the distribution is based on overhead lines, unless there are major restrictions then the underground distribution is adopted.
The estimated average load for the Project is around 8.4 MW or 72.240 MWh/y, assuming a plant and periphery utilization factor of 0.86. The power line has sufficient capacity for this load plus the existing users. The installed power energy is 16 MW.
The whole electrical system is designed for the maximum load condition plus a safety factor of 1.2.
A stand-by diesel generating station, located close to main substation, will power selected equipment during outages. Also, the project has 2 UPS to sustain energy for a perior and to stabilize.
| 15.9.3 | Water Pipeline |
A 53 km long water pipeline parallel to the gas pipeline was constructed to transport 105 L/s to the lithium plant. The actual water consumption is 70-80 L/s.
| 15.9.4 | Control Systems and Instrumentation |
| 15.9.4.1 | Control and Data Building |
The Project considers the design of a single Control and Data Building, dedicated to the control and monitoring of Plant and Peripherals, located near the electrical substation, which contains the following rooms:
| · | 1 control room. |
| · | 1 communication room. |
| · | 2 server room. |
Lithium Argentina AG., 2026 Cauchari-Olaroz S-K 1300 Technical Report Cauchari-Olaroz Salars, Argentina | Page 350 of 418 |
| · | 1 HVAC room. |
| · | 1 UPS room. |
| · | 3 offices |
| · | 1 meeting room. |
| 15.9.4.2 | Telecommunications System |
Necessary infrastructure for the proper functioning and integration of the systems and services that are being used in the Project, specifically, the Control Networks, Auxiliary Services, CCTV and SCADA, including:
| · | 125 km of Optical Fiber 48 Core Single-Mode ADSS Cable; and |
| · | 50 Communications and Fiber Optic Cabinets. |
This infrastructure interconnects all the Electric Rooms, Control Room, Communications Room, SSEE, Powerhouse, Laboratory, TAS Plant, Truck Weighing, and Control Checkpoint.
This year, the following improvements will be implemented:
| · | A real-time monitoring system to provide just-in-time visibility into what is happening at the core communication devices level. |
| · | Implementation of redundant network infrastructure (optical fiber, “O.F.”) to ensure high availability of the SCADA system. |
| · | Implementation of a network management and logical security service to enable proactive operations. |
| 15.9.4.3 | Control System |
The Control System is responsible for the control and supervision of the process in the Plant and Peripheral areas of the Exar Lithium Project. The Control System is based on a conventional Control System with integral architecture.
The Control System is made up of the following main components:
| · | Control Panels – Local and redundant controllers. |
| · | Remote Inputs and Outputs Panels. |
| · | Operation and Engineering Stations. |
| · | Video-Wall. |
| · | Servers and printers. |
| · | Instrumentation: |
| o | Analog Signal, 4-20 mA with Hart protocol. |
| o | Digital Signal, with control voltage in 24Vdc. |
| · | Process Control Network: Considered in the scope of the Telecommunications System, ETHERNET network over optical fiber, with ring topology, which allows the Control Panels to interact (higher level), and star topology to communicate with operated equipment (lower level). |
Lithium Argentina AG., 2026 Cauchari-Olaroz S-K 1300 Technical Report Cauchari-Olaroz Salars, Argentina | Page 351 of 418 |
| · | Control Subnetworks: Considered in the scope of the Telecommunications System, ETHERNET network over fiber optic, which allows to communicate the Panels of Remote Inputs and Outputs with their Controllers, and the motor controls, either smart relay or frequency drivers, with the associated Controller, both with an independent ring topology. A new Control Room, the “Control Room Intelligence Center,” will be created, where the entire operation can be monitored in real time. |
| 15.9.4.4 | Other Systems |
The following systems are outside the scope of Engineering, so the following infrastructure is defined by others:
| · | CCTV System. |
| · | Fire Detection System. |
| · | IP Telephony System; and |
| · | Access Control System. |
However, in the developed infrastructure (fiber optic networks), communication networks have been enabled for them to be implemented on them, without the need to make new fiber optic tracings.
Other systems to be implemented:
| · | Real Time - Operational Intelligence Center): An “Operational Intelligence Center” will be implemented for Hydrogeology Area and another for Brine Production, enabling both areas to fully monitor operations in real time and make just-in-time decisions. In addition, predictive systems will be implemented to rapidly improve production efficiency. This will also allow data from both areas to be correlated with other systems such as SAP and satellite systems. |
| · | IA Athena Platform: Approximately 70% of an AI platform has been developed and implemented, which correlates data across the entire plant and enables real-time identification of production deviations, while also providing information to implement real-time improvements to enhance production efficiency. |
| · | The objective is to complete 100% coverage and, based on this platform, develop a simulation system and digital twins. The goal is to simulate scenarios without incurring additional costs associated with physical testing, which has been the approach used to date. |
Lithium Argentina AG., 2026 Cauchari-Olaroz S-K 1300 Technical Report Cauchari-Olaroz Salars, Argentina | Page 352 of 418 |
| 16.0 | Market Studies |
This section provides a summary of the supply and demand of lithium and price forecasts. Material presented in this chapter is primarily from the, Benchmark Minerals Lithium-Supply-Demand-Price-Forecast Q4 2025 Report, and U.S. Geological Survey, Mineral Commodity Summaries (USGS), January 2025.
| 16.1 | Lithium Demand |
Lithium has unique properties that enables its use in many applications. As the lightest metal with a high electrochemical potential, lithium is particularly well suited for energy storage. Lithium-ion batteries represent the most electrochemically mature and commercially proven technology for electric vehicles, battery energy storage systems (“BESS”), owing to their high energy density, efficiency, and scalability., lithium is also used in a variety of industrial applications, including glass and ceramics, lubricating greases, metallurgy, pharmaceuticals, and polymers.
According to Benchmark Minerals Intelligence, global lithium demand is expected to grow at a sustained double-digit pace through the end of the decade, driven primarily by battery applications. Benchmark projects global lithium demand to increase by approximately 20% year-on-year in 2026, with incremental annual demand growth of roughly 250–300 kt LCE per year through 2030 under its base-case scenario. Battery applications remain the dominant source of demand, with electric vehicles accounting for approximately three-quarters of total battery-related lithium consumption, while BESS represent the fastest-growing segment. Benchmark estimates that BESS demand will expand by approximately 48% in 2026, reaching ~427 kt LCE, supported by accelerating global grid-scale and behind-the-meter deployments. Industrial and other non-battery uses are forecast to contribute a ~210 kt LCE of demand in 2026, with around half of this demand concentrated in China. Over the longer term, Benchmark forecasts lithium demand to grow at a ~9.7% compound annual growth rate from 2025 to 2040, with battery demand increasingly dominated by lithium-ion chemistries, reinforcing lithium’s strategic importance in electric mobility, stationary energy storage, and high-energy-density applications. (Figure 16.1).
Figure 16.1 Lithium Demand in Batteries (2024)
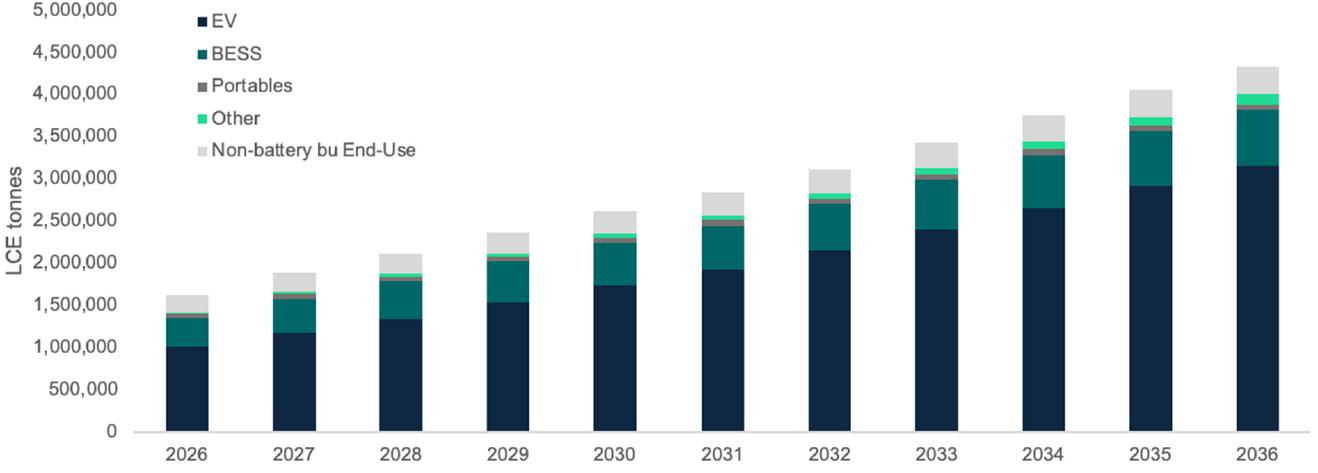
Source: Benchmark Minerals Lithium-Supply-Demand-Price-Forecast Q4 2025
Lithium Argentina AG., 2026 Cauchari-Olaroz S-K 1300 Technical Report Cauchari-Olaroz Salars, Argentina | Page 353 of 418 |
Lithium has been listed as one of the critical elements by the U.S. Department of Energy based largely on its importance in rechargeable batteries. Lithium-ion battery is the preferred form for high-density applications like EVs and portable electronics. A full-electric EV can require over 50 kg of LCE in the battery.
Lithium consumption is expected to increase significantly in the coming years driven by a rapid increase in demand for EVs and BESS. According to Benchmark Minerals, EV sales have grown by 3.5 -4.0 million EVs per year over the last three years, which represents between 200-250 kMt-LCE incremental demand year on year. The EV penetration rate forecast is presented in Figure 16.2 and the BESS penetration rate forecast is presented in Figure 16.3.
Figure 16.2 EV Penetration Rate Forecast
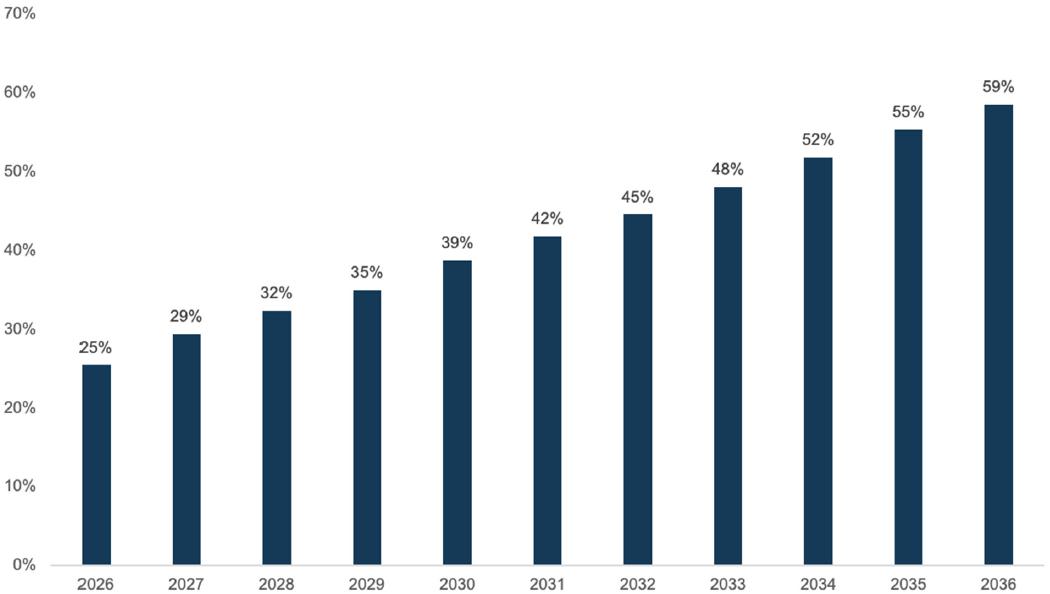
Source: Benchmark Minerals Lithium-Supply-Demand-Price-Forecast Q4 2025
Lithium Argentina AG., 2026 Cauchari-Olaroz S-K 1300 Technical Report Cauchari-Olaroz Salars, Argentina | Page 354 of 418 |
Figure 16.3 BESS Global Demand Growth
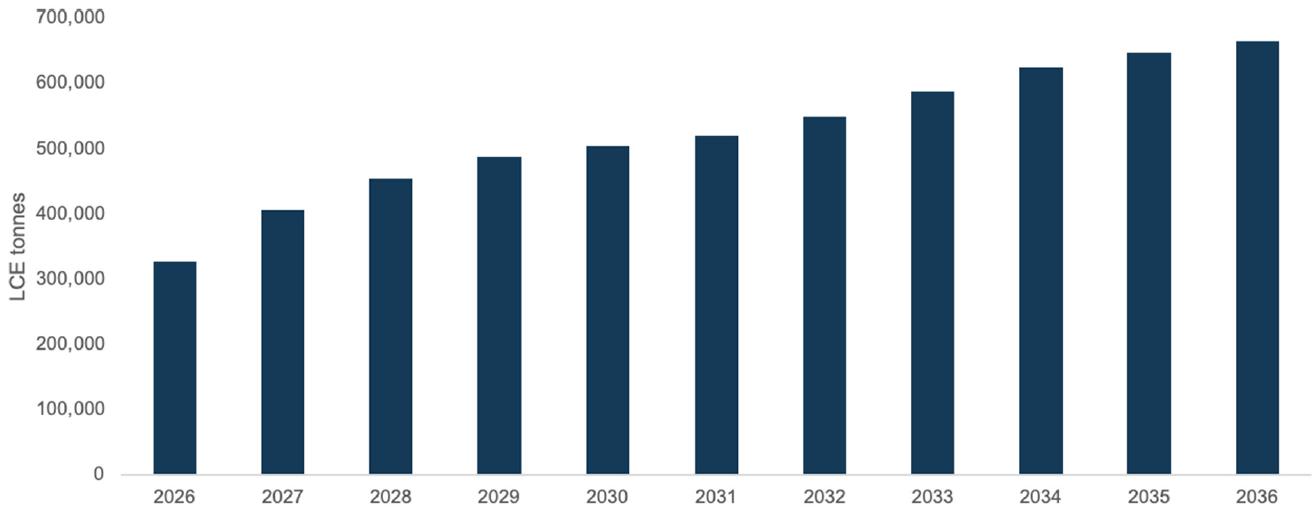
Source: Benchmark Minerals Lithium-Supply-Demand-Price-Forecast Q4 2025
While Benchmark Minerals Intelligence has identified notable rapid shifts within the industry such as the structural shift of EVs and BESS markets towards Lithium Iron Phosphate chemistry, competing chemistries to Lithium based batteries such as Sodium Ion chemistries have been categorized as hedges to lithium demand rather than as replacement or displacement options. Benchmark does not view the potential adoption of these technological developments as representing significant impact to the demand outlook, rather they should be viewed as strategic supplements with a generally low impact to overall demand. Benchmark has noted that the market share of competing technologies such as Sodium Ion represents less than 1% of the market in 2025. Furthermore, Benchmark also notes that the estimated production increases of both solid state and lithium metal batteries will likely support demand growth.
| 16.2 | Lithium Supply |
Lithium occurs in the structure of pegmatitic minerals, the most important of which is spodumene (hard rock) and due to its solubility as an ion, is also commonly found in brines and clays. Pure lithium does not occur freely in nature, only in compounds. Starting in the 1980s, brine-based lithium chemicals provided most of the supply; however, in recent years, hard rock forms have surpassed brine as the largest feedstock for lithium chemical production.
As a result of continued exploration, Measured and Indicated lithium Mineral Resources have increased substantially worldwide and total about 115 million tonnes. (USGS, January 2025).
The world's largest known lithium reserves are in Chile, which accounts for 31% of lithium reserves, followed by Australia with 23%, and Argentina in third place, accounting for 13% of global reserves (USGS, January 2025). Lithium production is summarized in Figure 16.4.
China is a global leader in lithium refining and battery production, with a highly advanced and integrated supply chain. It imports raw lithium minerals, mainly from Australia, South America and increasingly Africa and then processes them into lithium compounds, such as lithium hydroxide and lithium carbonate.
Lithium Argentina AG., 2026 Cauchari-Olaroz S-K 1300 Technical Report Cauchari-Olaroz Salars, Argentina | Page 355 of 418 |
Figure 16.4 Lithium Production (2024) by Country
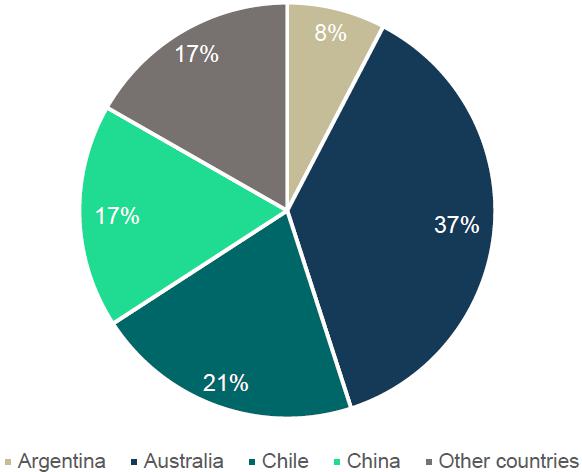
Source: U.S. Geological Survey, Mineral Commodity Summaries, January 2025. It excludes US production.
Minerals are expected to play a key role in meeting the growing demand for critical resources in the coming years, contributing the majority of the incremental supply. The global lithium production is largely driven spodumene operations in Australia, brine operations in Chile and Argentina. Over the last 12 months, Australia’s spodumene lithium exports were approximately 530,000 metric tonnes of LCE, Chile’s lithium exports were about 270,000 metric tonnes of LCE, and Argentina’s lithium mineral exports reached approximately 90,000 metric tonnes of LCE (Benchmark Minerals Lithium-Supply-Demand-Price-Forecast Q4 2025). The lithium supply forecast per resource type is presented in Figure 16.5 and per country in Figure 16.6.
Currently, Argentina has nine active lithium projects, collectively producing approximately 90,000 metric tonnes of LCE. This growth highlights Argentina's increasing role in the global lithium market as demand for critical resources continues to rise.
Lithium Argentina AG., 2026 Cauchari-Olaroz S-K 1300 Technical Report Cauchari-Olaroz Salars, Argentina | Page 356 of 418 |
Figure 16.5 Lithium Supply Forecast per Resource Type
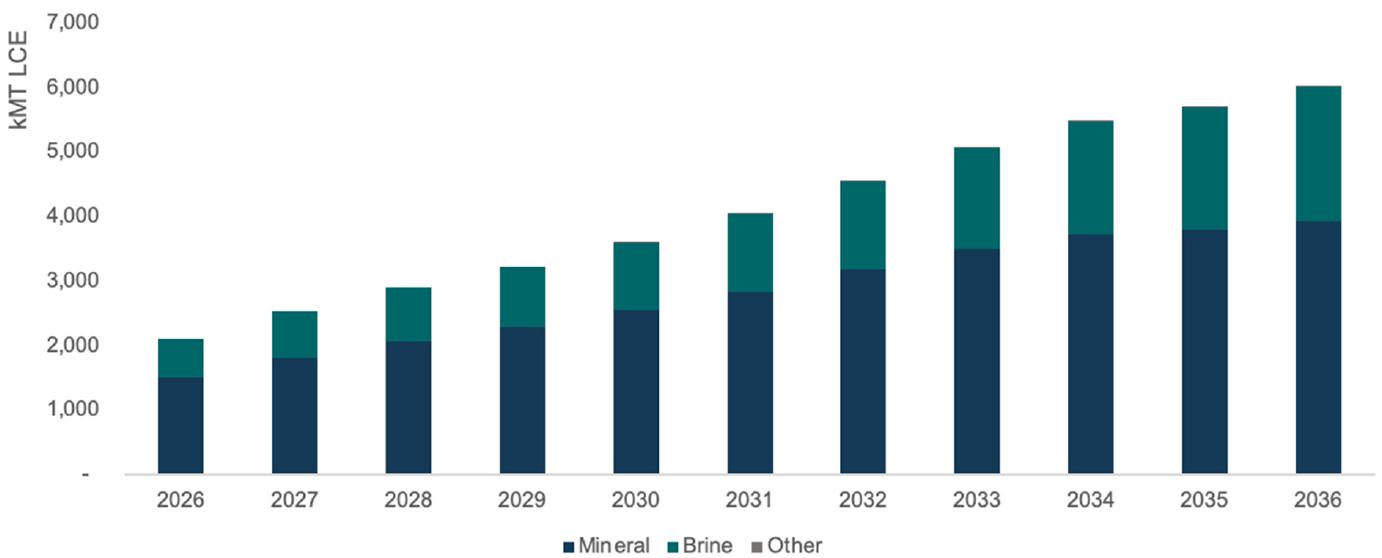
Source: Benchmark Minerals Lithium-Supply-Demand-Price-Forecast Q4 2025
Figure 16.6 Lithium Supply Forecast per Country
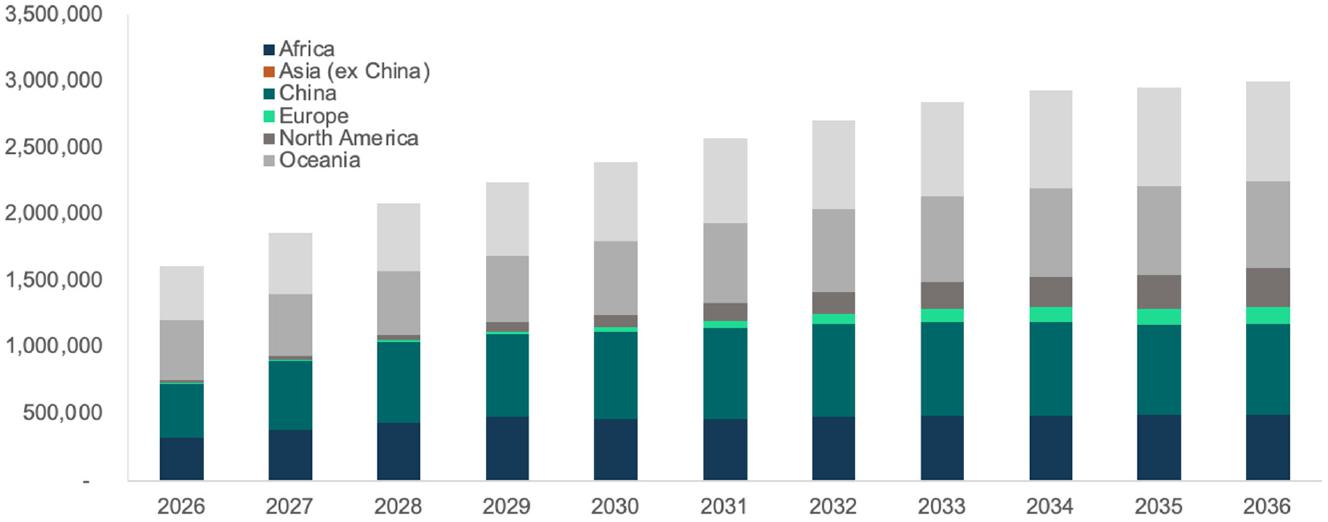
Source: Benchmark Minerals Lithium-Supply-Demand-Price-Forecast Q4 2025
Benchmark Minerals has noted that the expected market balance of lithium carbonate equivalent is expected to flip from a short-term oversupply in 2025 of ~10 kt to a medium-term relative balance between 2026 to 2029 and to a potential long term structural deficit of ~300 to 570 kt from 2030 through 2035.
Lithium Argentina AG., 2026 Cauchari-Olaroz S-K 1300 Technical Report Cauchari-Olaroz Salars, Argentina | Page 357 of 418 |
| 16.3 | Price Forecast |
As the global transition toward sustainable energy accelerates, lithium has become a critical raw material. Over the past decade, alternating periods of supply constraint and oversupply have contributed to pronounced price volatility. Lithium prices increased sharply between 2021 and 2023, briefly peaking at approximately US$80/kg, before correcting significantly and continuing to trend lower through 2024 and into 2025 as new supply entered the market and demand growth moderated outside of China. In recent months, prices have rebounded into 2026, more than doubling from cyclical lows.
More recently, market conditions have begun to reflect increased capital discipline across the industry, with high-cost projects deferred, operating curtailments implemented, and investment increasingly focused on lower-cost, scalable production. At the same time, continued investment in lithium extraction technologies, including direct lithium extraction (“DLE”), and selective capacity expansions are expected to influence the future supply-demand balance. As a result, market analysts generally anticipate a period of greater price stability over the medium term as supply rationalization and structurally growing battery demand move toward improved market balance.
A range of projected prices to 2040 is presented in Figure 16.7.
Figure 16.7 Projected Pricing for Battery-Quality Lithium Carbonate Used in Economic Model
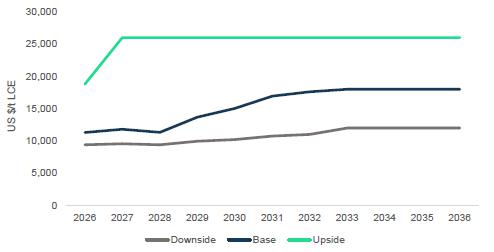
Source: Benchmark Minerals Lithium-Supply-Demand-Price-Forecast Q4 2025
Lithium Argentina AG., 2026 Cauchari-Olaroz S-K 1300 Technical Report Cauchari-Olaroz Salars, Argentina | Page 358 of 418 |
The average prices for the life of project are displayed in Table 16.1.
| Table 16.1 Average Pricing Scenarios Adopted for the Economic Analysis of the Project | ||
|
Pricing Scenarios Average price Per Tonne - Battery-Quality Lithium Carbonate | ||
| Low | Medium | High |
| US$16,000 | US$18,000 | US$20,000 |
Realized pricing for Exar is based on these price scenarios adjusted for deductions related to the removal of trace levels of impurities to achieve battery quality lithium carbonate.
| 16.4 | Offtake Contracts |
LAR's offtake entitlement is governed by an upstream sales agreement between Minera Exar S.A. (seller) and Lithium Argentina AG (buyer), under which LAR is obligated to purchase its 49% proportion of production. LAR has in turn entered into separate downstream sales agreements with Ganfeng and Bangchak for portions of that entitlement, as described below.
Production from the Project is divided between the partners of Exar according to their ownership, excluding JEMSE’s 8.5% interest (Ganfeng 51% and LAR 49%). Accordingly, LAR is entitled to 19,600 tpa of LCE based on a full production rate of 40,000 tpa. LAR has entered into lithium carbonate offtake agreements with two counterparties, Ganfeng and BCP Innovation Pte Ltd. (“Bangchak”). These offtake agreements are related to strategic investment agreements by the counterparties, which include both debt facilities for Project construction and equity investments. Assuming a 40,000 tpa production rate and LAR maintaining its 49% interest in the Project, the Ganfeng offtake agreement entitles Ganfeng to acquire 9,800 tpa of LCE (80% of 49% of the first 25,000 tpa of production) at prevailing market prices, while the Bangchak offtake agreement entitles Bangchak to acquire 6,000 tpa of LCE (20% of 49% of the first 25,000 tpa plus 46.67% of production above that rate) at prices referenced to the simple average of Shanghai Metals Market (SMM) and Fastmarkets reported prices for battery-grade lithium carbonate (99.5% min., CIF China, Japan and Korea) over a defined window prior to each export shipment, subject to adjustments for delivery location and product quality. The remaining 3,800 tpa is unallocated, subject to certain rights of Bangchak to top-up its offtake entitlement to 6,000 tpa from this unallocated amount in certain circumstances.
For clarity at a production rate of 40,000 tpa, Ganfeng is entitled to its 51% share of production (20,400 tpa) and 80% of LAR’s share of production up to 25,000 tpa (9,800 tpa) or, in aggregate, 75.5% of 40,000 tpa (30,200 tpa).
The current upstream sales agreement between Minera Exar and LAR is effective January 1 to December 31, 2026, consistent with prior annual agreements between the parties. No long-term upstream offtake agreement is currently in place.
Lithium Argentina AG., 2026 Cauchari-Olaroz S-K 1300 Technical Report Cauchari-Olaroz Salars, Argentina | Page 359 of 418 |
| 17.0 | Environmental Studies, Permitting, and Plans, Negotiations, or Agreements with Local Individuals or Groups |
| 17.1 | Executive Summary |
This section provides an overview of the environmental management, permitting, and social aspects of Cauchari-Olaroz. The Project, operated by Exar, is currently in the exploitation phase with a planned lithium carbonate production capacity of 40,000 tonnes per year. The Project has transitioned from commissioning into sustained operations during 2023-2024. It is governed by Argentina’s national and provincial regulations and aligns with international frameworks such as the Equator Principles. The chapter outlines baseline environmental studies, key permitting milestones, social impact assessments, and strategies for stakeholder engagement. Critical findings highlight stable environmental conditions, validated through operational monitoring (2024-2025), effective mitigation measures, and robust community relations.
| 17.2 | Introduction |
This chapter focuses on the environmental, permitting, and social aspects of the Cauchari-Olaroz Mining Deposit and Industrial Plant, located in the Susques Department, Jujuy Province, Argentina. Operated by Exar. The Project is currently in the exploitation stage, and has transitioned from commissioning into sustained operations, with lithium carbonate (Li2CO3) produced at a nameplate capacity of 40,000 tonnes per year (tpa). The Project's environmental management is currently governed by the Declaration of Environmental Impact (Declaración de Impacto Ambiental, DIA), issued under Resolution DMyRE No. 080/2020, which approved the biennial update of the Environmental Impact Report (Informe de Impacto Ambiental, IIA).
A new biannual update to the IIA for the period 2023-2025 has been submitted under Decree 7751-DEyP-2023 and is currently being assessed by the Authorities. Project operations continue under the approvals granted by the existing DIA and previously approved exploitation IIAs.
This chapter also aligns its assessment with the requirements of Decree No. 7751-DEyP-2023, under General Environmental Law No. 5,063. The decree, which includes Annexes I through VI as its regulatory framework, ensures the Project operates within the latest environmental guidelines, and replaces Decree No. 5772-P-2010.
Exar adhered firmly to the Equator Principles1 (EP) even before exploration operations began. These principles are a voluntary commitment, which arose from an initiative of the International Finance Corporation (IFC), member of the World Bank Group, to stimulate sustainable private sector investment in developing countries. Financial institutions that adopt these principles are bound to evaluate and consider environmental and social risks of the projects they finance in developing countries and, therefore, to lend only to those who show the proper administration of its social and environmental impacts such as biodiversity protection, use of renewable resources and waste management, protection of human health, and population movements.
In this context, Exar established from the outset that the Equator Principles would constitute the minimum standards for development of the Project. Implementation of these principles includes an explicit commitment to understanding and respecting local customs, traditions, lifestyles, and needs; compliance with applicable national standards; and the establishment of safety procedures for employees, consultants, and contractors.
1 EP: Credit risk management framework for determining, assessing and managing environmental and social risk in Project Finance transactions.
Lithium Argentina AG., 2026 Cauchari-Olaroz S-K 1300 Technical Report Cauchari-Olaroz Salars, Argentina | Page 360 of 418 |
Free and Prior Informed Consent (FPIC) is respected through the provision of timely, accessible information to nearby communities and the maintenance of ongoing, two-way communication prior to the initiation of each Project stage.
Where relationships with communities are formalized through agreements defining roles and responsibilities, these instruments are used to reduce the risk of misunderstandings regarding the presence, activities, and intentions of Exar in the Project area. Records of agreements, meetings, and negotiations are maintained as part of the Project’s stakeholder engagement framework.
Indigenous and Tribal Peoples' Rights: As defined in the ILO (International Labour Organization2), will be ratified and will respect the Indigenous and Tribal Peoples' Convention, 1989 (No. 169).
Exar commits to maintain a contract registration, records of all the meetings with communities and reports relating to negotiations with property owners.
The team responsible of keeping the proper community relationships will manage this process through specific programs and the CEO of Exar will be informed regularly and directly about them.
| 17.3 | Environmental Studies |
| 17.3.1 | Executive Summary |
Environmental studies for Cauchari-Olaroz include detailed baseline data collection on climate, air quality, noise, water quality, soil conditions, flora, fauna, limnology and cultural heritage. These baseline studies have been complemented by systematic environmental monitoring during the operational phase, including participatory monitoring campaigns conducted quarterly during 2024 and 2025, following the Project’s transition from commissioning into sustained operations during 2024-2025.
The physical and biological monitoring programmes conducted during March, June, September and December 2024, and March, June, and September 2025, demonstrate environmental conditions that are consistent with pre-operational baselines, regional climatic variability, and expected seasonal patterns characteristic of the Puna environment.
No systemic adverse trends attributable to Project operations have been identified in the monitored physical environment parameters during the reviewed period.
| 17.3.2 | Objective |
This section presents the environmental baseline studies, impact evaluation framework, and operational monitoring outcomes for Cauchari-Olaroz. The framework adheres to Argentinean provincial and national environmental standards and aligns with international best practices, including the Equator Principles, for operational stage mining projects.
2 ILO: International organization responsible for drawing up and overseeing international labour standards.
Lithium Argentina AG., 2026 Cauchari-Olaroz S-K 1300 Technical Report Cauchari-Olaroz Salars, Argentina | Page 361 of 418 |
Geology and geomorphology, hydrogeology, and hydrology are covered in Sections 6.3 to 6.5, Section 6.6 and Section 6.5 respectively.
| 17.3.3 | Baseline Studies |
| 17.3.3.1 | Sources of Baseline Data |
Environmental and social baseline data were compiled through extensive studies commissioned by Exar. Initial studies were conducted between 2010 and 2011, with regular updates and quarterly participatory monitoring from 2017 to 2025. Environmental Impact Reports (EIRs) have been periodically updated and approved to reflect evolving Project layouts and operational conditions.
Following the commencement of sustained operations during 2023-2024, the environmental dataset has evolved from a purely baseline characterization to a combined baseline and operational monitoring framework. This approach allows for temporal comparison of pre-operational, commissioning, and operational phase conditions while maintaining methodological continuity.
| 17.3.3.2 | Methods Used for Data Collection |
Monitoring during 2024 and 2025 applied the same field methodologies, analytical techniques, and QA/QC procedures established during earlier baseline campaigns, ensuring comparability across time. Monitoring campaigns were conducted across wet season, dry season, and transition periods, allowing observed variability to be interpreted within the context of natural climatic cycles typical of the high-altitude Puna environment.
| 17.3.3.2.1 | Air Quality |
Air quality monitoring confirms that particulate matter and gaseous pollutant concentrations remain within applicable guideline values. Observed variability is seasonally influenced, with higher short-term particulate levels generally associated with dry season conditions and elevated wind speeds.
Noise measurements align with the World Health Organization (WHO) guideline limits for Equivalent Continuous Sound Level (Leq) of 70 dB(A) for industrial areas. Comparisons over multiple campaigns indicate gradual reductions in ambient noise levels at some monitoring points.
| 17.3.3.2.2 | Water Quality |
Surface and groundwater quality during 2024-2025 remains consistent with historical baseline conditions. Naturally elevated concentrations of certain parameters, including boron and aluminium, persist and reflect regional geological and geochemical controls. Seasonal variability is evident, particularly during wet season campaigns, but no progressive operationally driven trends have been identified.
Lithium Argentina AG., 2026 Cauchari-Olaroz S-K 1300 Technical Report Cauchari-Olaroz Salars, Argentina | Page 362 of 418 |
| 17.3.3.2.3 | Soil Quality |
Soil monitoring confirms that soil characteristics are consistent with historical baseline conditions and expected natural variability. No evidence of soil contamination or degradation attributable to Project operations has been identified.
| 17.3.3.2.4 | Flora |
In addition to baseline vegetation monitoring, targeted diagnostic monitoring has been implemented in localized areas subject to temporary disturbance, to evaluate post-intervention regeneration dynamics. Assessments conducted during late 2024 identified variable regeneration responses across restoration zones, reflecting differences in disturbance history, substrate conditions, and species colonisation patterns. Regeneration is dominated by native pioneer and shrub species characteristic of the Puna environment.
Flora monitoring during 2024-2025 confirms the continued dominance of Puna steppe and halophytic communities. Temporal variability in species richness and reflects seasonal moisture availability rather than operational influence. Recent comparative studies highlight increased vegetation stability in disturbed areas due to restoration efforts.
| 17.3.3.2.5 | Fauna |
Baseline studies identified 57 species through direct observation and monitoring. Faunal monitoring results for mammals, reptiles, and amphibians are consistent with historical baseline conditions and expected seasonal patterns. Subsequent operational monitoring indicates no evidence of displacement, habitat loss, or operationally driven decline.
Specific attention was given to vicuñas, flamingos, and other species of conservation concern. Long-term monitoring reveals stable vicuña populations and improved Andean flamingo numbers, particularly around Vega Olaroz Chico.
| 17.3.3.2.6 | Limnology |
Limnological monitoring of high-altitude aquatic systems indicates stable ecological conditions. Biological indices derived from macroinvertebrate and planktonic communities reflect natural hydrological and physicochemical variability, with no evidence of Project related degradation.
| 17.3.3.2.7 | Cultural and Archaeological Studies |
Surveys identified 52 archaeological sites across five Project sectors, with sensitivity categorized based on potential impacts. These studies comply with Provincial Law No. 4,133/84 and National Law No. 25,743/03, which regulate the protection of archaeological and paleontological heritage.
Sites located in the West and Center West sectors exhibit medium-to-high sensitivity, with archaeological sites CV02, CV08, CV09, CV10, and CV26 classified as high sensitivity in the 2012 Environmental Impact Assessment.
No significant paleontological findings, though precautionary measures are implemented for future activities.
Lithium Argentina AG., 2026 Cauchari-Olaroz S-K 1300 Technical Report Cauchari-Olaroz Salars, Argentina | Page 363 of 418 |
Medium-to-high sensitivity archaeological sites in the West and Center West sectors require specific mitigation measures during construction and operational phases. The protection of identified cultural heritage resources aligns with national and provincial regulations.
| 17.3.3.2.8 | Ecosystem Characterization |
The Project area has a low diversity although there are some zones within it that are more diverse than others, such as shrub steppes and meadows, the Archibarca cone being the zone with the greatest biodiversity within the Project area.
Follow up fauna and flora monitoring campaigns were carried out around the pilot plant in March 2015 and in October 2016 and quarterly participatory monitoring from 2017 to 2025. Diversity results indicate that there is no significant change in the diversity parameters.
| 17.3.3.2.9 | Landscape |
In general, the fragility and visual quality of the landscape around the Project have values ranging from medium-high to medium-low, with the Cauchari-Olaroz Salt Flats landscape unit having the highest visual quality and fragility value.
Protection, correction, or mitigation of environmental impacts on the landscape, which will decrease the impact of future extractive activities, is required to preserve the current morphology of the landscape, chromatic variation, landscape perspectives as well as the preservation of the natural ecosystem. This has been covered within the context of the Environmental Impacts Report for Exploitation and is especially pertinent with respect to the height of the salt heaps and visibility of the ponds from the national and provincial roads.
| 17.3.4 | Environmental Impacts |
| 17.3.4.1 | Potential Sources of Impacts |
Potential environmental impacts arise from activities related to brine extraction, evaporation pond operations, processing plant activities, vehicle traffic, materials handling, and supporting infrastructure. The sources were identified during earlier Project phases and remain applicable under the current operational configuration of the Project.
The Project generates salts and liquid wastes during the process, mainly brines, which do not represent a contamination risk. These liquid wastes are sent to evaporation ponds, but the Project does not require a tailings dam.
| 17.3.4.2 | Impact Evaluation Framework |
Impacts are evaluated using a structured framework considering the magnitude, spatial extent, duration, frequency, reversibility, and receptor sensitivity. This framework is applied consistently across Project phases and integrates regulatory thresholds, baseline conditions, and professional judgement.
Lithium Argentina AG., 2026 Cauchari-Olaroz S-K 1300 Technical Report Cauchari-Olaroz Salars, Argentina | Page 364 of 418 |
| 17.3.4.3 | Overview of Observed Impacts |
Operational phase monitoring during 2024-2025 indicates that observed variations in physical and biological parameters are consistent with natural seasonal and inter-annual variability. No significant adverse operational impacts have been identified.
| 17.3.4.4 | Air Quality Impacts |
Air quality impacts remain low and localized, with monitored concentrations of particulate matter and gaseous pollutants remaining within guideline values and no evidence of cumulative effects.
| 17.3.4.5 | Noise Impacts |
Noise levels remain consistent with baseline and commissioning period conditions, with variations driven by short-term activities and meteorological factors.
| 17.3.4.6 | Surface Water Quality Impacts |
Surface water quality remains stable relative to baseline conditions, with seasonal variability observed during wet season periods and no operationally driven deterioration identified.
| 17.3.4.7 | Groundwater Quality Impacts |
Groundwater hydrochemistry remains consistent with baseline composition. Observed elevated concentrations of certain constituents reflect natural background conditions associated with natural salar geochemistry.
| 17.3.4.8 | Soil Quality Impacts |
Soil quality impacts remain limited a localized, with monitoring confirming baseline consistency.
| 17.3.4.9 | Biological Environment – Impact Overview |
The results of localized restoration diagnostics support the conclusion that biological impacts associated with surface disturbance are spatially limited and, in most cases, reversible. Variability in regeneration rates reflects site-specific conditions rather than systemic constraints on ecological recovery, and no evidence of broader landscape-scale biological degradation has been identified.
Biological monitoring confirms that flora, fauna, and limnological indicators remain stable, with no operationally driven adverse impacts identified.
| 17.3.4.10 | Conclusions |
Environmental impacts at Cauchari-Olaroz have been identified and are being successfully mitigated through established management and monitoring measures.
| 17.3.5 | Monitoring Programs |
As part of its adaptive environmental management framework, the Project has undertaken pilot-scale diagnostics in selected disturbed areas to inform restoration and closure planning. These activities complement the broader biological monitoring program and provide site-specific information on natural regeneration potential, species responses, and the effectiveness of passive and assisted restoration approaches.
Lithium Argentina AG., 2026 Cauchari-Olaroz S-K 1300 Technical Report Cauchari-Olaroz Salars, Argentina | Page 365 of 418 |
Findings from these diagnostics are used to refine management practices over time and do not alter the scope or objectives of the approved environmental monitoring programs.
Environmental Monitoring programmes are implemented quarterly and integrate physical and biological components. Programmes are designed to verify regulatory compliance, confirm mitigation effectiveness, and support early identification of potential operational impacts. Participatory monitoring involving nearby communities forms an integral component of the monitoring framework.
Results from the 2024-2025 monitoring campaigns confirm temporal stability of key indicators, reinforcing conclusions regarding the absence of operationally driven impacts.
| 17.3.6 | Environmental Management Plan |
| 17.3.6.1 | Purpose of the EMP |
The Environmental Management Plan (EMP) sets out in detail the measures to be implemented both in the medium and long term to prevent the negative effects or impacts generated by the Project on physical, biotic and social factors.
The actions implemented by Exar through the EMP are designed to ensure that activities are carried out in an environmentally responsible and sustainable manner during the construction, operation, closure, and post-closure phases. The EMP aims to prevent, control, and reduce the negative impacts of the Project’s activities.
Preventing impacts involves the introduction of protective, corrective, or compensatory measures. These measures may include modifications to location, technology, size, design, or materials, based on project forecasts or the incorporation of new elements.
The Environmental Management Plan is a dynamic document that is updated with each biannual renewal of the IIA for Exploitation, including updates required under Decree No. 7751-DEyP-2023. This approach allows for the inclusion of previously unaccounted aspects or adjustments to address relevant changes throughout the life of the Project. These plans provide a structured approach to achieving sustainable operations.
| 17.3.6.2 | Key Components of the EMP |
| 17.3.6.2.1 | Air Quality Management |
Reduction of emissions through improved vehicle maintenance.
Dust suppression measures, such as wetting roads and stockpiles.
| 17.3.6.2.2 | Water Management |
Protection of surface and groundwater quality through advanced treatment systems.
Strategies for water reuse and controlled discharge to minimize impact on aquatic ecosystems.
Lithium Argentina AG., 2026 Cauchari-Olaroz S-K 1300 Technical Report Cauchari-Olaroz Salars, Argentina | Page 366 of 418 |
| 17.3.6.2.3 | Waste Management |
Handling, storage, and disposal of mine waste in compliance with provincial guidelines.
| 17.3.6.2.4 | Biodiversity and Habitat Management |
Conservation strategies include habitat restoration in disturbed areas and monitoring programs for sensitive species. Biodiversity management during operations incorporates adaptive responses triggered by repeated deviations from seasonally adjusted biological indicators, rather than single-event observations.
| 17.3.6.2.5 | Noise and Vibration Control |
Noise barriers and adjusted operational schedules mitigate impacts on nearby communities and wildlife.
| 17.3.6.2.6 | Emergency Response Plans |
Comprehensive procedures for managing environmental incidents, including infrastructure failures and chemical spills have been implemented.
| 17.3.6.3 | Compliance with Regulations and Standards |
Table 17.1 identifies the Project’s compliance framework.
| Table 17.1 Compliance with Regulations and Standards | ||
| Framework/Standard | Description | Implementation Status |
| Equator Principles | International framework for assessing and managing environmental and social risks in project finance. | Fully aligned. |
| United Nations SDG 2030 | Reference framework used to align and report sustainability performance and priorities. | Integrated into sustainability reporting. |
| Argentine Global Compact Network | National platform for implementation and reporting against UN Global Compact principles. | Member since 2022; progress reporting ongoing. |
| Global Reporting Initiative (GRI) | International standard for sustainability performance disclosure and transparency. | Fully compliant. |
|
ISO 14001 (Environmental Management) |
Environmental management system standard for identifying, managing, and mitigating environmental risks. | Implemented in 2020; fully certified. |
| ISO 9001 (Quality Management System) | Quality management system standard supporting consistent processes and continuous improvement. | Implemented in 2020; fully certified. |
Lithium Argentina AG., 2026 Cauchari-Olaroz S-K 1300 Technical Report Cauchari-Olaroz Salars, Argentina | Page 367 of 418 |
| Table 17.1 Compliance with Regulations and Standards | ||
| Framework/Standard | Description | Implementation Status |
| ISO 45001 (Environmental Management) | Occupational health and safety system standard for risks prevention and worker protection. | Implemented in 2020; fully certified. |
|
ISO 26000 (Social Responsibility) |
Guidance standard addressing social responsibility principles and practices. | Embedded in corporate practices and reporting. |
| Towards Sustainable Mining (HMS) | Industry-led performance standard for responsible mining and transparent reporting. | Seven of eight protocols externally verified (2023). |
Source: Exar Sustainability Report, 2022
Exar ensures that the Environmental Management Plan (EMP) aligns with these frameworks and standards to uphold local, national, and international compliance. Regular audits and sustainability reviews further validate the company’s adherence to these principles.
| 17.3.6.4 | Monitoring and Reporting |
Ongoing environmental monitoring programs, frequently with community participation, track key parameters such as air and water quality, biodiversity, and waste management. These activities align with the Global Reporting Initiative (GRI) standards, ensuring transparency and consistency in reporting. Data collected from quarterly and biannual campaigns are not only submitted to authorities and stakeholders but also integrated into the company’s annual sustainability reports. Exar’s adherence to the Argentine Global Compact Network includes submitting regular progress updates on sustainability principles, further embedding accountability within its monitoring framework.
| 17.3.6.5 | Adaptive Management and Continuous Improvement |
The EMP is regularly updated to incorporate new data, monitoring results, and regulatory changes. Exar employs dynamic management tools such as the "Towards Sustainable Mining (HMS)" program and ISO 26000 guidelines to refine strategies and address emerging challenges. This approach ensures the Plan remains effective while reflecting evolving Project requirements, stakeholder expectations, and environmental conditions. Continuous alignment with global frameworks like the SDG 2030 Goals and ISO certifications underscores the company’s commitment to improvement and sustainable operations.
| 17.3.6.6 | Conclusions |
The monitoring programs and EMP collectively align Cauchari-Olaroz with the Argentine and Jujuy regulatory framework and international best-practice environmental stewardship.
Environmental baseline studies and operational monitoring provide a consistent and adequate basis for environmental interpretation. Results indicate that environmental conditions during the operational phase remain broadly consistent with baseline conditions and predicted behaviour, taking into account natural variability.
Lithium Argentina AG., 2026 Cauchari-Olaroz S-K 1300 Technical Report Cauchari-Olaroz Salars, Argentina | Page 368 of 418 |
Groundwater, surface water and brine systems are well characterized and continue to behave within expected ranges. Monitoring data do not indicate material off-site impacts attributable to Project operations.
Environmental impacts identified for the Project are being managed through established monitoring and management programmes. Environmental grievances raised during operations, including a specific concern related to plant lighting, are being addressed through established management and response procedures, with no evidence of broader environmental effect.
| 17.3.6.7 | Recommendations |
Existing environmental monitoring programmes should be maintained during the operational phase to ensure continuity with historical data sets and to support ongoing interpretation of environmental trends.
Integrated oversight of brine extraction, groundwater levels and water quality data should be maintained to confirm continued consistency with predicted system behaviour and baseline conditions.
Current environmental management and grievance response processes, including those addressing nuisance-type effects, should be maintained to ensure timely, documented and proportionate responses to operational phase issues.
| 17.4 | Permitting |
| 17.4.1 | Executive Summary |
Permitting processes for the Project are governed by Argentina’s national and provincial laws, with oversight from the Jujuy provincial government. Recent updates under Decree No. 7751-DEyP-2023 have modernized permitting standards, including enhanced consultation protocols, new closure planning, and staged financial assurance requirements for closure, which are addressed in Section 17.6. The Project’s permits for exploration and exploitation activities are in full compliance, with biannual updates submitted as required. Table 17.2 identifies the key permitting milestones.
| Table 17.2 Summary of Key Permitting Milestones | ||
| Permit Type |
Date Approved |
Key Updates |
| Exploration | August 2009 (initial) | Regular biannual updates reflecting new activities. |
| Exploration | December 2021 | Update to Environmental Impacts Report for Exploration |
| Exploitation |
November 2012 (initial) |
Expanded production capacity and operational adjustments. |
| Exploitation | May 2025 | Biannual Environmental Impacts Report for Exploitation |
| Water Use |
December 2020 (160 L/s) North |
160 L/s from 6 to 8 wells near Rosario River |
Lithium Argentina AG., 2026 Cauchari-Olaroz S-K 1300 Technical Report Cauchari-Olaroz Salars, Argentina | Page 369 of 418 |
An additional water concession permit for a further 160 L/s from the south of the basin, for the exploitation phase for a 40-year term, was submitted in March 2024 and is currently under evaluation. The provincial water resources department (DPRH) granted authorization to drill exploration wells in the south of the basin. After drilling the wells, and with the results obtained from the tests, DPRH will have to be notified again to complete the permit requirements and obtain the permit to use this industrial water. This water permit is not required for current operations.
| 17.4.2 | Legal Framework |
The legislative context for exploration and exploitation environmental permits for Cauchari-Olaroz is defined by Argentina's national and provincial mining and environmental laws. At the national level, Law No. 24,585, known as the Environmental Protection for Mining Activities Act, provides the framework for assessing and managing environmental impacts associated with mining. This law mandates that mining projects must submit an Environmental Impact Assessment (EIA) before commencing activities, and it ensures the application of stringent environmental protection measures throughout the lifecycle of a project.
Natural resources are under the jurisdiction of the provinces as per the Argentinean National Constitution. While the Mining Code is enacted by the National Congress, permitting and jurisdictional authority resides with the provincial governments. Consequently, the Province of Jujuy holds the authority for significant permits concerning the construction and operation of the Project.
| 17.4.2.1 | Permits for Exploration |
Exploration permits require the submission of an Environmental Impacts Report (“IIA”), which details the scope of proposed exploration activities and their potential environmental impacts. The Provincial Government of Jujuy, through the Mining and Energy Resource Directorate, reviews and approves these reports. The Directorate coordinates with other provincial offices, such as the Provincial Directorate of Water Resources and the Environmental Ministry, to ensure compliance with applicable regulations. These permits require biannual updates.
| 17.4.2.2 | Permits for Exploitation |
Exploitation permits build upon the exploration phase by requiring a more detailed Environmental Impacts Report (“DIA”), which must address long-term operational and environmental management plans. The approval process involves multiple provincial entities, including the Environmental Ministry and the Secretariat of Tourism and Culture, which oversees permits for activities in areas of archaeological or paleontological interest. These permits require biannual updates to reflect changes in project design, such as expansions in production capacity or relocation of key facilities.
| 17.4.2.3 | Recent Legislation Updates |
On February 11, 2023, the Provincial Executive Government of Jujuy issued Decree No. 7751-DEyP-2023 (the "Decree"), which regulates the General Environmental Law No. 5063 and comprehensively updates provincial environmental protection norms for mining activities. This Decree replaces Decree No. 5772/2010, previously governing this domain.
Lithium Argentina AG., 2026 Cauchari-Olaroz S-K 1300 Technical Report Cauchari-Olaroz Salars, Argentina | Page 370 of 418 |
The Decree aims to optimize and modernize the Environmental Impact Assessment (EIA) process for mining projects to foster investment opportunities, environmental protection, and social development, particularly for lithium extraction projects.
Key aspects of the Decree are detailed in Table 17.3.
| Table 17.3 Key Aspects of Decree No. 7751-DEyP-2023 | |
| Key Aspect | Details |
| Exclusions | Activities related to hydrocarbon extraction, ancillary works outside concession areas, and industrial plants over 100 km from deposits are excluded. |
| Responsible Authorities | The Ministry of Economic Development and Production of Jujuy, in coordination with the Ministry of Environment and Climate Change, enforces the Decree. |
| UGAMP's Role | The Provincial Mining Environmental Management Unit (UGAMP) advises the Provincial Directorate of Mining on Environmental Impact Reports. |
| Categorization | Mining projects are classified into five categories: (i) social mining, (ii) initial prospecting/exploration, (iii) advanced exploration, (iv) small-scale exploitation, (v) medium- and large-scale exploitation. |
| Review Deadlines | EIAs evaluation timeframes: 40 days for initial exploration, four months for advanced exploration and small-scale exploitation, six months for medium- and large-scale exploitation. |
| Validity of DIAs | Declarations of Environmental Impact (DIAs) are valid for two years and require updates thereafter. |
| Consultation Processes | EIAs must include consultations with indigenous communities and surface owners within the area of direct influence, alongside a public consultation process via the Provincial Directorate of Mining's website. |
| Mine Closure Standards | Mandatory minimum guidelines for mine closure processes are established. |
| Sanctions | Incremental penalties for non-compliance include warnings, fines, temporary closures, and operator disqualification. |
| Environmental Violations Registry | A Provincial Registry of Environmental Mining Violators is created to track infractions and recurrences, issue certifications, and share information with other provincial departments. |
| 17.4.3 | Framework Legal Study |
The permitting process for Cauchari-Olaroz has been supported by a comprehensive legal framework study carried out early in the exploration phase. This study encompassed international, national, and provincial norms and standards relevant to the environmental and operational aspects of the Project. At the national level, the Environmental Protection Act for Mining Activity No. 24,585 provides the foundational guidelines for environmental management. At the provincial level, Jujuy’s General Environmental Law, recently updated by Decree No. 7751-DEyP-2023, details the specific procedures and standards for compliance. This decree, which came into effect on February 17, 2023, replaces Decree No. 5772/2010. It introduces revised requirements for Environmental Impact Assessments (EIAs) and refines the stages, requirements, and content of applications for exploration and exploitation permits. The decree also formalizes the interaction with surface rights holders, ensuring a more structured framework for prospection, exploration, and mining activities in the province.
Lithium Argentina AG., 2026 Cauchari-Olaroz S-K 1300 Technical Report Cauchari-Olaroz Salars, Argentina | Page 371 of 418 |
The framework legal study is operationalized through a digital legal compliance matrix implemented via the TERV platform, updated on a monthly basis, which supports the alignment of Project permitting activities with the responsibilities and oversight requirements of the relevant state institutions, including the Provincial Department of Mines and Energy and the Directorate of Mining.
| 17.4.4 | Exploration Phase Permits for Project |
The Environmental Impacts Report ("IIA") for the exploration phase of Cauchari-Olaroz was first approved by the Provincial Government of Jujuy (Dirección Provincial de Minería y Recursos Energéticos) under Resolution No. 25/09 on August 26, 2009. Key updates and approvals include:
| · | 2011 Update: Resolution No. 29/2012 approved on November 8, 2012, covering activities for the 2012–2013 period. |
| · | 2014 Addendum: Resolution No. 011/2014 approved on July 15, 2014, for the installation and operation of a pilot lithium phosphate plant. |
| · | 2017 Update: Resolution No. 008/2017 approved on September 19, 2017, replacing prior updates and encompassing planned exploration activities, including seismic reflection, hydrogeological studies, pond construction, and geochemical sampling. |
| · | 2020 Update: Approved by Resolution No. 017/2021 on December 17, 2021, reflecting exploration activities conducted from 2019–2021. |
| · | 2024 Update: Submitted in March 2024 and approved by February 2026, focusing on drilling new brine wells and conducting vertical electrical surveys in the southern Project area; approval is pending. |
The next biannual update to the IIA for Exploration permit is programmed for 2026.
A complete listing of the IAA for Exploitation permits is given in Table 17.4.
| Table 17.4 Exploration Permits | |||
| Report Submitted | Date Approved |
Approvals | Observations |
| Environmental Impacts Report for Exploration (IIA Exploration) | August 2009 | Resolution No. 25/09 | Original exploration permit for the Project. |
| Environmental Impacts Report for Exploration (AIIA Exploration 2011) | November 2012 | Resolution No. 29/2012 | Activities for the 2012–2013 period approved. |
| Addendum to Environmental Impacts Report for Exploration, Posco Pilot Plant | July 2014 | Resolution No. 011/2014 | Pilot lithium phosphate plant installation approved. |
Lithium Argentina AG., 2026 Cauchari-Olaroz S-K 1300 Technical Report Cauchari-Olaroz Salars, Argentina | Page 372 of 418 |
| Table 17.4 Exploration Permits | |||
| Report Submitted | Date Approved |
Approvals | Observations |
| Update to Environmental Impacts Report for Exploration | September 2017 | Resolution No. 008/2017 | Comprehensive update for exploration activities. |
| Update to Environmental Impacts Report for Exploration 2019 -2021 | December 2021 | Resolution No. 017/2021 | Reflecting ongoing exploration activities, 2019–2021. |
| Update to Environmental Impacts Report for Exploration 2021 - 2023 | December 2021 | Resolution No. 017/2021 | The authorities established that the same approving resolution be maintained in the current bi-annual renewal because the activities in this report correspond to the same ones from the previous renewal. |
| Update to Environmental Impacts Report for Exploration 2023 - 2025 | February 2026 | Resolution No. 028/2026 |
Includes drilling new brine wells and vertical electrical surveys focused on the southern area of the salt flat. |
| 17.4.5 | Exploitation Phase Permits for Project |
The IIA for exploitation was initially approved under Resolution No. 29/2012 on November 8, 2012, for an annual production of 20,000 tonnes of lithium carbonate. Key updates include:
| · | 2017 Biannual Update: Incorporated new environmental studies and increased production in phases, first to 25,000 tpa and then to 40,000 tonnes per year; approved in October 2017. |
| · | 2023 Biannual Update: A biannual update submitted in March 2023 is under review, with activities detailed for ongoing operations. |
The next biannual update to the IIA for Exploitation permit is programmed for 2027.
A complete listing of the IAA for Exploitation permits is given in Table 17.5.
| Table 17.5 Exploitation Permits | |||
| Report Submitted | Date Approved | Resolution | Key Updates |
| Environmental Impacts Report for Exploitation (IIA Exploitation 2011) | November 2012 | Resolution No. 29/2012 | 20,000 tpa production capacity. |
Lithium Argentina AG., 2026 Cauchari-Olaroz S-K 1300 Technical Report Cauchari-Olaroz Salars, Argentina | Page 373 of 418 |
| Table 17.5 Exploitation Permits | |||
| Report Submitted | Date Approved | Resolution | Key Updates |
| Biannual Environmental Impacts Report for Exploitation (AIIA Exploitation March 2015) | March 2015 | Update cancelled and filed: DMyRE Note No. 101/2019 | Biannual update of the Environmental Impacts Report (AIIA) approved in 2012, based on the same project approved in 2012. |
| Biannual Environmental Impacts Report for Exploitation (AIIA Exploitation February 2017) | October 2017 | Resolution No. 010/17 | Increased production to 25,000 tpa lithium carbonate, with a second expansion to 40,000 tpa, and layout adjustments. |
| Biannual Environmental Impacts Report for Exploitation (AIIA Exploitation 2019) | December 2020 | Resolution No. 080/2020 | Detailed ongoing exploitation activities. |
| Biannual Environmental Impacts Report for Exploitation (AIIA Exploitation 2021) | April 2022 | Resolution No. 103/2025 | Initially included modifications for an expansion of production. This expansion request was subsequently retracted by the company, leaving the AIIA Exploitation 2021 activities as per AIIA Exploitation 2019. |
| Biannual Environmental Impacts Report for Exploitation (AIIA Exploitation 2023) | December 2023 (submitted) | Pending |
The AIIA 2023 was presented to respect the bi-annual submission requirement, although the authority has not issued a permit for the previous (AIIA Exploitation 2021) report. Changes were added that are intended to be made with respect to ponds and the harvesting of salts. Update submitted under Decree No. 7751-DEyP-2023 |
| Biannual Environmental Impacts Report for Exploitation (AIIA Exploitation 2025) | 18 December 2025 (submitted) | Pending | |
| Environmental impact report for expansion to 85.000 tonnes/year. | December, 2025 | Pending | Environmental impact report for new expansion plant with DLE technology presented |
Lithium Argentina AG., 2026 Cauchari-Olaroz S-K 1300 Technical Report Cauchari-Olaroz Salars, Argentina | Page 374 of 418 |
| 17.4.6 | Water Permits |
| · | A Water Use Permit was issued for 45 L/s for exploration purposes and is active. |
| · | A Permanent Water Concession was granted for 160 L/s from the Rosario River area for the exploitation phase was granted and is active. |
| · | A Permanent Water Concession for a further 160 L/s from the south of the basin, for the exploitation phase, is currently under evaluation. Current operations are not dependent on approval of this additional concession. |
| · | Fees for water extraction from brackish sources have been paid through 2023, with annual renewals ongoing. |
A complete listing of the water permits and concessions is given in Table 17.6.
| Table 17.6 Industrial Water Permits and Concessions for Cauchari-Olaroz | ||||
| Report Submitted |
Date Submitted |
Date Approved |
Validity Term |
Observations |
| Water Use Permit (45 L/s) | December 2017 | 06 June 2020 | Exploration | Authorized abstraction of up to 45 L/s, comprising 25 L/s from the PBI well and 20 L/s from three wells near the Rosario River. |
| Permanent Water Concession (160 L/s) NORTH | December 2020 | 28 December 2020 | 40 years | Permanent industrial water concession authorizing abstraction of up to 160 L/s from six to eight wells near the Rosario River |
| Permanent Water Concession (160 L/s) SOUTH | March 2024 | Pending | 40 Years | The provincial water resources department (DPRH) has authorized the drilling of exploration wells in the southern sector of the basin. Exploration well drilling has not yet commenced. Upon completion of drilling and hydraulic testing, results must be submitted to DPRH to support completion of the permitting process and potential granting of the industrial water use concession. |
Lithium Argentina AG., 2026 Cauchari-Olaroz S-K 1300 Technical Report Cauchari-Olaroz Salars, Argentina | Page 375 of 418 |
| 17.4.7 | Provincial Regulations |
Jujuy’s environmental permitting processes are governed by the recently updated General Environmental Law No. 5063, as regulated by Decree No. 7751/2023. This decree replaces the earlier Decree No. 5,772/2010 and modernizes the Environmental Impact Assessment (EIA) requirements for mining activities. Key updates include:
| · | Expanded Authority: The Ministry of Economic Development and Production of Jujuy, in coordination with the Ministry of Environment and Climate Change, now oversees the permitting process. |
| · | Categorization of Projects: Mining projects are classified into five categories, ranging from social mining to large-scale exploitation, with differentiated EIA requirements and review timelines. |
| · | Consultation Requirements: EIA procedures now mandate consultations with indigenous communities and surface rights holders in the direct area of influence, alongside public consultations via the Provincial Directorate of Mining's online platform. |
| · | Mine Closure Standards: The decree establishes minimum mandatory guidelines for mine closure and reclamation processes. |
Additionally, mining projects within the Cauchari-Olaroz Salar must adhere to its designation as a Protected Area for Multiple Use, requiring permits for activities that may affect archaeological or paleontological resources.
| 17.4.8 | Compliance Documentation |
All permits align with local, regional, and national regulations:
| · | Regular environmental monitoring ensures compliance with provincial standards for air, water, and soil quality, as established under relevant laws. |
| · | Quarterly participatory monitoring programs validate adherence to environmental baselines, with documented updates presented to regulatory authorities. |
| 17.4.9 | Permit Risks |
Potential risks to operations include:
| · | Approval Delays: Pending updates for the 2024 Exploration and 2023 Exploitation IIAs could impact the initiation of planned activities. |
| · | Regulatory Changes: Changes in provincial or national mining laws necessitate adjustments to compliance strategies. The recent introduction of Decree No. 7751/2023 highlights a significant shift in regulatory requirements. The Project should assess potential impacts of the updated Environmental Impact Assessment process, including enhanced consultation protocols, and the mandatory mine closure guidelines, and the regulatory response to the latest 2023-2025 AII update, which is aligned with the new decree. |
Lithium Argentina AG., 2026 Cauchari-Olaroz S-K 1300 Technical Report Cauchari-Olaroz Salars, Argentina | Page 376 of 418 |
| 17.5 | Social or Community Impact |
| 17.5.1 | Executive Summary |
Cauchari-Olaroz has moved from a construction-led social context into a sustained operational phase during 2023-2024. This transition has altered both the scale and the character of social interaction, shifting emphasis away from transient construction impacts towards longer-term employment, procurement, institutional engagement, and community participation.
This section draws on three principal sources: (i) the social baseline re-characterization presented in the AIIA 2025-2027; (ii) documented outcomes in the 2025 Community and Institutional Relations programme; and (iii) an analytical interpretation of how current engagement practices align with internationally recognized co-creation and life-of-mine social management principles.
On this basis, social impacts are considered manageable and, in some areas, demonstrably positive, subject to the continued implementation and adaptive management of existing employment, procurement, participation, and grievance mechanisms.
| 17.5.2 | Social Baseline Context and Re-Characterization – Operations Phase |
The social baseline for the Project was first established during the exploration phase in 2011, when systematic baseline studies were undertaken to characterize demographic, socio-economic, institutional, and cultural conditions within the Project’s area of influence prior to large-scale development.
Subsequent baseline updates, including those incorporated into the AIIA 2025-2027, do not redefine the baseline in methodological terms. Rather, they provide an updated description of the prevailing social conditions using data appropriate to the operational phase, while maintaining a clear distinction between baseline characterization and impact assessment.
Within this framework the AIIA 2025-2027 provides an updated description of socio-economic and institutional conditions prevailing during the early operational phase within the Project’s areas of direct and indirect influence, comprising the communities of Susques, Huáncar, Pastos Chicos, Puesto Sey, Catua, Olaroz Chico, and El Toro, all located within the Susques Department, Jujuy Province.
This approach recognizes that social conditions evolve over time due to a combination of regional, institutional, and economic factors, and avoids attributing observed changes a priori to Project activities.
| 17.5.3 | Evaluation of Social Impacts – Operations Phase |
Social impacts at the operational stage differ in both character and persistence from those associated with exploration and construction. Short-term, transient effects have largely been replaced by longer-term interactions linked to employment stability, local economic participation, institutional engagement, and service demand. The principal impact pathways are outlined in the subsections listed below.
Lithium Argentina AG., 2026 Cauchari-Olaroz S-K 1300 Technical Report Cauchari-Olaroz Salars, Argentina | Page 377 of 418 |
| 17.5.3.1 | Employment and Workforce Integration |
The construction phase (2018-2021) generated a peak workforce of approximately 3,300 personnel, resulting in short-term demographic and service pressures that are no longer present under operational conditions.
Under steady-state operations, the Project employs approximately 644 direct workers and is estimated to support a further 1,300 indirect jobs through service provision, logistics, and associated supply chains.
Of the direct workforce, 198 employees (approximately 31%) are drawn from surrounding communities, indicating a material level of workforce localization for a remote, technically specialized operation.
Recruitment policy gives preference to candidates from within the Project’s area of influence. Given the relative novelty of lithium brine operations in Jujuy Province, this approach has been supported by targeted training and capacity building initiatives designed to address identifiable skills requirements associated with specialized lithium brine operations.
A central element of this approach is the Ckuri School, established to build local technical capacity. Initial enrollment of 132 participants in 2022 increasing to approximately 198 participants by early 2026, reflecting progressive uptake rather than short-term training demand.
Where operational requirements cannot be met locally, personnel are recruited from outside the province, consistent with industry practice for specialized functions in emerging technical sectors.
Residual social risks relate primarily to the alignment of long-term employment expectations management, career progression, and intergenerational demand for employment within neighbouring communities. These risks are typical of long-life operations, and are addressed through communication, workforce planning, and continued investment in training pathways.
| 17.5.3.2 | Local Procurement and Economic Inclusion |
Operational procurement represents a sustained source of local economic participation. In 2025, 38 community-based suppliers were active, with local procurement expenditure increasing by approximately 46% relative to 2024.
The progressive transfer of defined service categories (including transport, vehicle hire, and logistics) to community providers has contributed to enterprise consolidation and reduced reliance on direct company provision.
| 17.5.3.3 | Community Relations and Participation |
Operational-phase engagement is characterized by regular dialogue mechanisms, participatory environmental monitoring, and structured assemblies, which together support transparency and early issue identification.
During 2025, four participatory monitoring campaigns were conducted, involving a total of 45 community monitors.
Lithium Argentina AG., 2026 Cauchari-Olaroz S-K 1300 Technical Report Cauchari-Olaroz Salars, Argentina | Page 378 of 418 |
| 17.5.3.4 | Grievances and Social Risk Management |
The Community Attention System recorded 13 grievances during 2025, representing a reduction of approximately 48% relative to 2024.
Reported issues relate primarily to payment timing, plant lighting, and information gaps. These matters fall within the scope of existing management procedures and do not indicate systemic social risk.
| 17.5.3.5 | Cultural and Social Cohesion |
Support for cultural events and ceremonies, including Pachamama-related activities, has continued during operations and contributes positively to the maintenance of social cohesion and cultural continuity.
No material adverse impacts on cultural practices or community cohesion have been identified during the operational phase beyond those addressed through existing management mechanisms.
| 17.5.4 | Social Impact Management and Transition to Operations |
Social impact management during operations is implemented through a set of structured programmes aligned with provincial regulatory requirements and relevant international standards, including IFC Performance Standards, ILO Convention 169, and the Equator Principles.
| · | Community Relations and Institutional Engagement Programmes: Community relations activities are planned and reviewed on an annual basis, with increasing emphasis on predictability, transparency, and coordination with provincial and local institutions. |
| · | Grievance Mechanism: A formal grievance mechanism is maintained, with documented procedures and evidence of declining complaint volumes over recent reporting periods. |
| · | Local Employment and Training: Employment and training programmes focus on progressive skills development, leadership capacity, and completion of formal education pathways where required. |
| · | Local Procurement Strategy: Procurement engagement with community suppliers is supported through structured contracting and payment mechanisms intended to support enterprise stability. |
Taken together, these measures support the transition from construction-phase social management towards a more stable operational framework, with increasing emphasis on predictability, institutional articulation, and long-term social risk management.
Lithium Argentina AG., 2026 Cauchari-Olaroz S-K 1300 Technical Report Cauchari-Olaroz Salars, Argentina | Page 379 of 418 |
| 17.5.5 | Integration of Community Co-Creation Principles and Social Closure |
Current community relations practices reflect a gradual shift away from assistance-based engagement towards greater shared responsibility and participation. This shift is consistent with the requirements of a long-life operation and with emerging good practice in life-of-mine social management.
Key features of this approach, as evidenced in current programmes and outcomes, include:
| · | Participatory governance through regular inter-community dialogue mechanisms; |
| · | Community-led and co-financed development initiatives; |
| · | Leadership development and targeted capacity-building programmes; and |
| · | Increasing emphasis on institutional articulation beyond the Project. |
Perception surveys conducted since 2023 indicate measurable improvements in community perceptions of both mining activity and engagement processes, suggesting increasing legitimacy of participatory mechanisms.
From a technical standpoint, the progressive application of these principles contributes to closure readiness by strengthening local institutional capacity and reducing long-term dependency on company-led interventions.
| 17.5.6 | Conclusions |
The updated assessment confirms that the Project has successfully transitioned into an operations-phase social management model characterised by stability, predictability, and increasing community co-ownership of development processes. Social risks are considered moderate and manageable, with positive impacts dominating, particularly in employment, local economic participation, and institutional strengthening.
The integration of co-creation and shared-responsibility principles represents a material improvement over prior engagement models and is considered consistent with international good practice for lithium brine operations operating in Indigenous and high-sensitivity contexts. Continued implementation and adaptive management of these programs are critical to maintaining social licence to operate and supporting eventual social closure objectives.
| 17.6 | Closure and Reclamation Plans |
Closure and reclamation for the Project have followed legislative requirements and best practice guidance. The legislative requirements for the closure of the Project were outlined in Decree No. 5772-P-2010 until 17 February 2023, when it was replaced by Decree No. 7751-DEyP-2023. This transition introduced more comprehensive and structured guidelines, particularly emphasizing financial assurance and progressive closure measures.
A Conceptual Closure Plan for the Project was updated in December 2025 to align with the requirements of Decree No. 7751-DEyP-2023 and to reflect the current Project configuration and operational status.
As part of progressive closure planning, the Project has undertaken site-specific diagnostic evaluations of vegetation regeneration in selected areas subject to temporary disturbance. These evaluations provide empirical information on natural recovery mechanisms, species responses, and the relative effectiveness of passive and assisted restoration approaches under site conditions.
Lithium Argentina AG., 2026 Cauchari-Olaroz S-K 1300 Technical Report Cauchari-Olaroz Salars, Argentina | Page 380 of 418 |
Findings from these diagnostics are used to inform the refinement of rehabilitation and closure strategies over time and support adaptive management under the Conceptual Closure Plan. Detailed results are documented in the internal restoration diagnostic report (Informe de Áreas de Restauración, 2025), which supports closure planning but does not constitute a final closure performance assessment.
All future IIA submissions for the Project are required to comply with the new legislation.
| 17.6.1 | Key Closure Requirements and Commitments (Pre-2023) |
Before 2023, the Project developed its strategy for closure based on the aspects listed in the subsections below.
| 17.6.1.1 | Closure Objectives |
| 1. | The Project’s closure objectives focused on meeting all regulatory requirements outlined in agreements signed by Exar to achieve the Final Closure of the Project. |
| 2. | Emphasis was placed on preventing, minimizing, or mitigating negative environmental impacts throughout the closure process. |
| 3. | The site’s abandonment condition aimed to protect the environment and ensure public safety. |
| 4. | The closure process aimed to uphold the social license by fostering trust and transparency with affected communities and stakeholders. This included aligning closure activities with social expectations and addressing concerns through proactive engagement with local and indigenous groups. |
| 5. | Strategies for mine site reclamation and rehabilitation included the removal of roads, the evaporation to dryness of ponds, and the leveling and contouring of pond sites. The physical stability of pond slopes was also established. |
| 6. | Closure activities were primarily planned for the end of the 40-year Life of Mine (LoM) operation phase, with some activities potentially conducted during operations (progressive closure). This included aligning closure activities with social expectations and addressing concerns through proactive engagement with local and indigenous groups. |
| 17.6.1.2 | Financial Assurance |
Estimated closure and remediation costs were included in the Project's cash flow model to meet environmental and closure obligations outlined in the Informe de Impacto Ambiental (IIA). This ensured compliance, despite the lack of closure bonding or guarantees required under Argentine federal or Jujuy provincial legislation prior to 2023.
Lithium Argentina AG., 2026 Cauchari-Olaroz S-K 1300 Technical Report Cauchari-Olaroz Salars, Argentina | Page 381 of 418 |
| 17.6.1.3 | Post-Closure Monitoring |
Post-closure monitoring was planned to continue for about five years following the end of operations, including a two-year period for executing closure activities and an additional three years for environmental monitoring. This approach ensured the Project achieved definitive closure.
| 17.6.2 | New Requirements (Decree No. 7751-DEyP-2023) |
The legislative changes introduced by Decree No. 7751-DEyP-2023 require the Project to align with a more structured and detailed closure framework as listed in the subsections below.:
| 17.6.2.1 | Closure Objectives |
| 1. | Closure must include the rehabilitation or repurposing of all areas and infrastructure affected by mining activities, except for those identified as suitable for public or social use by indigenous communities, local municipalities, or the provincial government. Transfers of such areas must comply with environmental criteria evaluated by the Dirección Provincial de Minería or the Ministry of Environment and Climate Change. |
| 2. | Social objectives must include collaborating with indigenous and local communities to ensure areas and assets can be utilized for social and public benefit where applicable, fostering transparency and trust throughout the closure process. |
| 3. | Provisions for progressive closure measures must be integrated into the conceptual closure plan to enable rehabilitation during operational phases without disrupting ongoing activities. |
| 4. | Plans for temporary or premature mine closures must include maintenance and monitoring protocols, with a maximum suspension period of three years unless extended by a formal resolution. |
| 17.6.2.2 | Financial Assurance |
| 1. | A financial guarantee is mandatory to secure compliance with closure plans, covering direct and indirect closure costs, including contingencies, with phased implementation as specified by the Decree. |
| 2. | The guarantee's phased implementation includes: |
| o | 10% of the closure cost during the first year of construction. | |
| o | 20% during the first year of operation. | |
| o | Full guarantee coverage by the final third of the mine's life or five years before closure, whichever comes sooner. |
In accordance with these requirements, Minera Exar S.A. has prepared and submitted a financial guarantee proposal based on the updated Conceptual Closure Plan.
The proposed financial assurance mechanism and its phasing are subject to review and approval by the provincial authority.
Lithium Argentina AG., 2026 Cauchari-Olaroz S-K 1300 Technical Report Cauchari-Olaroz Salars, Argentina | Page 382 of 418 |
| 3. | Adjustments to financial assurances are required with each update to the closure plan, and partial reductions may be granted for completed closure milestones. |
| 4. | The Conceptual Closure Plan updated in December 2025 includes an updated estimate of total closure and post-closure costs of approximately US$86 million on an undiscounted basis. |
This estimate reflects the scope of dismantling, site restoration, revegetation, contingencies, and post-closure monitoring defined in the Conceptual Closure Plan and submitted to the provincial authority in accordance with Decree No. 7751-DEyP-2023.
| 17.6.2.3 | Post-Closure Monitoring |
| 1. | A mandatory post-closure phase begins after the issuance of a "Certificate of Final Compliance" and extends for a minimum of five years for medium- and large-scale projects. This period may be extended based on environmental needs. |
| 2. | Annual post-closure reports must document monitoring results, environmental and social trends, and maintenance activities, guiding evaluations of closure objectives and certification issuance. |
| 3. | Following successful post-closure activities, the financial guarantee is released, and a "Certificate of Final Closure" is issued. |
Lithium Argentina AG., 2026 Cauchari-Olaroz S-K 1300 Technical Report Cauchari-Olaroz Salars, Argentina | Page 383 of 418 |
| 18.0 | Capital and Operating Costs |
Capital costs for the Project are based on the total engineering and construction work.
All values are expressed in current US dollars; the exchange rate between the Argentine peso were adjusted at the time of the incurred cost. Argentine peso denominated costs followed the exchange rate because of inflation, and the impact of the exchange rate fluctuation on CAPEX and OPEX has been incorporated in the definition of the cost presented in this section; no provision for currency escalation has been included. At the completion of the Project, the CAPEX was consolidated at US$979 million.
| 18.1 | Capital Costs (CAPEX) Estimate |
The main objectives for determining the capital costs for the full plant are:
| · | Present the total project CAPEX for investment consolidation purposes. |
| · | Confirm cost of the processes and facilities that are operating during the ramp up period to obtain the best comparison between initial and actual capital costs and operating costs. |
| · | Providing the necessary data for the economic evaluation of the project; and |
| · | Providing guidance for the following production phase. |
| 18.1.1 | Capital Expenditures CAPEX Definition |
Capital costs for the Project are based on the total engineering and construction work, having a design capacity of 40,000 tonnes per year of lithium carbonate equivalent. The expenditures are expressed in current US dollars.
Capital costs include direct and indirect costs for:
| · | Brine production wells; | |
| · | Evaporation and concentration ponds; | |
| · | Lithium carbonate plant; | |
| · | General areas, such as electric, gas and water distribution; | |
| · | Stand-by power plant, roads, offices, laboratory and camp, and other items; | |
| · | Off-site Infrastructure, including gas pipeline and high voltage power line; and | |
| · | Contingencies, salaries, construction equipment mobilization, and other expenses. |
Lithium Argentina AG., 2026 Cauchari-Olaroz S-K 1300 Technical Report Cauchari-Olaroz Salars, Argentina | Page 384 of 418 |
The capital investment for the 40,000 tpa Lithium Carbonate Cauchari-Olaroz, including equipment, materials, indirect costs and others during the construction period was US$979 million. This excludes debt interest expense capitalized during the same period. Disbursements of these expenditures are summarized in Table 18.1 and the costs for the production wells are presented on Table 18.2.
| Table
18.1 Lithium Carbonate Plant Capital Costs Summary | |
| Item |
Cost (US$ M) |
| Direct Cost | |
| Salar Development | 51.0 |
| Evaporation Ponds | 175.5 |
| Lithium Carbonate Plant and Aux. | 361.7 |
| Reagents | 26.2 |
| On-site Infrastructure | 108.7 |
| Off-site Services | 13.6 |
| Total Direct Cost | 736.7 |
| Indirect Cost | |
| Total Indirect Cost | 224.5 |
| Total Direct and Indirect Cost | |
| Total Direct and Indirect | 961.2 |
| Other (1.85%) | 17.8 |
| Total Capital | 979 |
| Expended to date | 979 |
| Estimate to complete | 0 |
| Table 18.2 Production Wells Capital Cost | |
| Description |
Total Project Budget (US$ M) |
| Well pumps and auxiliaries | 46.2 |
| Power Distribution | 4.8 |
| Total | 51.0 |
| 18.1.2 | Evaporation Ponds |
The capital cost for the evaporation and concentration pond facilities is US$175.5 million (Table 18.3).
| Table 18.3 Evaporation and Concentration Ponds Capital Cost | |
| Description |
Total Projected Budget (US$ M) |
| Ponds | 172.1 |
| Power distribution | 3.3 |
| Total | 175.5 |
Lithium Argentina AG., 2026 Cauchari-Olaroz S-K 1300 Technical Report Cauchari-Olaroz Salars, Argentina | Page 385 of 418 |
| 18.1.3 | Lithium Carbonate Plant |
The direct cost for the construction of the Lithium Carbonate plant is US$361.7 million (Table 18.4). During engineering work, capital equipment costs were estimated using more than 100 quotes for various equipment items and construction contracts, estimates and using in-house data for minor items. As of the effective date of this report, all of the equipment purchase orders have been executed as well as construction contracts, validating the total construction of the plant. The initial material take-off (e.g. material quantity estimates) from 3-D models were confirmed during the construction phase to complete the capital cost.
| Table 18.4 Lithium Carbonate Plant Capital Cost Summary | |
| Description |
Total Projected Budget (US$ M) |
| Lithium Carbonate Plant | |
| Boron SX | 68.3 |
| Lithium Carbonate wet plant | 116.2 |
| Dry area | 41.4 |
| In-plant evaporation. circuit (KCl) | 73.1 |
| Plant wide auxiliaries | 24.1 |
| Power distribution | 3.3 |
| Utilities | 31.2 |
| Non-Process Buildings | 4.0 |
| Total | 361.7 |
| 18.1.4 | Reagents Costs |
Reagents costs refer to the installation for the receiving, preparation and distribution of reagents for use in the process stages. Costs are shown in Table 18.5.
| Table 18.5 Reagent Costs | |
| Item |
Cost (US$ M) |
| Reagents | 24.5 |
| Power supply | 1.7 |
| Total | 26.2 |
Lithium Argentina AG., 2026 Cauchari-Olaroz S-K 1300 Technical Report Cauchari-Olaroz Salars, Argentina | Page 386 of 418 |
| 18.1.5 | Offsite Infrastructure Costs |
Offsite infrastructure refers to gas and electrical interconnection and transmission. Costs are shown in Table 18.6.
| Table 18.6 Offsite Infrastructure Costs | |
| Item |
Cost (US$ M) |
| Natural gas supply | 7.2 |
| Power supply | 6.4 |
| Total | 13.6 |
| 18.1.5.1 | Natural Gas Supply to Plant |
Natural gas is obtained from the Rosario gas compression station of the Gas Atacama pipeline located 52 km north of the Project site. Cost for this pipeline was obtained from a specific contractor bid.
Installed cost for this work is US$7.2 million (Table 18.6). This pipeline is designed to supply natural gas sufficient for production up to 50,000 tpa LCE.
| 18.1.5.2 | Power Supply to Plant |
The transmission system has been designed to provide sufficient electricity for a production capacity of at least 40,000 tpa LCE. Installed cost for this work is US$6.4 million (Table 18.6).
| 18.1.5.3 | Onsite Infrastructure and General Cost Summary |
Onsite infrastructure costs are summarized in Table 18.7.
| Table 18.7 Onsite Infrastructure and General Capital Cost Summary | |
| Description |
Total Projected Budget (US$ M) |
| On-Site Infrastructure | |
| General Area (including roads) | 90.6 |
| Camp | 13.4 |
| Utilities | 1.7 |
| Emergency Power Generation | 3.1 |
| Total | 108.7 |
Lithium Argentina AG., 2026 Cauchari-Olaroz S-K 1300 Technical Report Cauchari-Olaroz Salars, Argentina | Page 387 of 418 |
| 18.2 | Indirect Costs |
The indirect costs used for this study are given in Table 18.8. The percentages listed indicates the relation between the estimated costs for the item and the direct cost.
| Table 18.8 Project Indirect Costs | ||
| Description |
Cost (%) |
Cost (US$ M) |
| EP – Engineering and Procurement | 3.87% | 37.9 |
| CM – Construction Management | 7.82% | 76.6 |
| Commissioning | 2.02% | 19.8 |
| Vendor Representative | 0.39% | 3.8 |
| Third Party Services | 0.71% | 7.0 |
| Temporary Facilities | 0.28% | 2.7 |
| Construction Camp | 1.18% | 11.5 |
| Catering and Camp Services | 0.31% | 3.0 |
| Freight (by owner) | 1.88% | 18.4 |
| First Fills (calculated) | 0.62% | 6.1 |
| Training | 1.85% | 18.1 |
| Total Indirect Costs | 22.94% | 224.5 |
| 18.2.1 | Final CAPEX for Exar 40,000 tpa Plant |
The Final CAPEX for the 40,000 tpa LCE facilities, as defined during the engineering studies, reached a total of $979 million. This investment included the extraordinary cost incurred during the COVID-19 pandemic and the changes in cost due to inflation during construction.
The reported CAPEX is already committed and the ramp up period of three years is in the third year of implementation.
| 18.2.2 | Exclusions |
The following items are not included in this estimate:
| · | Legal costs; | |
| · | Special incentives and allowances; | |
| · | Escalation; and | |
| · | Start-up costs beyond those specifically included. |
| 18.2.3 | Currency |
All values are expressed in current $US dollars. During the construction period, Argentine peso denominated costs follow the exchange rate as a result of inflation, and there was a significant impact of the exchange rate fluctuation on CAPEX and OPEX.
| 18.2.4 | Sustaining Capital |
A provision of US$971 million of the sustaining capital over the life of the Project was included in the economic model. The sustaining capital includes purchase of equipment or development of facilities which would otherwise be capitalized. The sustaining capital costs include processing equipment to be purchased in future years, replacement of equipment, drilling of replacement wells, capital repairs of ponds, equipment replacement for the processing plant, etc.
Lithium Argentina AG., 2026 Cauchari-Olaroz S-K 1300 Technical Report Cauchari-Olaroz Salars, Argentina | Page 388 of 418 |
For the next 10 years, it is estimated that US$23.7 million will be allocated annually to sustainability capital, which is equivalent to US$601.4 per ton of lithium carbonate.
| 18.3 | Operating Costs Estimate |
| 18.3.1 | Operating Cost Summary |
The operating cost (OPEX) estimate for a 40,000 tpa lithium carbonate facility has been prepared using data generated during the ramp up. (Table 18.9). The OPEX that defined by Exar at this stage for a 40,000 tpa lithium carbonate is US $5,411 per tonne. This present cost is a substantial change from the FS OPEX definition that was US $3,579 per tonne. The inflation and devaluation of the local currency affected several items conforming the OPEX including reagent costs, maintenance, manpower, catering, security, consumables, and product transportation cost components.
During the ramp up, there is the opportunity to identify the requirement of an optimization program to control and if possible, to reduce OPEX cost.
Reagent consumption rates that were determined by pilot plant, laboratory, and computer model simulation have been actualized based on data obtained during ramp up period. Reagent cost values, which represent 36% of OPEX, has been obtained from the suppliers servicing the actual plant operation.
Energy consumption has been determined on an equipment-by-equipment basis and design utilization rate and confirmed with actual operational data.
Labour levels are confirmed in accordance with Exar Management’s operating the new facility. Salary and wage are based on the actual data being used by Exar in Argentina.
Maintenance estimates were updated by Exar’s management based on the actual maintenance cost and projected future cost based on their experience with similar operations.
Lithium Argentina AG., 2026 Cauchari-Olaroz S-K 1300 Technical Report Cauchari-Olaroz Salars, Argentina | Page 389 of 418 |
Results are as summarized in Table 18.9.
| Table 18.9 Operating Costs Summary | |||
| Description | Total (US$ 000 /Year) |
Li2CO3 (US$/Tonne) |
Allocation of Total OPEX (%) |
| Direct Costs | |||
| Reagents | 78,986 | 1,975 | 36% |
| Maintenance | 16,300 | 408 | 8% |
| Electric Power | 7,362 | 184 | 3% |
| Pond Salt Harvesting | 20,259 | 506 | 9% |
| Solid Waste Management (Rises) | 6,933 | 173 | 3% |
| Natural Gas | 4,567 | 114 | 2% |
| Manpower | 31,823 | 796 | 15% |
| Other Personnel Expenses | 2,516 | 63 | 1% |
| Catering, Security & Third-Party Services | 25,860 | 646 | 12% |
| Consumables | 4,226 | 106 | 2% |
| Diesel | 829 | 21 | 0% |
| Bus-in/Bus-out Transportation | 938 | 23 | 0% |
| Direct Costs Subtotal | 200,598 | 5,015 | 93% |
| Indirect Costs | |||
| G&A | 15,824 | 396 | 7% |
| Indirect Costs Subtotal | 15,824 | 396 | 7% |
| Total Operating Costs | 216,423 | 5,411 | 100% |
| 18.3.2 | Pond and Plant Reagents Costs Definition |
Reagents comprise 36% of total OPEX costs and were estimated by Exar using contractual prices for the present operation. Consumption volumes have been obtained from laboratory work and computer model simulations, performed by Exar and its consultant, and actual operational data collected by Exar.
Pond and plant reagents include the following:
| · | Calcium Chloride; | |
| · | Quicklime; | |
| · | Refined lime; | |
| · | Sodium Carbonate; | |
| · | Barium Chloride; | |
| · | Hydrochloric Acid; | |
| · | Sodium Hydroxide; | |
| · | Organic solvents (extractant, diluent); and | |
| · | Resins. |
Lithium Argentina AG., 2026 Cauchari-Olaroz S-K 1300 Technical Report Cauchari-Olaroz Salars, Argentina | Page 390 of 418 |
As indicated in Section 14.0, sulphate brines such as the one present in Cauchari typically require treatment with lime to remove unwanted elements before proceeding to the lithium carbonate plant. The lime is bought from a local producer (150 km from the Project) producing lime of suitable quality for the application This producer will require expansion of their facilities to be considered a preferable supplier; however, the proximity of this lime facility could provide cost savings over other supply alternatives from San Juan province located at 1,200 km from the Project.
Na2CO3 is the dominant reagent cost in the lithium carbonate plant. Boron removal costs are dominated by solvent extraction organic make-up and HCl, for pH adjustment.
| 18.3.3 | Pond Salt Harvesting |
Annual cost for harvesting and disposal of the projected precipitated salts were estimated at US $20,259,000 based on qualified service provider quote.
| 18.3.4 | Solid Waste Management (Rises) |
Annual cost of collecting and disposing of solids removed from brine was estimated at US$ 6,933,180, based on a quote from a qualified service provider.
| 18.3.5 | Energy Cost |
Overall electricity consumption is estimated to be 80.6 MWh/year. The Project cost includes the installation of a grid-tied high voltage transmission line to supply all electric power requirements for the plant facility.
Natural gas yearly expenditure is US $4,567,000.
Diesel fuel is also required by the stand-by diesel generators and mobile equipment. Annual diesel cost is estimated to be US $829,000.
Temporary diesel power generators were used to meet the energy requirements prior to the installation of the 33 kV line and are included in the capital cost estimate. As the high voltage line for power distribution to the field well is fully operational, the diesel generators are being phased out. Operating costs for these units were included in the OPEX during early years.
| 18.3.6 | Maintenance Cost |
Yearly expenditures for this item, including the Lithium Carbonate plant and supporting facilities, are estimated at US $16,300,000.
| 18.3.7 | Labour Cost |
Annual total costs, including base salary, contributions, bonuses, benefits and other remuneration inherent to the area and type of work performed, are approximately US $31,823,000 per year.
| 18.3.8 | Catering, Camp Services Cost, Security and Third-Party Services |
Catering and camp services include breakfast, lunch, dinner, housekeeping, security and other services. This item amounts to US $25,860,000 per year and is based on actual prices.
Lithium Argentina AG., 2026 Cauchari-Olaroz S-K 1300 Technical Report Cauchari-Olaroz Salars, Argentina | Page 391 of 418 |
| 18.3.9 | General and Administrative Costs |
General and Administrative Costs are estimated to be US $15,824,000 per year.
| 18.4 | Company Operational Organization |
The following diagram in Figure 18.1 Operational Organization presents an overview of the organization to operate the new lithium carbonate plant.
Lithium Argentina AG., 2026 Cauchari-Olaroz S-K 1300 Technical Report Cauchari-Olaroz Salars, Argentina | Page 392 of 418 |
Figure 18.1 Project Organization
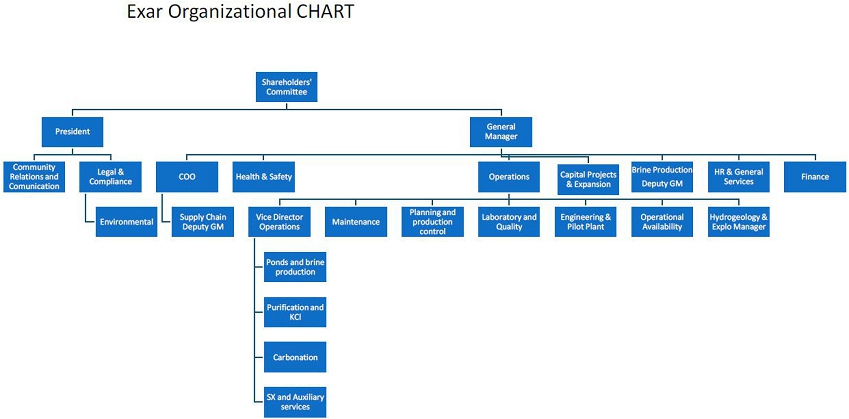
Lithium Argentina AG., 2026 Cauchari-Olaroz S-K 1300 Technical Report Cauchari-Olaroz Salars, Argentina | Page 393 of 418 |
| 19.0 | Economic Analysis |
This section has not been updated and added to this Report by LAR’s request. This section is available in the previous Technical Report, Burga et al. 2025.
Lithium Argentina AG., 2026 Cauchari-Olaroz S-K 1300 Technical Report Cauchari-Olaroz Salars, Argentina | Page 394 of 418 |
| 20.0 | Adjacent Properties |
| 20.1 | Olaroz Project - Arcadium Lithium |
The Exar properties are adjacent to an operation owned by a joint venture between Rio Tinto, Toyota Tsusho, and JEMSE, where Rio Tinto owns 66.5% of the project, Toyota Tsusho owns 25% and JEMSE owns 8.5% of the project.
The 66.5% portion of the project was originally owned by Orocobre Limited ("Orocobre”). In August 2021, Orocobre and Galaxy Resources Limited merged to form Allkem. In January 2024, Allkem merged with Livent to form Arcadium Limited and finally, in January of 2025 Rio Tinto acquired 100% of Arcadium through an all-cash purchase.
The Salar de Olaroz project consists of 35pr mining concessions covering 47,615 ha of claims (Figure 3.2 and Table 3.1). Exploration on the project began in 2008. In March of 2013, Orocobre began construction of a 17,500 tpa lithium carbonate production facility that was completed in November of 2014 with production subsequently commencing on November 21, 2014. Production began on the project without determining Mineral Reserves.
Production from the project from 2016 through part of 2021 is presented in Figure 20.1. An expansion of the plant to 42,400 tpa was completed in 2023. Production from the project from 2021 through 2023 is presented in Table 20.1 and the Mineral Resource Estimate presented Table 20.2 was taken from the Arcadium 2023 Annual Report. A photo of the Olaroz evaporation ponds and facility is presented in Figure 20.2.
Figure 20.1 Olaroz Project Production – 2016–2021
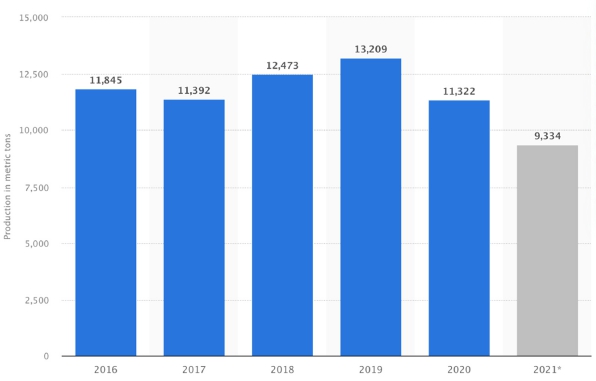
* In the first nine months of 2021, the Project produced approximately 9.3 thousand metric tonnes of lithium carbonate.
Source: (Statista.com)
Lithium Argentina AG., 2026 Cauchari-Olaroz S-K 1300 Technical Report Cauchari-Olaroz Salars, Argentina | Page 395 of 418 |
| Table 20.1 Production From Rio Tinto’s Olaroz Project – 2021 – 2023* | |||
| Product | Year | ||
| 2021 | 2022 | 2023 | |
| Lithium Carbonate (tonnes) | 12,977 | 13,959 | 17,758 |
* Information on this table was taken from the Arcadium Lithium Annual Report dated February 29, 2024. Figures reported in the Arcadium annual report were adjusted to reflect Arcadium’s 66.5% ownership. The numbers in this table are reported to reflect 100% of the production.
| Table 20.2 Mineral Resource Estimate for Arcadium’s Olaroz JV Project In Tonnes of Lithium Metal (1-10) | ||||
| Item | Mineral Resource Classification | |||
| Measured (M) | Indicated (I) | M+I | Inferred | |
| Li Mean Concentration (mg/L) | 659 | 592 | 641 | 609 |
| Resource (tonnes) | 1,560,000 | 499,000 | 2,059,000 | 1,105,000 |
| Notes: |
| 1. | Mineral Resources are reported exclusive of Mineral Reserves. Mineral Resources are not Mineral Reserves and do not have demonstrated reasonable prospects for economic extraction. |
| 2. | Lithium metal is converted to lithium carbonate with a conversion factor of 5.323 (i.e., 5.323 metric tonnes of LCE per 1 metric ton of lithium metal). |
| 3. | The estimate is reported in-situ and exclusive of Mineral Reserves, but because no Mineral Reserves were estimated, the Mineral Resources have only been depleted by historical production. |
| 4. | An elevated lithium cut-off grade of 300 mg/l was estimated based on a projected price of $20,000 per metric tonne LCE over the entirety of the life-of-mine of 30 years. The average lithium grade of the Measured and Indicated Mineral Resources corresponds to 641 mg/l. Extracted grades at individual production wells and the average Mineral Resources concentration are well above the 300 mg/l cut-off grade, demonstrating that there are reasonable prospects for economic extraction. |
| 5. | The estimated economic cut-off grade used for Mineral Resource reporting purposes is 300 mg/l lithium, based on the following assumptions: |
| 6. | A technical grade LCE price of $20,000/metric tonne. |
| 7. | An estimated recovery factor for the salar operation over the span of life-of-mine is 62%, equivalent to the assumed process recovery factor of 62%. |
| 8. | An average annual brine pumping rate of 600 L/s is assumed. |
| 9. | Cost estimates are based on a combination of fixed brine extraction, G&A and plant costs and variable costs associated with raw brine pumping rate or lithium production rate and capital costs. |
| 10. | The Mineral Resource has been depleted for the historical well production which is approximately 0.323 million tonnes of lithium carbonate equivalent (LCE), 0.314 million tonnes of LCE were depleted from the Measured Mineral Resource and 0.009 million tonnes of LCE was depleted from the Indicated Mineral Resource (associated with the accumulative production of well E-26). The accumulated production between 30 of June of 2023 and 31 December of 2023 was 0.031 million tonnes of LCE. |
Lithium Argentina AG., 2026 Cauchari-Olaroz S-K 1300 Technical Report Cauchari-Olaroz Salars, Argentina | Page 396 of 418 |
Figure 20.2 Olaroz Project – Evaporation Ponds and Facilities
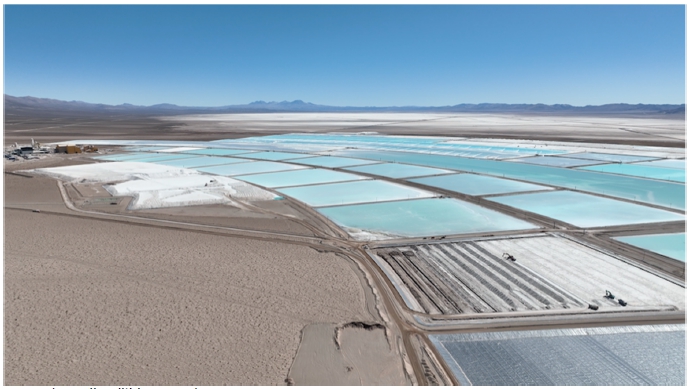
Source: (arcadiumlithium.com)
Lithium Argentina AG., 2026 Cauchari-Olaroz S-K 1300 Technical Report Cauchari-Olaroz Salars, Argentina | Page 397 of 418 |
Figure 20.3 Adjacent Properties Showing Boundary with the Exar Property
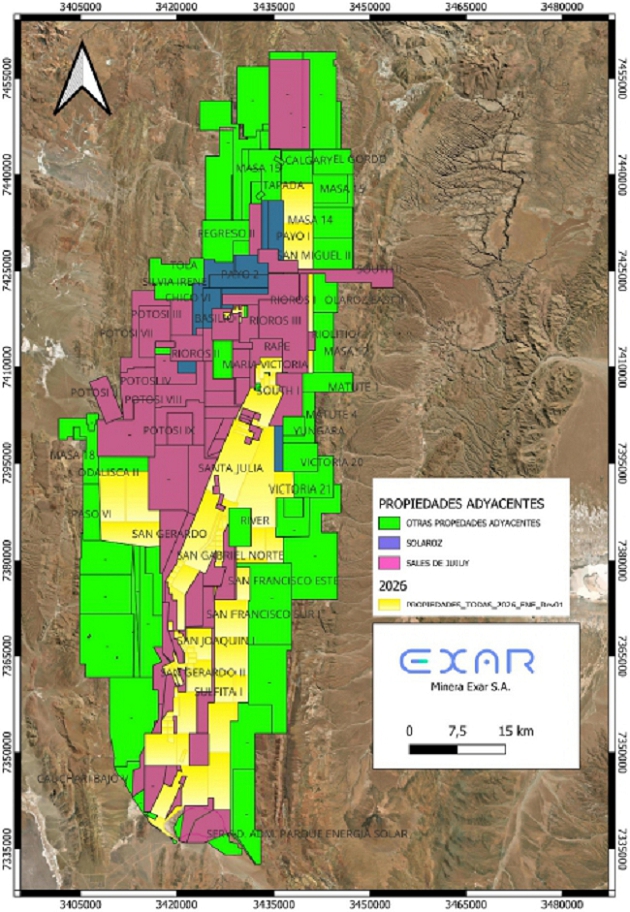
Source: (Exar, 2026)
Lithium Argentina AG., 2026 Cauchari-Olaroz S-K 1300 Technical Report Cauchari-Olaroz Salars, Argentina | Page 398 of 418 |
| 20.2 | Cauchari Project - Rio Tinto |
Rio Tinto’s Cauchari project is located at the south end of the Cauchari salar. Advantage was in a JV with Orocobre and in February of 2020, Orocobre announced the acquisition of 100% of the outstanding shares of Advantage. The subsequent changes in Orocobre are described in Section 20.1. In 2025, Rio Tinto acquired Advantage Lithium and the Cauchari project is now 100% owned by Rio Tinto. Exar’s Cauchari-Olaroz Salars, the Project, is located between Rio Tinto’s Cauchari project and its producing Olaroz project (Figure 20.3).
The Cauchari property consists of 22 mining concessions covering 28,906 ha. The Mineral Resource Estimate presented in Table 20.3 and Table 20.4 were taken from the Arcadium 2023 Annual Report.
| Table 20.3 Mineral Resource Estimate for Arcadium’s Cauchari JV Project in Tonnes of Lithium Metal (1-7) | ||||
| Item | Mineral Resource Classification | |||
| Measured (M) | Indicated (I) | M+I | Inferred | |
| Li Mean Concentration (mg/L) | 581 | 494 | 519 | 473 |
| Resource (tonnes) | 302,000 | 321,000 | 623,000 | 285,000 |
| 1. | Mineral Resources are reported exclusive of Mineral Reserves. Mineral Resources are not Mineral Reserves and do not have demonstrated reasonable prospects for economic extraction. |
| 2. | Lithium metal is converted to lithium carbonate with a conversion factor of 5.323 (i.e., 5.323 metric tonnes of LCE per 1 metric tonne of lithium metal). |
| 3. | The estimate is reported in-situ and exclusive of Mineral Reserves, where the lithium mass is representative of what remains in the reservoir after the life-of-mine. To calculate Mineral Resources exclusive of Mineral Reserves, a direct correlation was assumed between Proven Mineral Reserves and Measured Mineral Resources, as well as Probable Mineral Reserves and Indicated Mineral Resources. Proven Mineral Reserves (from the point of reference of brine pumped to the evaporation ponds) were subtracted from Measured Mineral Resources, and Probable Mineral Reserves (from the point of reference of brine pumped to the evaporation ponds) were subtracted from Indicated Mineral Resources. The average grade for Measured and Indicated Mineral Resources exclusive of Mineral Reserves was estimated based on the remaining brine volume and lithium mass. |
| 4. | An elevated lithium cut-off grade of 300 mg/l was estimated based on a projected price of $20,000 per metric tonne LCE over the entirety of the life-of-mine of 30 years. The average lithium grade of the Measured and Indicated Mineral Resources corresponds to 519 mg/l and represents the flux-weighted composite brine collected as brine is routed to the evaporation ponds. Extracted grades at individual production wells and the average Measured and Indicated Mineral Resource concentration are well above the 300 mg/l cut-off grade, demonstrating that there are reasonable prospects for economic extraction. |
| 5. | The estimated economic cut-off grade estimated for Mineral Resource reporting purposes is 300 mg/l lithium, based on the following assumptions: |
| 6. | A technical grade LCE price of $20,000/metric tonne. |
| 7. | An estimated recovery factor for the salar operation over the span of life-of-mine is 66%, lower than the estimated process recovery factor of 67%. |
Lithium Argentina AG., 2026 Cauchari-Olaroz S-K 1300 Technical Report Cauchari-Olaroz Salars, Argentina | Page 399 of 418 |
| Table 20.4 Mineral Reserve Estimate for Arcadium’s Cauchari JV Project in Tonnes of Lithium Metal (1-7) | |||
| Item | Mineral Resource Classification | ||
| Proven | Probable | Total | |
| Li Mean Concentration (mg/L) | 571 | 485 | 501 |
| Reserves (tonnes) | 43,000 | 169,000 | 212 |
| 1. | Lithium metal is converted to lithium carbonate with a conversion factor of 5.323 (i.e., 5.323 metric tonnes of LCE per 1 metric ton of lithium metal). |
| 2. | An elevated lithium cut-off grade of 300 mg/l was estimated based on a projected price of $20,000 per metric tonne LCE over the entirety of the life-of-mine of 30 years. The average lithium grade of the Proven and Probable Mineral Reserves corresponds to 501 mg/l and represents the flux-weighted composite brine collected as brine is routed to the evaporation ponds. Extracted grades at individual production wells and the average Proven and Probable Mineral Reserves concentration are well above the 300 mg/l cut-off grade, demonstrating that there are reasonable prospects for economic extraction. |
| 3. | The estimated economic cut-off grade estimated for Mineral Reserve reporting purposes is 300 mg/l lithium, based on the following assumptions: |
| 4. | A technical grade LCE price of $20,000/metric tonne. |
| 5. | An estimated recovery factor for the salar operation over the span of life-of-mine is 66%, lower than the estimated process recovery factor of 67%. |
| 6. | An average annual brine pumping rate of 480 L/s is assumed. |
| 7. | Cost estimates are based on a combination of fixed brine extraction, G&A and plant costs and variable costs associated with raw brine pumping rate or lithium production rate and capital costs. |
The information in this section has not been verified by the Qualified Person and it should be noted that the information is not necessarily indicative of the mineralization on the property that is the subject of this Technical Report.
Lithium Argentina AG., 2026 Cauchari-Olaroz S-K 1300 Technical Report Cauchari-Olaroz Salars, Argentina | Page 400 of 418 |
| 21.0 | Other Relevant Data and Information |
There is no other relevant data to consider that is applicable to this Technical Report.
Lithium Argentina AG., 2026 Cauchari-Olaroz S-K 1300 Technical Report Cauchari-Olaroz Salars, Argentina | Page 401 of 418 |
| 22.0 | Interpretation and Conclusions |
| 22.1 | Geology and Resources |
The 2026 estimated Measured and Indicated Resources increased by 60% to 25.9 Mt LCE with an average grade of 562 mg/L lithium from 16.2 Mt LCE 2019 values at 592 mg/L. Inferred resourced increased to 9.6 Mt LCE at an average grade of 567 mg/L lithium (up from 4.7 Mt LCE at 592 mg/L previously).
Updated Estimate incorporates additional drilling and basin wide hydrological model:
| - | Expanded resource footprint with new drilling, extending the resource area by approximately 20 km south of previous resource footprint | |
| - | Incorporates production well sampling data and results of a basin-wide hydrological model to support the Stage 2 development plan |
The Mineral Reserve Estimate for lithium incorporates the 2026 Mineral Resource Estimate for lithium using: 1) samples used from the prior, LAR (2019) Mineral Resource Estimate for lithium, and 2) Project database compiled from results of 2019 through 2025 South Cauchari exploration drilling, sampling, and testing campaigns, and additional production drilling and testing through the effective date of Dec 31, 2025.
To obtain the 2026 Reserve Mineral Estimate, the prior geologic and numerical models and the expanded database were analyzed and updated by Aquatec using Leapfrog® 3-D geologic and resource modeling software developed by Seequent (2018) and MODFLOW-USG developed by Panday and others (2013) coupled with the Groundwater Vistas interface (ESI, 2015).
The 2026 Mineral Reserve Estimate is based on an expanded numerical model domain incorporating the substantial amount of exploration drilling and exploration work completed through the effective date of this report. Aquatec and GWI evaluated the Updated Mineral Reserve Estimate using the following modeling criteria as specified by Exar:
| · | A 35-year wellfield extraction period operation and 40,000 tonnes of LCE processed during subsequent wellfield operations (Year 0 through Year 35). |
| · | An average lithium concentration for the 35-year extraction period from the simulated wellfield at or above the current engineering estimate for processing of 578 mg/L. |
| · | Brine production from simulated wells derived from Measured and Indicated Mineral Resource volumes. |
| · | In consideration of current uncertainties and limitations in the numerical model, maximize overall wellfield extraction rate and optimize production well locations for predictive assessment of an Updated Mineral Reserve Estimate. |
The simulated brine production wellfield for the basis of the 2026 Mineral Reserve Estimate uses a total of 39 production wells for an average production of 40,419 tpa LCE for 35 years from Jan,1 2026.
The 2026 Mineral Reserve Estimate model is based on initial lithium concentrations incorporated in the HSU model used in the 2026 Mineral Resource Estimate (LAR, 2026), as well as representative aquifer parameters derived from aquifer testing and calibration for steady-state and transient hydraulic conditions.
Lithium Argentina AG., 2026 Cauchari-Olaroz S-K 1300 Technical Report Cauchari-Olaroz Salars, Argentina | Page 402 of 418 |
Overall, the modeled wellfield shows the ability to exceed the minimum 40,000 tpa LCE process and 578 mg/L annual lithium concentration targets. The predicted results for the 35-year production period are as follows:
| · | Average production rate of 40,419 tpa LCE accounting for processing efficiency (63%) for the 35-year pumping period; |
| · | Average lithium concentration of 578 mg/L for the 35-year pumping period; the maximum concentration of 590 mg/L occurs at the start-up in Year 0 and the minimum concentration of 561 mg/L occurs near the end of the pumping period in Year 35. |
Without factoring processing efficiency, the Mineral Reserve Estimate for lithium is summarized as Proven and Probable for a 35-year production period as follows:
| · | Proven Mineral Reserves (with processing efficiency). |
| o | The Proven Mineral Reserves for LCE are 400,886 tonnes. |
| · | Probable Mineral Reserves (with processing efficiency). |
| o | The Probable Mineral Reserves for LCE are 1,013,796 tonnes. |
| · | Total Proven and Probable Mineral Reserves (with processing efficiency). |
| o | The Total Mineral Reserve for LCE is 1,414,682 tonnes. |
The 2026 Mineral Reserves Estimate is based on a target production rate of 40,000 tpa of LCE for Stage 1 operations. The current Estimate intentionally evaluates Mineral Reserves sufficient to support this base production rate, while preserving additional extraction capacity for a potential Stage 2 expansion in the future which could include Cauchari South and a total production of approximately 80,000 tpa LCE.
| o | In contrast, the 2019 Reserves Estimate, considered a maximum production of 48,800 tpa LCE over a 40-year operating period, based on a larger wellfield and production capacity beyond Stage 1. |
| · | Mine Life and Treatment of Historical Production |
| o | The 2026 Mineral Reserves Estimate considers a 35-year period, from January 1, 2026 through December 31, 2060. The Estimate is forward-looking and excludes historical production from year 2018 to 2025 of 280,978 t LCE which includes the current brine inventory. |
| o | No material change to previous 40-year project life from 2019 Reserve Estimate after adjusting for brine production from 2018-2025 and 2026 Mineral Reserves Estimate of 35-year period from January 1, 2026 to December 31, 2060. |
| o | Despite the exclusion of historical production, modeled lithium at the end of the reserve life remains robust and drawdowns in both salars are not significant, leaving room for an extension of project life or future Stage 2 expansion. |
Lithium Argentina AG., 2026 Cauchari-Olaroz S-K 1300 Technical Report Cauchari-Olaroz Salars, Argentina | Page 403 of 418 |
| · | Process Recovery Assumptions |
| o | The 2026 Mineral Reserves Estimate uses an updated process recovery assumption of 63.0%, reflecting demonstrated operating performance, while the 2019 Mineral Reserve Estimate applied a theoretical process efficiency of 53.7 %. |
| · | Proven Mineral Reserves |
| o | The 2026 Proven Mineral Reserve Estimate represents the first 10 years of production, supported by production history and updated resource modeling, increasing certainty compared to the 2019 Reserves Estimates. As a result, Proven Mineral Reserves have increased by 45% in 2026 relative to the 2019 estimations. |
| · | Probable Mineral Reserves |
| o | The 2026 Probable Mineral Reserve Estimates are reduced by 40%, relative to the 2019 estimate. This decrease is caused by changes in classification methodology and production assumptions, rather than a deterioration in resource quality. Key factors include: |
| § | Five years of production previously classified at Probable being reclassified as Proven, supported by operational data. | |
| § | Production from 2018 to end of 2025 is not considered in the 2019 Mineral Reserve Estimate. |
| 22.2 | Brine Production |
The location, design and assumed productivity of the brine extraction wells was determined using a hydrogeologic model supported by data collected from geologic logs, drill cores, chemistry analysis and long-term pumping test data.
| 22.3 | Process Information and Design |
The implemented process is based on conventional brine extraction and processing methods including pumping brine from the salar, concentrating the brine through evaporation ponds, and taking the brine concentrate through a hydrometallurgical facility to produce high-grade lithium carbonate. Exar and its consultants have successfully tested the brine chemistry of the Cauchari deposit through process simulation using estimation methods and process simulation techniques. This work has been validated by the results of evaporation and process testing at the on-site pilot plant and evaporation ponds, in addition to other testing developed with universities and suppliers.
The facilities are operating in a ramp up period with good success. Production level has reached 85% of design capacity in 2025.
| 22.4 | Environmental Studies, Permitting and Social or Community Impact |
The environmental, permitting, and social or community impact information summarized in this Report is adequate for the current stage of development of the Project and supports the stated Mineral Resource and Mineral Reserve Estimates. Performance since transition to sustained production is consistent with environmental and social impact assessments and their management plans, and no material issues have been identified that would reasonably be expected to affect the current Mineral Reserves and Mineral Resources, or the ongoing operation.
Lithium Argentina AG., 2026 Cauchari-Olaroz S-K 1300 Technical Report Cauchari-Olaroz Salars, Argentina | Page 404 of 418 |
| 22.5 | Economic Analysis |
| · | Lithium Industry: Market studies indicate that the lithium industry has a promising future. The use of lithium ion batteries for electric vehicles and renewable energy storage applications are driving lithium demand rapidly to unprecedented levels. |
| · | Project Capital Cost: The capital investment for the 40,000 tpa lithium carbonate Cauchari-Olaroz, including equipment, materials, indirect costs and contingencies during the construction period was defined at US$-979 million. Costs have been completed using consulting engineering services for facilities definition and supplier purchase order for all major items. The main cost drivers are the pond construction and process facilities, which represents 55% of total project capital expenditures. |
| · | Operating Costs: The operating cost estimate (+/-15% accuracy) for the 40,000 tpa lithium carbonate facility is US$5,411 per tonne. This figure includes pond and plant chemicals, energy/fuel, labour, salt waste removal, maintenance, camp services and transportation. |
| · | Project Strength: Project fundamentals, such as the full completion of facilities construction, fully invested capital and a controlled operating cost, product demand and improved future price, and economics are all strong. |
| 22.6 | Project Risks |
| · | Process risk: Problems may arise during detailed design, or later in scaling up to full production capacity. Reagents consumption may be higher than predicted and/or product yields may be lower than current estimates. |
| · | Fluctuation in reagent costs: Soda ash supply is assumed to be imported. There is an existing soda ash manufacturer in Argentina, which currently operates at full capacity. Market pricing for other reagents may also fluctuate. However, the sensitivity analysis demonstrated that the economic performance of the Project is not highly sensitive to operating cost. |
| · | Electricity and gas: Electricity for the Project is supplied via the provincial electrical network and is approximately 3% of the total operating costs. Cost escalation risk for grid power is relatively low and can be mitigated quickly and cost-effectively by exploiting the significant solar energy potential at site, if required. Natural gas is used mainly for camp operations and specific process applications and represents only 2% of the total operating costs. The current natural gas price is US$4.8/MMBTU. As Argentina has become a net gas exporter to Chile and Brazil, due to successful gas production from the Vaca Muerta Formation, the risk for price increased has diminished due to the large availability of this commodity. |
| · | Taxes: The Company operates under Federal Argentinian Mining Law N° 24.196. This law grants Exar a tax freeze, or protection against tax increases for a period of 30 years from the date when Exar files the Feasibility Study with the Federal Mining Authority. |
Lithium Argentina AG., 2026 Cauchari-Olaroz S-K 1300 Technical Report Cauchari-Olaroz Salars, Argentina | Page 405 of 418 |
| · | Inflation, exchange rate, and devaluation: Economic policies of the New Government are projecting a positive control in these important sectors of the economy. |
| · | Location – elevation: The Project site is at a high elevation, approximately 4,000 m above sea level, which can result in difficult work conditions for individuals used to lower elevations. Medical oxygen tanks are readily available for staff travelling to, and working at, the mine site. The ramp up period allowed to identify the needs of the workforce to confront the elevation creating a safe environment. |
| · | Brine composition: Relatively high contents of sulphate and magnesium in the brine make it necessary for a chemical treatment with lime to remove these components. This has been successfully implemented. |
| · | Weather dependence: Weather variation, including higher than normal raining periods and long winter periods have occurred in recent years that those factors could impact in the performance of the evaporation cycle in the ponds. |
| · | Process implementation: The Exar process is specialized to the type of brine in the salar and there is no other industrial operation running the same process configuration. Mitigation factors include implementation of dedicated stages for elimination of impurities and purification of the solution. |
| · | Process system design - supplier expertise: The design and fabrication of process equipment/facilities are unique for the process and high-altitude location, considering the performance at high elevation and high wind environment. Test at different vendors and pilot plant were performed before placing some of the equipment orders. Operation during ramp up allowed to identify the suitability of the design and correction were made as necessary. |
Lithium Argentina AG., 2026 Cauchari-Olaroz S-K 1300 Technical Report Cauchari-Olaroz Salars, Argentina | Page 406 of 418 |
| 23.0 | Recommendations |
The Qualified Persons involved in the Report make the following recommendations.
| · | Based on the conceptual hydrogeologic system and results of the numerical model, considering the production model since 2018 until the end of 2025, the authors believe it is appropriate to estimate that the Proven Mineral Reserve is what the QPs believe is feasible to be pumped to the evaporation ponds and recovered for the next ten years of operations. |
| · | The ongoing work in the full basin numerical model is being developed to support the Stage 2 expansion project of approximately 45,000 tpa additional capacity. This stage will consider the new DLE technology for increasing the lithium recovery and reducing the project construction schedule. |
| · | QA/QC: The QA/QC program, using regular insertions of blanks, duplicates, and standards should be continued. All exploration samples should be analyzed at Alex Stewart when exploration activities resume. |
| · | The QPs recommend investigating process modifications to the carbonation process step in order to reduce the sulphate content in the final product. |
| · | The on-site laboratory should obtain ISO 17025 certification for analytical laboratories. |
| · | Financial Assurances: Establish and maintain the required financial guarantees for closure. |
| · | Stakeholder Engagement: Continue proactive engagement to address environmental and social priorities to identify and address potential Project related issues at an early stage in collaboration with affected parties. |
The estimated cost for the recommendations is summarized in Table 23.1.
| Table 23.1 Recommendations Budget | |
| Item |
Budget (US$) |
| Mineral Resource and Reserve Update | $200,000 |
| Stage 2 Preliminary Economic Assessment | $250,000 |
| ISO 17025 Accreditation | $20,000 |
| Updated Technical Report | $80,000 |
| Permitting and Social Community Work | $200,000 |
| Total | $750,000 |
Existing environmental monitoring programmes should be maintained during the operational phase to ensure continuity with historical data sets and to support ongoing interpretation of environmental trends.
Lithium Argentina AG., 2026 Cauchari-Olaroz S-K 1300 Technical Report Cauchari-Olaroz Salars, Argentina | Page 407 of 418 |
Integrated oversight of brine extraction, groundwater levels and water quality data should be maintained to confirm continued consistency with predicted system behaviour and baseline conditions.
Current environmental management and grievance response processes, including those addressing nuisance-type effects, should be maintained to ensure timely, documented and proportionate responses to operational phase issues.
Lithium Argentina AG., 2026 Cauchari-Olaroz S-K 1300 Technical Report Cauchari-Olaroz Salars, Argentina | Page 408 of 418 |
24.0 References
Alonso, Ricardo N. 1999. “On the origin of La Puna Borates”. Acta geológica hispánica, vol.VOL 34, no. 2, pp. 141-66.
Aloulou, F. Zaretskaya, V., Growth in Argentina’s Vaca Muerte Shale and Tight Gas Production Leads to LNG Exports. U.S. Energy Informaiton Administration.
www.eia.gov/todayinenergy/detail.php?id=40093, July 12, 2019.
Advantage Lithium, 2018. NI 43-101 Technical Report - Preliminary Economic Assessment of the Advantage Lithium Project, Jujuy Province, Argentina: effective date August 31, 2018, prepared by Worley Parsons and Flo Solutions.
Bear, J., 1972. Dynamics of Fluids in Porous Media. Dover Publications, New York.
Beauheim R.L. and Roberts, R.M., 2002. Hydrology and Hydraulic Properties of a Bedded Evaporite Formation. Journal of Hydrology 259, no. 1-4 (March 1, 2002): 66- 88.
Beauheim, R.L., Saulnier, G.J. and Avis, G.J., 1991. Interpretation of Brine- Permeability Tests of the Salado Formation at the Waste Isolation Pilot Plant Site: First Interim Report, Report: SAND90-0083, Albuquerque, NM: Sandia National Laboratories, August 1991.
Beauheim, R.L. and Holt, R.M., 1990. Hydrogeology of the WIPP Site: Geological and Hydrological Studies of Evaporites in the Northern Delaware Basin for the Waste Isolation Pilot Plant (WIPP), New Mexico (pp. 131-79). Geological Society of America Field Trip No. 14 Guidebook. Dallas: Dallas Geological Society.
Bossi, G.E., 2011. The Cauchari Sedimentology Final Report. Minera Exar S.A., Prepared for Lithium Americas.
Burga, E., Burga, D. Weber, D., Sanford, A., Dworzanowski, M., 2025, Operational Technical Report at the Cauchari-Olaroz Salars, Jujuy Province, Argentina, NI 43-101 Report, Prepared for Lithium Argentina.
Burga, E., Burga, D., Genck, W., Weber, D., Sandford, A., Dworzanowski, M. 2020. Updated Feasibility Study and Mineral Reserve Estimation to Support 40,000 tpa at the Cauchari-Olaroz Salars, Jujuy Province, Argentina, NI 43-101 Report, Prepared for Lithium Americas.
Burga, E., Burga, D., Genck, W., Weber, D., 2019. Updated Mineral Reserve Estimate for Cauchari-Olaroz, Jujuy Province, Argentina, NI 43-101 Report, Prepared for Lithium Americas.
Burga, E., Burga, D., Rosko, M., Sanford, T., Leblanc, R., Smee, B. King, M., Abbey, D., 2017. Updated Reserve Estimation and Lithium Carbonate Production at the Cauchari-Olaroz Salars, Jujuy Province, Argentina, NI 43-101 Report, Prepared for Lithium Americas.
CIM Standing Committee on Reserve Definition, CIM Definition Standards-For Mineral Resources and Mineral Reserves. 2014.
CIM Best Practice Guidelines for Resource and Reserve Estimation for Lithium Brines, 2012.
Lithium Argentina AG., 2026 Cauchari-Olaroz S-K 1300 Technical Report Cauchari-Olaroz Salars, Argentina | Page 409 of 418 |
Conesa, V., 1997. Auditorías Medioambientales: Guía Metodológica. España.
Conhidro, 2012. Informe Plataforma Pozo Agua Industrial Pozos: PPI1 y PBI1, Salar de Cauchari, Provincia de Jujuy, Minera Exar, Septiembre 2011.
Cooper, H.H. and Jacob, C.E., 1946. A Generalized Graphical Method for Evaluating Formation Constants and Summarizing Well Field History, Am. Geophys. Union Trans., vol. 27, pp. 526-534.
Cravero, F., 2009a. Informe de Actividades Realizadas en el Salar Cauchari-Olaroz, Minera Exar S.A., LAR Internal Report.
Cravero, F., 2009b. Analisis Mineralogico de los Pozos 5 y 6, Salar de Olaroz. Comparación con los Resultados de los Pozos 3 y 4, Salar de Cauchari., Minera Exar S.A. LAR Internal Report.
Domenico, P. and Schwartz, F., 1990. Physical and Chemical Hydrogeology. John Wiley and Sons, New York.
Dougherty, D.E and Babu, D.K., 1984. Flow to a Partially Penetrating Well in a Double-Porosity Reservoir, Water Resources Research, vol. 20, no. 8, pp. 1116-1122.
Environmental Simulations Incorporated (ESI), 2015. Groundwater Vistas version 7.
Fetter, C.W., 1994. Applied Hydrogeology. Prentice Hall Inc., Upper Saddle River, New Jersey.
Fowler, J., and Pavlovic, P., 2004. Evaluation of the Potential of Salar Del Rincon Brine Deposit as a Source of Lithium, Potash, Boron and Other Mineral Resources. Report for Argentina Diamonds Ltd.
Freeze, R.A., and Cherry, J.A., 1979. Groundwater. Prentice Hall Inc., Englewood Cliffs, New Jersey.
Gelhar, L., Welty, C., and K. Rehfeldt, 1992. A Critical Review of Data on Field-Scale Dispersion in Aquifers. Water Resources Research, 28: 1955-1974.
Hantush, M.S., 1964. Hydraulics of Wells, in: Advances in Hydroscience, V.T. Chow (editor), Academic Press, New York, pp. 281-442.
Hantush, M.S., 1962. Flow of Ground Water in Sands of Nonuniform Thickness; 3. Flow to Wells, Jour. Geophys. Res., vol. 67, no. 4, pp. 1527-1534.
Hantush, M.S., 1961a. Drawdown Around a Partially Penetrating Well, Jour. of the Hyd. Div., Proc. of the Am. Soc. of Civil Eng., vol. 87, no. HY4, pp. 83-98.
Hantush, M.S., 1961b. Aquifer Tests on Partially Penetrating Wells, Jour. of the Hyd. Div., Proc. of the Am. Soc. of Civil Eng., vol. 87, no. HY5, pp. 171-194.
Hantush, M.S., 1960. Modification of the Theory of Leaky Aquifers, Jour. of Geophys. Res., vol. 65, no. 11, pp. 3713-3725.
Lithium Argentina AG., 2026 Cauchari-Olaroz S-K 1300 Technical Report Cauchari-Olaroz Salars, Argentina | Page 410 of 418 |
Hantush, M.S. and Jacob, C.E., 1955. Non-Steady Radial Flow in an Infinite Leaky Aquifer, Am. Geophys. Union Trans., vol. 36, pp. 95-100.
Harbaugh, A.W., 2005. MODFLOW-2005, the U.S. Geological Survey Modular Ground-Water Model -- the Ground-Water Flow Process: U.S. Geological Survey Techniques and Methods 6-A16.
Helvaci, C., and Alonso, R.N., 2000. Borate Deposits of Turkey and Argentina; a Summary and Geological Comparison. Turkish Journal of Earth Sciences Vol 9, pp1-27.
Hess, K., Davis, J, Kent D., and J. Coston. 2002. Multispecies reactive Tracer Test in an Aquifer with Spatially Variable Chemical Conditions, Cape Cod, Massachusetts: Dispersive Transport of Bromide and Nickel. Water Resources Research 38: 36-1 – 36-27.
Houston J., 2006. Variability of Precipitation in the Atacama Desert: Its Causes and Hydrological Impact. International Journal of Climatology 26:2181-2189.
Houston J., 2009. A Recharge Model for High Altitude, Arid, Andean Aquifers. Hydrol. Process. 23, 2383–2393, Published online 13 May 2009 in Wiley InterScience,
(www.interscience.wiley.com) DOI: 10.1002/hyp.7350.
Houston, J., 2010a. Technical Report on the Cauchari Project, Jujuy, Argentina. NI 43-101 Report, prepared on behalf of Orocobre Limited.
Houston, J., 2010b. Technical Report on the Salinas Grandes – Guayotayoc Project, Jujuy-Salta Provinces, Argentina. NI 43-101 Report, prepared on behalf of Orocobre Limited.
Houston, J., and Gunn, M., 2011. Technical Report on the Salar de Olaroz Lithium- Potassium Project, Jujuy Province, Argentina.NI 43-101 Report, prepared on behalf of Orocobre Limited.
Houston, J., Ehren, P., 2010. Technical Report on the Olaroz Project, Jujuy Province, Argentina. Report for NI 43-101, prepared on behalf of Orocobre Limited.
Instituto Nacional de Estadistica y Censos, Censo 2022 Republica Argentina, Censo Nacional de Población, Hogares y Viviendas, 2022, Resultados provisionales. 2023.
Jaganmohan, M. (2024, April 25). Lithium Production of Orocobre in Argentina 2021. Statista. https://www.statista.com/statistics/1092121/argentina-lithium-carbonate-production-orocobre/
Johnson, A.I., 1967. Specific Yield — Compilation of Specific Yields for Various Materials. U.S. Geological Survey Water Supply Paper 1662-D. 74 p.
Jordan, T.E., Muñoz, N., Hein, M., Lowenstein, T., Godfrey, L., and Yu, J., 2002. Active Faulting and Folding Without Topographic Expression in an Evaporite Basin, Chile. Geological Society of America Bulletin 114: 1406-1421.
Lithium Argentina AG., 2026 Cauchari-Olaroz S-K 1300 Technical Report Cauchari-Olaroz Salars, Argentina | Page 411 of 418 |
King, M., 2010a. Amended Inferred Resource Estimation of Lithium and Potassium at the Cauchari and Olaroz Salars, Jujuy Province, Argentina. Report prepared for Lithium Americas Corp.
King, M., 2010b. Measured, Indicated and Inferred Resource Estimation of Lithium and Potassium at the Cauchari and Olaroz Salars, Jujuy Province, Argentina. Report prepared for Lithium Americas Corp.
King, M., Abbey, D., Kelley, R., 2012. Feasibility Study Reserve Estimation and Lithium Carbonate and Potash Production at the Cauchari-Olaroz Salars, Jujuy Province, Argentina. Report prepared for Lithium Americas Corp.
Liu, J., Williams, J.R., Wang, X., and Yang, H., 2009. Using MODAWEC to Generate Daily Weather Data for the EPIC Model. Environmental Modelling & Software 24 (5):655-644
Moench, A.F., 1985. Transient Flow to a Large-Diameter Well in an Aquifer with Storative Semiconfining Layers, Water Resources Research, vol. 21, no. 8, pp. 1121- 1131.
Montgomery & Associates, 2025. Modelo Conceptual Integrado Cuenca Cauchari-Olaroz, Argentina: Tarea C – Informe IV.
Montgomery & Associates, 2024a. Informe I: Recopilación, Análisis e Integración de Antecedentes de Minera Exar y Sales de Jujuy, Cuenca Cauchari – Olaroz, Argentina. Borrador de reporte preparado para Minera Exar y Sales de Jujuy. Julio de 2024.
Orocobre Limited, 2011. NI 43-101 Technical Report on the Salar de Olaroz Lithium-Potash Project: dated May 13, 2011, prepared by J. Houston and M. Gunn.
Panday S, Langevin ChD, Niswonger RG, Ibaraki M, Hughes JD, 2013. MODFLOW–USG version 1: an unstructured grid version of MODFLOW for simulating groundwater flow and tightly coupled processes using a control volume finite-difference formulation. Ch 45, Section A, Groundwater Book 6, Modeling Techniques. USGS, Reston, VA, USA.
Papadopulos, I.S. and H.H. Cooper, 1967. Drawdown in a Well of Large Diameter, Water Resources Research, vol. 3, no. 1, pp. 241-244.
Proyecto Fenix – Salar de Hombre Muerto website,
http://www1.hcdn.gov.ar/dependencias/cmineria/fenix.htm.
Remy, N., Boucher, A., and Wu, J., 2011. Applied Geostatistics with SGeMs: A User’s Guide. Cambridge University Press, New York.
Robson, S.G. and Banta, E.R., 1990. Determination of Specific Storage by Measurement of Aquifer Compression Near a Pumping Well. Ground Water. V. 28m no. 6, pp. 868-874
Roskill, 2009. The Economics of Lithium. 11th Edition.
Seggario, R.E., 2015. Hoja Geologica, 2366-III, Susques, Provincias de Jujuy y Salta. Servicio Geologico Minero Argentino, Instituto de Geologia y Recursos Mineral.
Lithium Argentina AG., 2026 Cauchari-Olaroz S-K 1300 Technical Report Cauchari-Olaroz Salars, Argentina | Page 412 of 418 |
Salazar, G.A., 2019. Reporte, Análasis Estadístico de Datos Meteorólogicos Medidos y de Tendencia de Evaporación en Salar Cauchari-Olaroz (Prov. de Jujuy-Argentina) INENCO-CONICET.
Smee, B., 2011. Quality Control Data Review, Salares Lithium Project, Argentina. Report for Minera Exar.
Stormont, J. C., Hines, J. H., Pease, R. E., O’Dowd, D. N., Kelsey, and J. A., 2010. Method to Measure the Relative Brine Release Capacity of Geologic Material. ASTM Geotechnical Testing Journal Symposium in Print: Innovations in Characterizing the Mechanical and Hydrological Properties of Unsaturated Soils.
SQM, 2016. Cálculo de la Recarga de Caudal en la Cuenca de los Salares Cauchari y Olaroz, Utilizando el Modelo Hidrológico HEC HMS.
Suárez-Authievre, C., and Villarroel-Alcocer, F., 2012. Cutoff Analysis of Lithium Carbonate Process from Brines the Salar de Cauchari. Report for Lithium Americas.
Theis, C.V., 1935. The Relation Between the Lowering of the Piezometric Surface and the Rate and Duration of Discharge of a Well Using Groundwater Storage, Am. Geophys. Union Trans., vol. 16, pp. 519-524.
USACE (United States Army Corps of Engineers), 2006. Hydrologic Modelling System HEC-HMS. User's Manual. Version 3.1.0. http://www.hec.usace.army.miL/software/hec-hms/documentation.html.
US SEC (United States Securities and Exchange Commission), 2009. Form 20-F for Sociedad Quimica y Minera de Chile S.A. (Chemical and Mining Company of Chile Inc.).
Van der Leeden, F., Troise, F., and Todd, D., 1990. The Water Encyclopedia, Second Edition. Lewis Publishers, Chelsen, Michigan.
Background References
ARA WorleyParsons, 2011. Preliminary Assessment and Economic Evaluation of the Cauchari-Olaroz Lithium Project, Jujuy Province, Argentina.
Esteban C. L., 2005. Estudio Geologic y Evapofacies del Salar Cauchari, Departamento Susques, Jujuy. Universidad Nacional de Salta, Tesis Professional.
Jerez, D., 2010. Informe Sobre los Tributos con Incidencia en el Proyecto Cauchari. August 2010.
Koorevaar P., Menelik G., and Dirksen C., 1983. Elements of Soil Physics, Elsevier.
Kunaz, I., 2009. Cauchari and Incahuasi Argentine Salars Assessment and Development. Internal report by TRU group for Lithium Americas Corp.
Kunaz, I., 2009. Evaluation of the Exploration Potential at the Salares de Cauchari and Olaroz, Province of Jujuy, Argentina. Internal report by TRU group for Lithium Americas Corp.
Lithium Argentina AG., 2026 Cauchari-Olaroz S-K 1300 Technical Report Cauchari-Olaroz Salars, Argentina | Page 413 of 418 |
Latin American Minerals, 2009. Informe de Impacto Ambiental, Etapa de Exploracion Proyecto Olaroz – Cauchari.
Lic. Echenique Mónica, Lic. Agostino Gilda, Lic Zemplin Telma, 2009. Plan de Relaciones Comunitarias.
Nicolli H. B., 1981. Geoquimica de Aguas y Salmueras de Cuencas Evaporaticas de la Puna. Anal. Acad. Nac. Cs. Ex. Fís. Nat. Buenos Aires, Tomo 33.
Platts, January 2016, Argentina Eyes Raising Natural Gas Prices to Boost Output, retrieved from http://www.platts.com/latest-news/natural-gas/buenosaires/argentina-eyes-raising-natural-gas-prices-to-21829120 on March 31, 2017.
Schalamuk, I., Fernandez R. y Etcheverry R., 1983. Los Yacimientos de Minerals no Metalíferos y Rocas de Aplicacion de la Region NOA. Ministeria de Economía, Subsecretaría de Minería, Buenos Aires.
Autor desconocido, 2000. Estudio Geologic-Económico, Mina La Yaveña, Departamento de Susques de Jujuy.
Testing
CICITEM, Estudios Experimentales Salmuera Salar de Cauchari, Parte 1 y 2, Dr. P. Vargas, Mayo 2011.
Minera EXAR, Pruebas De Encalado Con Cal Viva, Documento interno, Noviembre 2011.
Minera EXAR, Pruebas De Sedimentacion Con Cal Viva, Documento interno, Noviembre 2011.
IIT-UdeC, Pruebas De Laboratorio De Extraccion Por Solvente De Boro Desde Salmuera Del Salar De Cauchari, I. Wilkomirski, Octubre 2011.
SGS Canada Inc. The Production of Lithium Carbonate from a Representative Sample from Salar Cauchari, Project 13101-001 – Final Report, septiembre 2011.
SGS Canada Inc, Pilot Plant Investigation into the Production of Lithium Carbonate from a Representative Sample from Salar Cauchari, Mayo 2012.
SRC, Saskatchewan Research Council Mining and Minerals Division, Cauchari- Olaroz Project Potash Recovery from Salt Lake Winter Precipitates, Diciembre 2011.
Bibliography
Conesa Fernández-Vítora, V. (1997). Auditorías Medioambientales, Guía Metodológica (2a. ed. re). Madrid: Mundi-Prensa. Retrieved from
http://www.sunass.gob.pe/doc/cendoc/pmb/opac_css/index.php?lvl=author_see&id=174.
Soil Survey Staff. (1999). Soil taxonomy: a Basic System of Soil Classification for Making and Interpreting Soil Surveys (2nd ed.). Washington D.C.: US Department of Agriculture Soil Conservation Service.
Lithium Argentina AG., 2026 Cauchari-Olaroz S-K 1300 Technical Report Cauchari-Olaroz Salars, Argentina | Page 414 of 418 |
25.0 Reliance on Information Provided by the Registrant
Although copies of the tenure documents, operating licenses, permits, and work contracts were reviewed, an independent verification of land title and tenure was not performed. Deptford has not verified the legality of any underlying agreement(s) that may exist concerning the licenses or other agreement(s) between third parties but has relied on the client’s law firm, Martina de Hoz & Rueda, to have conducted the proper legal due diligence for the claims discussed in Section 4.2. This was addressed in a Memorandum dated February 27, 2026.
A draft copy of this Report has been reviewed for factual accuracy by Lithium Argentina and Deptford has relied on LAR’s historical and current knowledge of the Property in this regard.
Any statements and opinions expressed in this document are given in good faith and in the belief that such statements and opinions are not false and misleading at the date of this Report.
Lithium Argentina AG., 2026 Cauchari-Olaroz S-K 1300 Technical Report Cauchari-Olaroz Salars, Argentina | Page 415 of 418 |
 | Appendix 1 - Summary Tables of Pumping Test Results
for Exploration and Production Wells Exploration and Production Wells |
Appendix 1. Summary Tables of Pumping Test Results for Exploration and Production Wells
| Table 1 Location and Construction Information for Exploration Wells and Pumping Tests | ||||||||
| Well Identifier |
Coordinates | Land Surface Elevation (m amsl) |
Year Constructed |
Total Depth of Well (m) |
Depth Interval of Well Screen (m, bls) |
HSU(s) Penetrated by Screened Interval of Well | ||
| East (m) |
North (m) |
Top | Bottom | |||||
| PB-01 | 3423907.28 | 7380861.37 | 3939.95 | 2010 | 204 | 66 | 186 | Halite with Sand |
| PB-03A | 3425965.69 | 7383015.18 | 3940.3 | 2011 | 201 | 58 | 197 | Interbedded Sand and Halite |
| PB-04 | 3421378.53 | 7381604.24 | 3946.67 | 2011 | 305 | 59 | 297 | Clay/Silt with Sand Interbedded Sand and Halite |
| PB-06A | 3419220.00 | 7377555.48 | 3942.00 | 2011 | 194 | 57 | 191 | Interbedded Sand and Halite Lower Sand |
| PB-I | 3422532.00 | 7385915.00 | 3962.30 | 2011 | 51 | 18 | 44 | Alluvial Fan (Archibarca) |
| W17-06 | 3427261 | 7392988 | 3936.49 | 2018 | 455 | 94 | 437 | Alluvial Fan (East) |
| W18-05 | 3424500 | 7382499 | 3943.12 | 2018 | 270 | 63 | 265 | Alluvial Fan (East) Interbedded Sand and Halite |
| W18-06 | 3426650 | 7385299 | 3945.91 | 2018 | 460 | 63 | 440 | Interbedded Sand and Halite Halite with Sand |
| W04-A | 3422492 | 7379474 | 3937.97 | 2019 | 478 | 73 | 472 | Halite with Sand Interbedded Sand and Halite Halite with Sand Lower Sand Basal Sand |
| W11-06 | 3424279 | 7383792 | 3945.95 | 2019 | 434 | 114 | 422 | Alluvial Fan (Archibarca) Halite with Sand Interbedded Sand and Halite Lower Sand Basal Sand |
| W18-23 | 3423500 | 7381500 | 3941.25 | 2019 | 484 | 70 | 476 | Clay/Silt with Sand Interbedded Sand with Halite Halite with Sand Lower Sand Basal Sand |
| CW-62 | 3425680 | 7388632 | NA | 2019 | 90 | 47 | 86 | Alluvial Fan (East) Clay/Silt with Sand |
| a) coordinates of wells constructed after 2011 based on DEM; wells constructed in 2010 and 2011 are based on reported differential GPS survey (Posgar 94) NA = not available | ||||||||
Lithium Argentina AG., 2026 Cauchari-Olaroz S-K 1300 Technical Report Cauchari-Olaroz Salars, Argentina | Page 416 of 418 |
| Appendix 1 - Summary Tables of Pumping Test Results
for Exploration and Production Wells Exploration and Production Wells |
| Table 2 Hydraulic Results of Pumping Tests at Exploration Wells | |||||||
| Pumped Well Identifier |
Month- Year of Test |
Pumping Period (days) |
Pre- pumping Water Level (m, bls) |
Average Pumping Rate (L/s) |
Drawdown (m) |
Specific Capacity (L/s/m) |
Data Source |
| PB-01 | Mar-2011 | 8 | 4.80 | 4 | 41.27 | 0.097 | LAR 2012 |
| PB-03A | Aug-2011 | 27 | 6.36 | 12 | 31.78 | 0.38 | LAR 2012 |
| PB-03A | Oct-2016 | 12 | 7.79 | 13 | 64.57 | 0.20 | SQM 2016 |
| PB-04 | May-2011 | 31 | 13.50 | 20 | 50.40 | 0.40 | LAR 2012 |
| PB-04 | Sep-2016 | 15 | 10.94 | 25 | 55.28 | 0.45 | SQM 2016 |
| PB-06A | Oct-2011 | 11 | 5.21 | 22 | 40.34 | 0.55 | LAR 2012 |
| PB-06A | Oct-2016 | 10 | 4.19 | 21 | 35.15 | 0.60 | SQM 2016 |
| PB-I | Sep-2011 | 4 | 18.99 | 23 | 3.84 | 6.0 | LAR 2012 |
| W17-06 | Oct-2018 | 7 | 7.46 | 50 | 21.22 | 2.4 | EXAR 2018 |
| W18-05 | Oct-2018 | 11 | NA | 31 | 42.47 | 0.73 | Andina 2018 |
| W18-06 | Jan-2019 | 9 | 5.50 | 17 | 40.74 | 0.42 | EXAR 2019 |
| W04-A | May-2019 | 3 | 11.65 | 25 | 30.00 | 0.83 | EXAR 2019 |
| W11-06 | Jan-2019 | 5 | 13.84 | 30 | 32.82 | 0.91 | EXAR 2019 |
| W18-23 | May-2019 | 4 | 13.43 | 25 | 25.35 | 0.99 | EXAR 2019 |
| CW-62 | Apr-2019 | 4 | 4.62 | 16.5 | 48.71 | 0.34 | EXAR 2019 |
| NA = not available | |||||||
Lithium Argentina AG., 2026 Cauchari-Olaroz S-K 1300 Technical Report Cauchari-Olaroz Salars, Argentina | Page 417 of 418 |
| Table 3 Summary of Computed Aquifer Parameters for Exploration Wells | ||||||||||
| Pumped Well Identifier |
Observation Well Identifier |
Distance from Pumped Well (m) |
Average T (m2/d) |
Estimated Aquifer Thicknessa (m) |
Average Kr (m/d) |
Ratio Kz/Kr |
Average S |
Ss (m-1) |
Average Sy |
Representative HSU(s) |
| PB-01b | PP-1B PP-1C |
71.3 29.8 |
10 | 132 | 0.08 | 0.002 | 3.0E-05 | 2.2E-07 | --- | Halite with Sand |
| PB-03A | PB-03 | 24.0 | 60 | 131 | 0.46 | --- | 2.6E-05 | 2.0E-07 | --- | Interbedded Sand and Halite |
| PB-04 | DDH-12A | 23.8 | 65 | 238 | 0.27 | --- | 1.0E-04 | 4.2E-07 | --- | Clay/Silt with Sand Interbedded Sand and Halite |
| PB-06A | PE-15 PE-17 |
909 1118 |
125 | 121 | 1.0 | --- | 3.0E-03 | 2.4E-05 | --- | Interbedded Sand and Halite Lower Sand |
| PB-I | PP-I | 15 | 1,730 | 26 | 67 | --- | 4.0E-02 | 1.0E-04 | --- | Alluvial Fan (Archibarca) |
| W17-06c | ML-006 DL-006 |
40.9 25.2 |
650 | 373 | 1.7 | 0.3 | 2.5E-03 | 7.0E-06 | 0.18d | Alluvial Fan (East) |
| W18-05 | PE-14 DDH-11 |
1340 1690 |
90 | 202 | 0.45 | --- | 4.0e-04 | 2.0E-06 | --- | Alluvial Fan (East) Interbedded Sand and Halite |
| W18-06 | --- | --- | 70 | 258 | 0.3 | --- | --- | --- | --- | Interbedded Sand and Halite, Halite with Sand |
| W04-A | --- | --- | 170 | 399 | 0.43 | --- | --- | --- | --- | Halite with Sand Interbedded Sand and Halite Halite with Sand Lower Sand Basal Sand |
| W11-06 | --- | --- | 200 | 308 | 0.65 | --- | --- | --- | --- | Alluvial Fan (Archibarca) Halite with Sand Interbedded Sand and Halite Lower Sand Basal Sand |
| W18-23 | --- | --- | 170 | 406 | 0.42 | --- | --- | --- | --- | Clay/Silt with Sand Interbedded Sand with Halite Halite with Sand Lower Sand Basal Sand |
| CW-62 | CM-62 | 8 | 220 | 65 | 3.5 | 0.1 | 3.5E-03 | 5.4E-05 | 0.2d | Alluvial Fan (East) Clay/Silt with Sand |
| a) thickness from top of tested unit to bottom of perforated interval of pumped well b) 28-hour response prior to boundary effect c) 3-day response prior to boundary effect d) estimated; longer duration of pumping is required to confirm estimate | ||||||||||
Lithium Argentina AG., 2026 Cauchari-Olaroz S-K 1300 Technical Report Cauchari-Olaroz Salars, Argentina | Page 418 of 418 |